Engagement Metrics July 2012
•Download as PPTX, PDF•
0 likes•263 views

This document provides data on key performance metrics for Absolute Radio Network's mobile apps, online properties, and broadcast stations from 2009 to mid-2012. It shows trends in app installs and usage across platforms, account registrations, YouTube and website traffic, social media followers, and broadcast radio reach and listening hours in the UK. Overall the data demonstrates growth in the network's digital and mobile businesses while its broadcast business maintained its audience over the period.

More Related Content
What's hot
What's hot (19)
Viewers also liked
Similar to Engagement Metrics July 2012
Similar to Engagement Metrics July 2012 (20)
More from Absolute Radio
More from Absolute Radio (20)
Recently uploaded
Recently uploaded (20)
Engagement Metrics July 2012
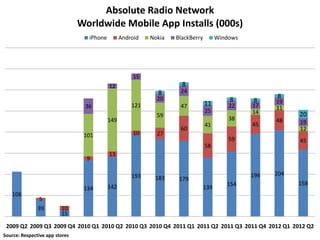
- 1. Absolute Radio Network Worldwide Mobile App Installs (000s) iPhone Android Nokia BlackBerry Windows 15 12 8 8 24 20 8 8 11 8 19 36 121 47 22 17 11 25 14 59 20 149 38 48 41 45 19 60 12 101 10 27 59 45 58 13 9 193 196 204 183 179 154 158 134 142 139 106 5 39 10 15 2009 Q2 2009 Q3 2009 Q4 2010 Q1 2010 Q2 2010 Q3 2010 Q4 2011 Q1 2011 Q2 2011 Q3 2011 Q4 2012 Q1 2012 Q2 Source: Respective app stores
- 2. Absolute Radio Network Worldwide Mobile App Usage Active Users (000s) Sessions (millions) 332 313 307 305 309 300 279 2.42 268 269 2.26 2.27 259 253 2.18 246 2.08 2.11 1.92 1.86 1.76 1.80 1.56 1.58 Oct 2011 Nov 2011 Oct 2011 Nov 2011 Aug 2011 Sep 2011 Jan 2012 May 2012 Sep 2011 Jan 2012 May 2012 Dec 2011 Dec 2011 Mar 2012 Apr 2012 Aug 2011 Mar 2012 Apr 2012 Feb 2012 Feb 2012 Jun 2012 Jul 2012 Jun 2012 Jul 2012 Sources: Spodtronic and Flurry
- 3. Absolute Radio Network Worldwide Mobile App Active Users (000s) Station Players Other Apps 92 77 86 88 93 77 36 48 66 64 42 38 236 241 223 219 212 220 217 216 222 211 207 205 Aug Sep Oct Nov Dec Jan Feb Mar Apr May Jun Jul 2011 2011 2011 2011 2011 2012 2012 2012 2012 2012 2012 2012 Sources: Spodtronic and Flurry
- 4. Absolute Radio Network Total Account Registrations (000s) Legacy Desktop Mobile 900 800 700 600 500 400 300 200 100 0 Jul Aug Sep Oct Nov Dec Jan Feb Mar Apr May Jun Jul 2011 2011 2011 2011 2011 2011 2012 2012 2012 2012 2012 2012 2012 Source: Internal server logs
- 5. Absolute Radio Worldwide YouTube Video Views (000s) 797 750 744 575 541 537 505 510 433 452 411 422 Aug Sep Oct Nov Dec Jan Feb Mar Apr May Jun Jul 2011 2011 2011 2011 2011 2012 2012 2012 2012 2012 2012 2012 Source: YouTube
- 6. Absolute Radio Worldwide YouTube Activity Likes Comments Shares 3,000 2,445 2,500 2,000 1,500 1,183 1,000 500 234 0 Aug Sep Oct Nov Dec Jan Feb Mar Apr May Jun Jul 2011 2011 2011 2011 2011 2012 2012 2012 2012 2012 2012 2012 Source: YouTube
- 7. Absolute Radio Network Worldwide Online Unique Visitors (000s) 557 550 532 520 529 514 507 475 438 444 452 Utility broken Aug Sep Oct Nov Dec Jan Feb Mar Apr May Jun Jul 2011 2011 2011 2011 2011 2012 2012 2012 2012 2012 2012 2012 Source: Piwik
- 8. UK Online Unique Visitors (000s) Mar-12 Apr-12 May-12 Jun-12 Jul-12 Capital Heart FM talkSPORTClassic FM Absolute KISS Smooth Real Magic XFM Network Websites Radio Radio Radio 105.4 Online Network Source: UKOM
- 9. Absolute Radio Network Worldwide Site Traffic Visits (millions) Page Views (millions) 2.2 7.1 2.1 2.1 2.1 6.6 2.0 6.5 1.9 2.0 6.3 1.9 1.9 1.9 6.1 1.8 1.9 5.9 5.8 5.6 5.7 5.4 5.6 4.9 Nov 11 Nov 11 Sep 11 Sep 11 Aug 11 Oct 11 Oct 11 Jan 12 May 12 Jan 12 May 12 Dec 11 Apr 12 Dec 11 Apr 12 Feb 12 Aug 11 Feb 12 Mar 12 Mar 12 Jun 12 Jul 12 Jun 12 Jul 12 Source: Google
- 10. Absolute Radio RadioPlayer Unique Visitors (000s) Visits (000s) 906 906 301 861 293 839 283 282 278 278 813 811 260 257 270 750 746 761 780 686 223 654 215 219 Aug Sep Oct Nov Dec Jan Feb Mar Apr May Jun Jul Aug Sep Oct Nov Dec Jan Feb Mar Apr May Jun Jul 11 11 11 11 11 12 12 12 12 12 12 12 11 11 11 11 11 12 12 12 12 12 12 12 Source: Google
- 11. Absolute Radio Social Media Total Facebook Likes (000s) Total Twitter Follows (000s) Absolute Radio Other Network Pages Absolute Radio Other Network Profiles 201 210 86 89 191 83 177 183 75 78 163 161 171 70 142 149 153 158 62 54 56 59 49 51 84 90 95 30 31 33 34 36 66 69 70 72 73 75 77 79 80 22 27 18 19 20 20 21 Feb 12 Feb 12 Nov 11 Jun 12 Jul 12 Nov 11 Jun 12 Jul 12 Sep 11 Sep 11 Aug 11 Oct 11 Oct 11 Jan 12 May 12 Jan 12 May 12 Apr 12 Apr 12 Dec 11 Aug 11 Dec 11 Mar 12 Mar 12 Source: Facebook and Twitter
- 12. Absolute Radio Network Facebook Talking About (000s) Nov 11 Dec 11 Jan 12 Feb 12 Mar 12 Apr 12 May 12 Jun 12 Jul 12 30.0 25.0 20.0 15.0 13.1 10.0 10.0 7.4 5.0 2.4 0.0 Absolute Breakfast 80s Others Source: Facebook
- 13. 10.0 20.0 30.0 40.0 50.0 60.0 70.0 0.0 Oct 08 Nov 08 Dec 08 Jan 09 Feb 09 Mar 09 Apr 09 May 09 Jun 09 Jul 09 Aug 09 Sep 09 Oct 09 Nov 09 Dec 09 Jan 10 16+ Feb 10 Mar 10 Apr 10 Source: Harris Interactive 16+ UK Online Omnibus (three-month roll) May 10 Jun 10 25-54 Jul 10 Aug 10 Sep 10 Oct 10 Nov 10 Dec 10 Jan 11 Feb 11 Mar 11 25-54 London Prompted Awareness Apr 11 Absolute Radio Network May 11 Jun 11 Jul 11 Aug 11 Sep 11 Oct 11 Nov 11 Dec 11 Jan 12 Feb 12 Mar 12 Apr 12 May 12 Jun 12 Jul 12 38.9 47.6 64.7
- 14. National Prompted Awareness Sep-11a Sep-11b Oct-11 Nov-11 Dec-11 Jan-12 Feb-12 Mar-12 Apr-12 May-12 Jun-12 Jul-12 90 80 76.1 73.8 70 66.9 59.5 60 50.8 50 45.7 42.2 38.9 38.0 40 29.3 30 24.4 21.6 21.0 20 18.1 10 0 Source: Harris Interactive 16+ UK Online Omnibus (three-month roll)
- 15. London Prompted Awareness Sep-11a Sep-11b Oct-11 Nov-11 Dec-11 Jan-12 Feb-12 Mar-12 Apr-12 May-12 Jun-12 Jul-12 90 78.9 80 73.5 72.6 71.2 70 68.8 60 54.6 53.1 50 48.4 46.8 43.8 40.1 40 30 20 10 0 Capital Kiss Heart Magic Classic FM Absolute LBC Talk Sport Smooth Xfm Absolute Network Radio Source: Harris Interactive 16+ UK Online Omnibus (six-month roll)
- 16. Absolute Radio Network Weekly Reach (millions) W2:11 W1:12 W2:12 3.2 3.2 3.1 3.0 2.9 3.0 1.3 1.3 1.2 1.1 1.1 1.1 Total 10+ Total 15+ London 10+ London 15+ Source: RAJAR
- 17. Absolute Radio Network Monthly Reach (millions) W2:11 W1:12 W2:12 5.2 5.4 5.3 4.9 4.8 4.9 2.1 2.1 1.9 1.8 1.8 1.8 Total 10+ Total 15+ London 10+ London 15+ Source: RAJAR
- 18. Absolute Radio Network Weekly Hours (millions) W2:11 W1:12 W2:12 25.3 25.1 24.5 24.3 21.3 20.9 10.0 10.1 9.9 10.0 7.3 7.2 Total 10+ Total 15+ London 10+ London 15+ Source: RAJAR