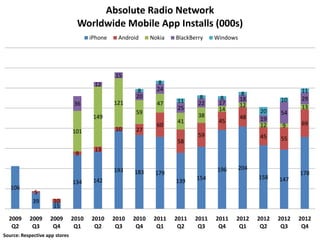
This document provides mobile app usage data, online traffic statistics, and audience metrics for Absolute Radio Network. Key points:
1) Absolute Radio's mobile app installs increased year-over-year, with over 193,000 installs in Q4 2012 across various mobile platforms.
2) The network saw growth in both active mobile app users and sessions in 2012. Station Players was the most used app with over 200,000 active users in December 2012.
3) Online traffic to Absolute Radio sites and YouTube videos increased throughout 2012 across various metrics like unique visitors, page views, and video views.
4) Audience awareness and reach of Absolute Radio Network grew in the UK, with prompted awareness rising to
The document provides analytics data for the Absolute Radio Network across multiple platforms from 2009 to 2012. It shows trends in app installs, usage, active users, visits and other metrics over time for mobile, online, social media and other platforms. Overall network reach and hours were down slightly in the most recent reporting period compared to the same time last year.
The documents provide analytics data for the Absolute Radio Network across multiple platforms from 2009 to 2012. Overall, the network saw growth in mobile app installs and usage, online visitors and traffic, social media followers and engagement, and radio listenership. However, prompted awareness declined both nationally and in London over the period.
The document provides mobile app installation, usage, and registration statistics for Absolute Radio Network from 2009 to 2012. It shows that Android app installs increased over time while Blackberry installs decreased. Active users peaked at 313,000 in November 2011 while sessions peaked at 2.42 million in October 2011. iPad app visits increased for the station player app but decreased for live scores between August and September 2012. Total account registrations increased over time with more coming from mobile than desktop or legacy sources. YouTube video views peaked at 797,000 in an unspecified time period.
This document provides data on key performance metrics for Absolute Radio Network's mobile apps, online properties, and broadcast stations from 2009 to mid-2012. It shows trends in app installs and usage across platforms, account registrations, YouTube and website traffic, social media followers, and broadcast radio reach and listening hours in the UK. Overall the data demonstrates growth in the network's digital and mobile businesses while its broadcast business maintained its audience over the period.
The document contains data from Absolute Radio Network on their worldwide mobile app installs, usage, and registrations from 2009 to 2012. It shows the number of installs by platform, active users and sessions over time, total account registrations by type, YouTube video views over time, and YouTube activity metrics over time. The data demonstrates Absolute Radio Network's growth in mobile app installs and users as well as engagement on their YouTube channel from 2011 to 2012.
The document contains data on app installs, usage, registrations, and online activity for Absolute Radio Network from 2009 to 2012. It shows:
1) App installs grew significantly from 2009 to 2012, especially for Android and iPhone.
2) App active users and sessions peaked in late 2011 and early 2012 before declining slightly.
3) Total account registrations, including mobile and desktop, increased steadily throughout the period shown.
4) YouTube video views and engagement in terms of likes, comments, and shares also increased over time.
The document provides analytics data for the Absolute Radio Network across multiple platforms from 2009 to 2012. It shows trends in key metrics such as mobile app installs and usage, online visitors and traffic, social media followers and engagement, and radio listenership over time. Overall, the data demonstrates growth in the network's digital presence and audience while its broadcast radio reach and hours remained relatively stable.
The document provides analytics data for Absolute Radio Network's mobile app installs, active users, sessions, registered accounts, and YouTube video views from 2009 to 2012. It shows steady growth in installs and usage across iPhone, Android, Nokia, BlackBerry, and Windows platforms over time. Active users and sessions for the station player app and other Absolute Radio apps increased between 2011 and 2012. Total registered accounts also grew steadily from 2011 to 2012 across legacy, desktop, and mobile platforms. YouTube video views peaked in July 2011 and remained high but levelled off between 500,000 to 800,000 views per month thereafter.
Absolute Radio saw steady growth in mobile app installs across all major platforms from 2009 to 2011. Mobile app active users and sessions increased from 2011 to early 2012. The number of registered accounts grew steadily from February 2011 to January 2012. YouTube video views for Absolute Radio peaked in July 2011 and remained strong. YouTube activity for Absolute Radio, as measured by likes, comments and shares, was highest in January 2012.
Absolute Radio saw steady growth in mobile app installs and usage from 2009 to 2011 across various mobile platforms. The number of active mobile app users increased from 219,000 in July 2011 to 236,000 in January 2012. Over the same period, registered accounts grew from 125,000 in June 2011 to 175,000 in January 2012. The network also saw increasing engagement on YouTube, as demonstrated by rising video views, likes, comments and shares.
The document provides data on app installs, usage, and social media metrics for Absolute Radio Network from 2009 to 2011. Key points:
- App installs grew significantly from 2009 to 2010 across iPhone, Android, Nokia, and other platforms. Installs remained high through 2011.
- Active users of Absolute Radio apps ranged from 200,000 to over 300,000 monthly from January 2011 to December 2011.
- YouTube video views for Absolute Radio content were between 400,000 and 800,000 monthly from January to December 2011.
- Absolute Radio's Facebook page grew from around 72,000 likes to over 89,000 likes. The network's Twitter following increased similarly over the period shown.
1) The document provides statistics on app installs, usage, and listenership for Absolute Radio Network across various platforms from 2009-2011. It shows growth in installs and usage of mobile apps as well as increasing online and social media engagement over time.
2) Absolute Radio saw increasing mobile app installs, active users, and on-demand streaming hours from 2009-2011. Social media followers and engagement also grew steadily across platforms.
3) Listenership metrics like reach and hours spent listening increased over the periods reported for both Absolute Radio and the Absolute Radio Network overall. Awareness of the brand also improved according to survey data.
1) The 2009 Environmental Report from Ehime University summarizes initiatives related to sustainable development, environmental studies programs, and carbon emissions reductions.
2) Data is presented on forest resources, pollution releases, energy usage, and carbon emissions from 1990-2020 with a focus on reducing impacts.
3) Efforts include the Center for Marine and Environmental Studies, overseas cooperation in environmental fields, and promoting environmental education.
The document contains several charts and tables showing metrics for Absolute Radio Network's worldwide live streaming hours, mobile streaming hours, mobile app installs, and mobile app usage from November 2010 to October 2011. The metrics show steady growth over time in live streaming hours across Absolute Radio and its sister stations, increased mobile streaming as a percentage of total streaming, rising mobile app installs and active users, and growing mobile streaming hours and sessions.
The document discusses the performance of India's Media and Entertainment industry in 2009 and the outlook for 2010. It notes that the industry grew only 1.5% in 2009 due to the economic slowdown but is expected to recover in 2010 with 11.1% growth. Television was the strongest segment in 2009 while films fared the worst. Overall, the industry is projected to have a compound annual growth rate of 13.3% through 2014 to reach a size of Rs. 1,094 billion. Advertising spending was flat in 2009 but also expected to rebound with 12.1% growth in 2010. Low media spending in India indicates significant potential for future expansion.
Nanoholdings is an early-stage nanotechnology startup that aims to commercialize energy discoveries using nanotechnology. It partners with universities worldwide and generates returns for investors like Morgan Stanley. The company's mission is to reduce huge inefficiencies in the world energy market, like the 55% of U.S. energy that is wasted. Nanotechnology could help create or change massive industries like energy within 17-23 years by improving efficiency.
The document summarizes a meeting between TIM Brasil and investors in September 2012.
1) TIM Brasil's mobile business revenue grew 11% while Brazilian GDP grew only 1.9%, showing that mobile is driving economic growth.
2) Fixed to mobile substitution continues to impact fixed line incumbents, benefiting the mobile segment. TIM's mobile revenue grew 7.9% in 2Q12 while fixed revenue declined for competitors.
3) TIM's 2Q12 results met guidance, with total revenue up 7% and EBITDA up 6%. Revenue was impacted by MTR cuts but growth was driven by prepaid and data. Fiber deployment
HES2011 - Richard Johnson - A Castle Made of Sand Adobe Reader X SandboxHackito Ergo Sum
The document discusses Adobe Reader's use of sandboxing to improve security. It provides background on past vulnerabilities in Adobe Reader and discusses the architecture of the Adobe Reader X sandbox. The sandbox isolates rendering code in a lower privileged process and uses a higher privileged broker process to validate and fulfill requests for system resources according to internal policy. The document outlines how to analyze the sandbox's security mechanisms, such as by determining the rights of processes, auditing the IPC mechanisms, and fuzzing the resource request validation.
This presentation provides key metrics for Facebook's Q2 2012 earnings, including monthly active users (MAUs), daily active users (DAUs), and mobile users. It notes that the presentation contains forward-looking statements and that non-GAAP financial measures are included in addition to GAAP measures. Metrics shown include growth in worldwide and regional MAUs, DAUs, and mobile MAUs from Q2 2010 to Q2 2012, with over 955 million MAUs, 552 million DAUs, and 543 million mobile MAUs as of Q2 2012. Revenue increased to $1,184 million in Q2 2012 compared to $1,058 million in Q1 2012, with advertising revenue comprising the majority and payments
Norcal Neuro August Recap Salesand Marketing Wrapped Finaljay_brunz
The document provides sales and marketing recaps for Neuro NorCal in August 2011. It summarizes distributor sales performance, buying reports, sales metrics, and marketing events including sampling at Walgreens stores, media placements, an Earthquakes soccer game, a paintball event, Bevmo stores, and Outside Lands music festival in San Francisco. Overall, marketing events in August sampled over 1,000 people and generated over 120,000 impressions to help boost sales.
The document summarizes Embraer's financial results and outlook. It shows that from 2005-2011, Embraer achieved a 40% reduction in production cycle times for E-Jets and a 44% reduction in cost of non-quality. Embraer also saw increases in aircraft deliveries, backlog, revenues, and income from operations over this period. For 2012, Embraer expects deliveries of 105-110 commercial jets and 75-85 light jets, with net revenues of $5.8-6.2 billion and EBIT margin of 8.0-8.5%. Research, development and CAPEX are budgeted at $650 million.
This document provides metrics on the performance of Absolute Radio Network's mobile apps, websites, social media presence, and broadcast radio from 2009 to 2012. It includes data on app installs and usage, online visitors and traffic, social media followers and engagement, YouTube views and activity, and radio reach and listening hours in the UK. The data shows steady growth in the network's digital platforms over time while its broadcast radio listening remained relatively stable.
The document contains multiple charts and tables showing metrics for the Absolute Radio Network from October 2010 to September 2011. It shows data on worldwide live streamed hours, mobile streamed hours, podcast downloads, YouTube views, on-demand streaming and downloads, social media followers, and national brand awareness and reach according to RAJAR data from the UK. Overall the data indicates growing audiences and consumption across both online and mobile platforms internationally for the Absolute Radio Network over the period shown.
The document discusses the mobile phone market and the Android operating system. It provides market share data showing Android's growing popularity from 2010 to 2011. It notes that Android is an open source operating system developed by Google that allows for customization by manufacturers and developers. Over 350,000 applications are available on the Android Market. The document also highlights key features of Android like its fast internet browsing, multi-tasking abilities, and ongoing improvements through software updates.
This document discusses opportunities in the silver market for small and medium enterprises. It was presented by Erwin Huang, the convenor of the Silver Market Consortium, in August 2012. Survey results are shown from 440 respondents on their technology usage, with most being female aged 55-74, and spending over $5,200 annually on healthcare. The document argues that opportunities exist in digital inclusion and addressing the needs of older users, who can be toughest customers. Communication was identified as an important market opportunity area.
This document provides an overview of Mie University's environmental management activities in 2007. It discusses the university's acquisition of ISO 14001 certification, participation in working groups to promote environmental management systems, and key environmental initiatives including reducing CO2 emissions and promoting sustainability. The document also includes statistical data on the university's environmental performance and a calendar of ISO-related events in 2007-2008.
This document provides a cheat sheet for subnet ranges and prefix lengths in Vyatta. It includes four columns showing host or network numbers from 0-255 for prefix lengths of /8, /16, /24, and /32. Special use IPv4 addresses and private AS numbers are listed. The cheat sheet allows identifying subnets and addresses within a given prefix length by comparing shading of rows.
The document summarizes a meeting between TIM Brasil and investors in September 2012.
1) TIM Brasil's mobile business continues to outpace GDP growth in Brazil and take a large part of overall growth.
2) The Brazilian telecommunications market is transforming with mobile overtaking fixed lines, moving towards a 60/40 split. This fixed-to-mobile substitution benefits mobile segments like TIM Brasil.
3) TIM Brasil's Q2 2012 results met guidance targets, with double-digit revenue and EBITDA growth despite impacts from MTR cuts and macroeconomic challenges. Operational growth in customer base and data usage remained strong.
1) Thompson's Trucking tested the fueldaddy system on two trucks over their first month of use, tracking fuel usage and mileage before and after installation.
2) For truck #194, a Peterbilt 386, fuel usage decreased by 6.71% after installation, saving 198 gallons of fuel over 15,474 miles and saving $713.91 at $3.60 per gallon.
3) For truck #210, an International Pro Star, fuel usage also improved after installation though specific results were not reported.
This document discusses the ongoing media revolution brought about by digitalization and the internet. It notes that the changes happening are more rapid than media companies can adapt to. Users now control media consumption through internet-connected devices. Within 10 years, all media will be delivered over IP networks, eliminating print newspapers and magazines. This represents major structural changes and financial challenges for traditional media businesses. Two key challenges are developing new business models and understanding how to survive and prosper in the digital age. The future remains uncertain but some trends are clear, such as increased user engagement and more targeted advertising through user data. Media companies must explore new opportunities through digital innovation and platforms that extract value while growing network size.
The document provides tips for building financial models. It recommends designing a model on paper first before building it in a spreadsheet. The model should be built in logical modular steps and simplified as much as possible while still answering the key business questions. Key steps in building a valuation model include entering historical financial data, projecting "vanilla" assumptions, debugging the model, developing business assumptions and scenarios, and calculating terminal values and equity value. The document emphasizes focusing on the most important drivers and ratios, setting up formulas so changing one cell impacts all related cells, and remembering the overall purpose of the model is to provide insights, not accounting perfection.
The document compares mobile news consumption habits among university students in 4 cities: Shanghai, Hong Kong, Taipei, and Singapore. It finds that while habits are generally similar, there are some key differences. Students in Shanghai and Singapore tend to consume more news via websites and apps compared to the other cities. Shanghai students also stand out in preferring to customize news delivery by watching videos and commenting, while students in Hong Kong and Taipei place more value on correcting factual errors.
Digital trends in Vietnam 2013, Strategy for businessBui Hang
Bài thuyết trình của Mr. Tom Simpson - Trưởng bộ phận truyền thông số (Head of Digital) thuộc Mindshareworld, công ty thuộc GroupM tại Hội nghị Định hướng tiếp thị trực tuyến 2013 tổ chức ngày 29/11/2012 tại HCM. Chi tiết Hội nghị xem tại http://hoinghi.marketingonline.vn
Digital Trends 2013 by Tom Simpson - Mindshare VN - Nov'12 New Business
Digital technologies have profoundly changed how people consume media and interact with brands. Over the past 17 years, downloading a song has gone from taking 25 minutes to just 25 seconds on a mobile phone. Internet and social media usage has skyrocketed while time spent watching traditional TV has declined, especially among younger demographics. Vietnamese now spend 134 minutes online per day on average and 72% have a social media profile. Mobile internet access has also grown significantly, with 51% of online adults using it 27 times per month. As trust in traditional media and advertising has decreased, people now actively seek information from each other through social sharing across multiple platforms. Marketers must recognize that the lines between physical and digital worlds have blurred for consumers and communication needs
1) Thompson's Trucking conducted a road test of two trucks over one month to compare fuel efficiency before and after installing a new system. Truck #194 saw a 6.71% improvement in average MPG, saving 198 gallons of fuel over 15,474 miles for a savings of $713.91 at $3.60 per gallon.
2) Truck #210's testing also showed improved fuel efficiency and MPG after installing the new system.
3) The road test provided performance metrics to evaluate the impact of the new system on the company's fuel costs and truck efficiency over the first month of use.
There’s a lot to making a great video… one that connect with an audience and drives them to action. Of course video can be both expensive and time consuming. In this session, web video expert Rich Harrington shares practical advice that won’t break the bank. He’ll share techniques his used for big brands like Apple, the American Red Cross, the Family Online Safety Institute and more.
You’ll learn industry secrets like:
What’s the right length to keep someone watching?
How can you ensure your audio doesn’t suck?
When should you use graphics to inform the viewer?
How do the pros create messages that stick in the viewer’s brain?
What role does music play in a successful video?
The document analyzes the financial performance of Cognizant Technology Solutions from 2006-2011. It shows that Cognizant experienced significant yearly revenue growth, except in 2009 during the global financial crisis. While operating expenses were reduced in 2009, they increased in line with revenue growth thereafter. Cognizant has overtaken Wipro to become the third largest Indian IT services provider. The majority (around 80%) of Cognizant's revenues come from North America, with Europe accounting for 18-19%. Key verticals are financial services, healthcare, and manufacturing/retail/logistics.
The document shows a diagram with numbered shapes arranged in different positions on the page. It includes various geometric shapes such as circles, squares, triangles in no apparent order. There are 25 shapes total labeled with numbers throughout the diagram.
Capitol Tweets: Yeas and Nays of the Congressional TwitterverseEdelman
Edelman’s Capitol Tweets study looks at U.S. Congressional performance on Twitter, including regional differences and levels of bipartisan engagement. These slides feature supporting graphs from the analysis.
The document shows charts tracking the growth of e-commerce sales in China from 1997 to 2009, with sales increasing from 1.2 billion RMB in 1997 to over 9,000 billion RMB in 2009. A second chart shows the transaction value of China's B2C e-commerce growing from 1.52 billion RMB in 2006 to 2.46 billion RMB in 2010. A third chart breaks down China's e-commerce market by business model in 2010, with B2B accounting for 32% and B2C making up 47.5%.
This document provides dimensional properties for various UPN steel beam shapes. It includes dimensions for the height, width, thicknesses, radii, slopes, cross-sectional areas, weights, and other geometric properties. The table lists these specifications for UPN beams ranging in size from 80x45x6 mm to 400x110x14 mm.
Absolute Radio Engagement Metrics December 2013Absolute Radio
The document provides analytics data for the Absolute Radio Network from 2009 to 2014. It includes statistics on mobile app installs and usage, website traffic and listenership, social media followers, and brand awareness over time. Overall, the data shows steady growth in the network's digital presence and audience engagement across platforms over the 5-year period.
Absolute Radio Engagement Metrics November 2013Absolute Radio
This document contains metrics for the Absolute Radio Network from 2009 to 2013 across various platforms including mobile app installs and usage, account registrations, logged in listeners, YouTube views and engagement, website traffic and visitors, social media followers, and awareness and listenership data from RAJAR. The metrics show overall growth in installations and usage of the mobile apps, website traffic, social media followers, and awareness and reach of the Absolute Radio Network over this time period.
Absolute Radio Engagement Metrics October 2013Absolute Radio
The document provides analytics data for the Absolute Radio Network across multiple platforms from 2009 to 2013. It shows metrics such as worldwide mobile app installs and usage, total account registrations, logged in listeners, YouTube video views and activity, unique site visitors and traffic, RadioPlayer visitors and traffic, social media followers, and prompted awareness and reach according to RAJAR data. The data demonstrates growth in the network's online and mobile presence and audience over time.
Absolute Radii Media evaluation october 2013Absolute Radio
The document contains charts showing press cut metrics including total press cuts, circulation, and advertising value equivalents over time. It also contains charts displaying blog visit, unique visitor, and pageview metrics for an organization's blog over multiple months according to Google Analytics.
Absolute Radio Engagement Metrics September 2013Absolute Radio
The document contains metrics for the Absolute Radio Network mobile app, website, social media and broadcast radio stations from 2009 to 2013. It shows trends in installs, active users, sessions and account registrations for the mobile app over time and across platforms. It also includes data on unique visitors, traffic, listeners and reach for the website, social media channels and radio stations. The metrics indicate growing mobile app usage, online traffic and social media followers but declining national prompted awareness and reach for the radio stations over the periods shown.
Absolute Radio Engagement Metrics August 2013Absolute Radio
This document contains various metrics tracking the performance of the Absolute Radio Network mobile apps, social media presence, online listenership, and brand awareness over time. The metrics show steady growth in app installs and usage, social followers, unique visitors, and awareness from September 2012 to August 2013. Brand prompted awareness increased nationally from 22% to over 77% during this period.
Absolute Radio Engagement Metrics July 2013Absolute Radio
This document contains charts and graphs showing key performance metrics for the Absolute Radio Network mobile apps, websites, social media profiles, and radio listenership over time. The metrics indicate growing app installs and usage, increasing social media followers and engagement, and mostly steady online and radio audiences for the Absolute Radio Network from August 2012 to July 2013.
Absolute Radio Engagement Metrics June 2013Absolute Radio
This document contains charts and graphs showing various metrics for the Absolute Radio Network from 2009 to 2013, including mobile app installs and usage, social media followers, online traffic and engagement, radio listening, and brand awareness. Overall it shows steady growth in the network's digital presence and audience over this period.
Absolute Radio Engagement Metrics May 2013Absolute Radio
This document contains charts and graphs showing key performance metrics for the Absolute Radio Network from June 2012 to May 2013 across platforms like mobile apps, websites, YouTube, social media and more. Overall network awareness, reach and listening hours increased over the period for both national and London audiences according to data from app stores, Google Analytics, Facebook, and RAJAR.
Absolute Radio Engagement Metrics April 2013Absolute Radio
This document contains various metrics tracking the performance of the Absolute Radio Network across platforms like mobile apps, websites, social media, and traditional radio from May 2012 to April 2013. Key metrics included rising mobile app installs and usage, growing social media followers, increasing online traffic and video views, and steady radio listening hours despite a decline in reach. Overall these metrics indicate that the Absolute Radio Network was experiencing positive trends in multi-platform growth and engagement during this period.
This document contains charts and graphs depicting key performance metrics for the Absolute Radio Network from April 2012 to March 2013. It shows trends in mobile app installs and usage, online listenership across platforms, social media engagement, brand awareness, and radio reach and hours. Overall, the data indicates that while some metrics such as app installs and online visitors fluctuated over time, the network maintained a consistent national radio audience reach of around 3 million weekly listeners.
Radio is facing challenges with declining time spent listening and revenue beyond inflation. New internet and mobile platforms are disrupting the industry. RadioPlayer is a new mobile app that has over 9 million users listening to radio in a single interface. It allows radio stations to provide on-demand content and target ads to listeners based on location and other data. Instream advertising within RadioPlayer allows radio stations to target ads to individuals during programming breaks based on their profile, with early results showing more positive responses to branded content compared to traditional broadcast radio. The future of Instream is to expand targeted advertising to third party apps and provide more interactive, visual and social experiences for listeners.
The document discusses trends in radio and internet advertising shares from 2005 to 2011, showing radio's declining share against the rising share of internet advertising. It also discusses how radio is adapting to the digital age by using personalized data on users to target ads better and provide more interactive content and services to listeners on digital platforms. In-stream ads within live radio programming are shown to generate significantly higher brand awareness and more positive feelings from listeners than traditional commercial breaks.
The document compares radio advertising shares from 2005 to 2011, showing a decline in radio from 82% to around 27% as internet advertising shares rose. It suggests that radio can be redefined for the digital age by personalizing advertising using listener data like birthyear, gender and location. Charts show that over half of listeners to a digital radio platform were logged in, allowing for more targeted and accountable advertising that generates more positive feelings than traditional radio ads.
This document summarizes a report about the media industry in 2012. It includes:
- Interviews and surveys with 10 media planners and 5 industry leaders.
- A focus on how clients are increasingly demanding evidence from agencies and case studies showing effectiveness.
- Discussion of how "big data" is a major trend in 2012, with agencies and clients seeking to combine various business data sources and wanting real-time insights.
- Charts showing how various media companies were perceived in 2012 in terms of their offerings and industry presence.
Additional Music Research Questions August 2012 OlympicsAbsolute Radio
A survey was conducted before and after the 2012 London Olympics with listeners in London aged 25-44 from 50% Absolute P1 radio stations. [1] Before the games, 53% said they were looking forward to the Olympics, increasing to 78% after who said they enjoyed the games. [2] 68% planned to watch the games on TV (90% did) and 15% planned to visit BT London Live (20% did). [3] 13% recalled Lloyds TSB sponsored Johnny Vaughan Live from Hyde Park and 35% said it made them feel more positive towards the brand.
The document shows charts of radio station listenership shares in London for adults 15+ and men 15+ for weekdays in half hour intervals from 6am to 11pm in Q2 of 2012. Capital radio had the highest overall share for most time periods for both demographics, followed by Heart and Magic. Talk Sport saw higher shares during morning and afternoon commute times. Absolute Radio Network had a consistent lower share across all time periods.
Christian O'Connell's breakfast show on Absolute Radio in London saw a 45% increase in total hours listened to between weeks 1 and 2 of 2022, moving it to the number two commercial breakfast show in London behind BBC Radio London. A chart shows the total hours listened to each week for the top 15 breakfast shows in London, with Christian O'Connell's show increasing from 5,261 hours in week 1 to 8,918 hours in week 2.
Twitter presentation Absolute Radio - Laura Tannenbaum - Brand Marketing Man...Absolute Radio
82% of Absolute Radio's audience listens digitally. To incentivize trial of the station and raise awareness of its music, Absolute Radio ran a competition where they gave away £250 every hour for 24 hours to those who listened and tweeted the artist playing along with #nowplaying. This resulted in over 8.5 million impressions of the trend and 2,500 new followers, far exceeding benchmarks. Mentions of promoted artists increased substantially. The campaign was successful due to the viral nature of combining radio and Twitter into a real-time, conversational promotion.
2. Absolute Radio Network
Worldwide Mobile App Usage
Active Users (000s) Sessions (millions)
332
307 305 309
300
290 295 286 290
276 2.42
2.26 2.27
253 2.11
246 2.08 2.04
1.92 1.97
1.83
1.70
1.56 1.58
Oct 2012
Nov 2012
Oct 2012
Nov 2012
Jan 2012
May 2012
Aug 2012
Sep 2012
May 2012
Aug 2012
Sep 2012
Dec 2012
Dec 2012
Mar 2012
Apr 2012
Mar 2012
Apr 2012
Feb 2012
Jan 2012
Feb 2012
Jun 2012
Jul 2012
Jun 2012
Jul 2012
Sources: Spodtronic and Flurry
3. Absolute Radio Network
Worldwide Mobile App Active Users (000s)
Station Players Other Apps
92
86 88 93 77 68 75
74 81
70
42 38
241
220 217 216 222 211 207 221 219 211 209
206
Jan Feb Mar Apr May Jun Jul Aug Sep Oct Nov Dec
2012 2012 2012 2012 2012 2012 2012 2012 2012 2012 2012 2012
Sources: Spodtronic and Flurry
4. Absolute Radio Network
Worldwide Mobile App Visits from iPads
iPad App Visits %
21.8
17.8
16.4 16.1
15.5
8.8 9.2 8.8
8.5 8.2
Live Scores Station Players
Aug-12 Sep-12 Oct-12 Nov-12 Dec-12
Source: Google
5. Absolute Radio Network
Total Account Registrations (000s)
Legacy Desktop Mobile
1,200
1,000
800
600
400
200
0
Jan Feb Mar Apr May Jun Jul Aug Sep Oct Nov Dec
2012 2012 2012 2012 2012 2012 2012 2012 2012 2012 2012 2012
Source: Internal server logs
6. Absolute Radio
Worldwide YouTube Video Views (000s)
744
575 562
537
510 501
452 453
433 422
398
352
Jan Feb Mar Apr May Jun Jul Aug Sep Oct Nov Dec
2012 2012 2012 2012 2012 2012 2012 2012 2012 2012 2012 2012
Source: YouTube
7. Absolute Radio
Worldwide YouTube Activity
Likes Comments Shares
3,000
2,757
2,500
2,000
1,500
985
1,000
500 374
0
Jan Feb Mar Apr May Jun Jul Aug Sep Oct Nov Dec
2012 2012 2012 2012 2012 2012 2012 2012 2012 2012 2012 2012
Source: YouTube
8. Absolute Radio Network
Worldwide Online Unique Visitors (000s)
557 550
532 529 534 533 536
514 520 507 515 508
Jan Feb Mar Apr May Jun Jul Aug Sep Oct Nov Dec
2012 2012 2012 2012 2012 2012 2012 2012 2012 2012 2012 2012
Source: Piwik
10. Absolute Radio Network
Worldwide Site Traffic
Visits (millions) Page Views (millions)
7.1
2.1 2.1 2.1 6.6
2.0 6.5
2.0 2.0
1.9 1.9 1.9 6.1 6.0
1.8 1.8 5.8 5.8 5.8
1.8 5.6
5.4 5.3
4.9
Nov 12
Nov 12
Sep 12
Sep 12
Jan 12
May 12
Aug 12
Oct 12
May 12
Aug 12
Oct 12
Apr 12
Dec 12
Apr 12
Dec 12
Feb 12
Mar 12
Jan 12
Feb 12
Mar 12
Jun 12
Jul 12
Jun 12
Jul 12
Source: Google
11. Absolute Radio
RadioPlayer
Unique Visitors (000s) Visits (000s)
906
301 861 866 852
293 839
283 282 278 278 811
270
262 262 261 746 761 780 765
732
248 689
228
Jan Feb Mar Apr May Jun Jul Aug Sep Oct Nov Dec Jan Feb Mar Apr May Jun Jul Aug Sep Oct Nov Dec
12 12 12 12 12 12 12 12 12 12 12 12 12 12 12 12 12 12 12 12 12 12 12 12
Source: Google
12. Absolute Radio
Social Media
Total Facebook Likes (000s) Total Twitter Follows (000s)
Absolute Radio Other Network Pages Absolute Radio Other Network Profiles
19
18
132 135
123 128 20
114 119
111
103 107 16
87 95 98 15
14
12 13 13 80
71
10 11
9 57
46
96 98 100 103 105 106 36 39
75 77 79 80 84 90 30 31 33 34
22 27
Feb 12
Feb 12
Jun 12
Jul 12
Nov 12
Jun 12
Jul 12
Nov 12
Sep 12
Sep 12
Jan 12
May 12
Aug 12
Oct 12
May 12
Aug 12
Oct 12
Apr 12
Apr 12
Dec 12
Dec 12
Mar 12
Jan 12
Mar 12
Source: Facebook and Twitter
13. Absolute Radio Network
Facebook Talking About (000s)
Jan 12 Feb 12 Mar 12 Apr 12 May 12 Jun 12 Jul 12 Aug 12 Sep 12 Oct 12 Nov 12 Dec 12
40.0 38.0
35.0
30.0
25.0
20.0
15.0
10.0 8.9
7.6
5.0 3.5
0.0
Absolute Breakfast 80s Others
Source: Facebook
14. 10.0
20.0
30.0
40.0
50.0
60.0
70.0
80.0
0.0
Oct 08
Nov 08
Dec 08
Jan 09
Feb 09
Mar 09
Apr 09
May 09
Jun 09
Jul 09
Aug 09
Sep 09
Oct 09
Nov 09
Dec 09
Jan 10
Feb 10
Mar 10
16+
Apr 10
May 10
Jun 10
Source: Harris Interactive 16+ UK Online Omnibus (three-month roll)
Jul 10
Aug 10
25-54
Sep 10
Oct 10
Nov 10
Dec 10
Jan 11
Feb 11
Mar 11
Apr 11
May 11
Jun 11
25-54 London
Prompted Awareness
Jul 11
Aug 11
Absolute Radio Network
Sep 11
Oct 11
Nov 11
Dec 11
Jan 12
Feb 12
Mar 12
Apr 12
May 12
Jun 12
Jul 12
Aug 12
Sep 12
Oct 12
Nov 12
Dec 12
36.6
45.1
56.5