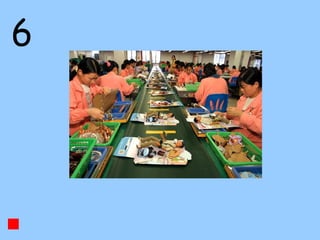
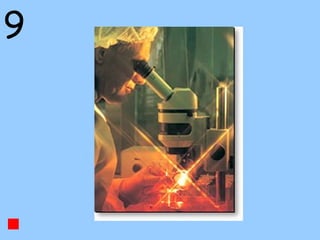
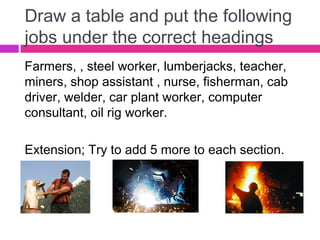
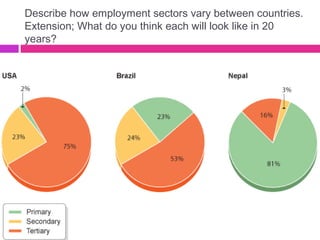
Economic Activity
Key questions
What are the different types of economic
activity?
How does each sector change with
development?
Learning objectives
 To know the 4 sectors of economic activity
 To be able to categorise different jobs
Video
 Listen out for the key definitions!
Keywords
 Primary Activity – Extracts raw materials
 Secondary Activity – Processes the raw
materials
 Tertiary Activity – Provides a service
 Quaternary Activity - Collecting and providing
specialist information. Working in research
and development, hi-tech industries, science
etc.
1 2 3
4 5 6
7 8 9
Which job sector are these?
1
2
3
4
5
6
7
8
9
What goes into this?
 Put the following components in order and
explain how they fit into their sector.
Draw a table and put the following
jobs under the correct headings
Farmers, , steel worker, lumberjacks, teacher,
miners, shop assistant , nurse, fisherman, cab
driver, welder, car plant worker, computer
consultant, oil rig worker.
Extension; Try to add 5 more to each section.
Describe how employment sectors vary between countries.
Extension; What do you think each will look like in 20
years?
How has employment changed
over time?
 Draw a time line starting at 1700 and finishing at 2050 (use intervals of 50). At each stage explain how
you think the UK employment structure has changed. You may want to draw pie charts to represent
this. You can also illustrate the time line!
 Some key events to help you.
 1750-1800 Agricultural revolution
 1800-1850 Industrial revolution
 1900-1950 London was a very busy important port
 1914-1918- WW1
 1939 – 1945 WW2
 1980 Closure of mines
 1990 Closure of Car factories
 2000 More money being spent in shops
 2000 Growth of banking industry
 2005 People have more leisure time than ever before
 2010 Apple move to London
 2012 London Olympics
 Can you think of any other key events?
 Extension: How do you think China’s structure has changed over time? Draw 3 pie charts to illustrate
your answer!

Economic activity

  • 1.
    Economic Activity Key questions Whatare the different types of economic activity? How does each sector change with development?
  • 2.
    Learning objectives  Toknow the 4 sectors of economic activity  To be able to categorise different jobs
  • 3.
    Video  Listen outfor the key definitions!
  • 4.
    Keywords  Primary Activity– Extracts raw materials  Secondary Activity – Processes the raw materials  Tertiary Activity – Provides a service  Quaternary Activity - Collecting and providing specialist information. Working in research and development, hi-tech industries, science etc.
  • 5.
    1 2 3 45 6 7 8 9 Which job sector are these?
  • 6.
  • 7.
  • 8.
  • 9.
  • 10.
  • 11.
  • 12.
  • 13.
  • 14.
  • 15.
    What goes intothis?  Put the following components in order and explain how they fit into their sector.
  • 17.
    Draw a tableand put the following jobs under the correct headings Farmers, , steel worker, lumberjacks, teacher, miners, shop assistant , nurse, fisherman, cab driver, welder, car plant worker, computer consultant, oil rig worker. Extension; Try to add 5 more to each section.
  • 18.
    Describe how employmentsectors vary between countries. Extension; What do you think each will look like in 20 years?
  • 19.
    How has employmentchanged over time?  Draw a time line starting at 1700 and finishing at 2050 (use intervals of 50). At each stage explain how you think the UK employment structure has changed. You may want to draw pie charts to represent this. You can also illustrate the time line!  Some key events to help you.  1750-1800 Agricultural revolution  1800-1850 Industrial revolution  1900-1950 London was a very busy important port  1914-1918- WW1  1939 – 1945 WW2  1980 Closure of mines  1990 Closure of Car factories  2000 More money being spent in shops  2000 Growth of banking industry  2005 People have more leisure time than ever before  2010 Apple move to London  2012 London Olympics  Can you think of any other key events?  Extension: How do you think China’s structure has changed over time? Draw 3 pie charts to illustrate your answer!