2
Apache Eagle
Monitor Hadoop in Real Time
Yong Zhang | Senior Architect |
yonzhang2012@gmail.com
Arun Manoharan | Senior Product Manager | @lycos_86
Big Data @ eBay
800M
Listings *
159M
Global Active Buyers *
*Q3 2015 data
7
Hadoop Clusters*
800M
HDFS operations
(single cluster)*
120 PB
Data*
Hadoop @ eBay
HADOOP SECURITY
Authorization &
Access Control
Perimeter
Security
Data
Classification
Activity
Monitoring
Security
MDR
• Perimeter Security
• Authorization &
Access Control
• Discovery
• Activity Monitoring
Security for Hadoop
Who is accessing the data?
What data are they accessing?
Is someone trying to access data that they don’t have access to?
Are there any anomalous access patterns?
Is there a security threat?
How to monitor and get notified during or prior to an anomalous event occurring?
Motivation
Apache Eagle
Apache Eagle: Monitor Hadoop in Real Time
Apache Eagle is an Open Source Monitoring Platform for Hadoop
eco-system, which started with monitoring data activities in
Hadoop. It can instantly identify access to sensitive data, recognize
attacks/malicious activities and blocks access in real time.
In conjunction with components such as Ranger, Sentry,
Knox, DgSecure and Splunk etc., Eagle provides
comprehensive solution to secure sensitive data stored in
Hadoop.
Apache Eagle Composition
Apache Eagle
Integrations Alert Engine
HDFS
AUDIT
HIVE
QUERY
HBASE
AUDIT
CASSANDRA
AUDIT
MapR
AUDIT
2 HADOOP
Performance
Metric
Namenode
JMX
Metrics
Datanode
JMX
Metrics
System
Metrics
3 M/R Job
Performance
Metric
History Job
Metrics
Running
Job Metrics
4 Spark Job
Performance
Metric
Spark Job
Metrics
Queue
Metrics
1 Data Activity
Monitoring
RM
JMX
Metrics
1 Policy Store
2 Metadata API
3 Scalability
4 Extensibility
[Domains] [Applications]
More Integrations
•Cassandra
•MapR
•Mongo DB
•Job
•Queue
Extensibility
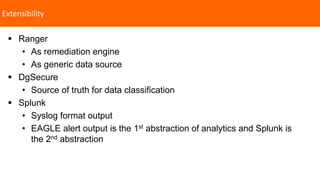
 Ranger
• As remediation engine
• As generic data source
 DgSecure
• Source of truth for data classification
 Splunk
• Syslog format output
• EAGLE alert output is the 1st abstraction of analytics and Splunk is
the 2nd abstraction
Eagle Architecture
Highlights
1. Turn-key integration: after installation, user defines rules
2. Comprehensive rules on high volume of data: Eagle solves some
unique problem in Hadoop
3. Hot deploy rule: Eagle does not provide a lot of charts, instead it
allows user to write ad-hoc rule and hot deploy it.
4. Metadata driven: kept in mind, here metadata includes policy, event
schema and UI component etc.
5. Extensibility: Keep in mind that Eagle can’t succeed alone, Eagle has to
be integrated with other system for example data classification, policy
enforcement etc.
6. Monolithic storm topology: application pre-processing are running
together with alert engine.
Example 1: Integration with HDFS AUDIT log
• Ingestion
 KafkaLog4jAppender+Kafk
a
 Logstash+Kafka
• Partition
 By user
• Pre-processing
 Sensitivity join
 Command re-assembler
Namenode
Kafka
Partition_1
Kafka
Partition_2
Kafka
Partition_N
Storm
Kafka
Spout
User1 User1
Alert
Executor_1
Alert
Executor_2
Alert
Executor_K
User2 User2
User1
User2
Data Classification - HDFS
•Browse HDFS file system
•Batch import sensitivity metadata through Eagle API
•Manually mark sensitivity in Eagle UI
 One user command generates multiple HDFS audit events
 Eagle does reverse engineering to figure out original user command
 Example
COPYFROMLOCAL_PATTERN = “every a = eventStream[cmd==‘getfileinfo’] ” +
“-> b = eventStream[cmd==‘getfileinfo’ and user==a.user and src==str:concat(a.src,‘._COPYING_’)] ” +
“-> c = eventStream[cmd==‘create’ and user==a.user and src==b.src] ” +
“-> d = eventStream[cmd==‘getfileinfo’ and user==a.user and src==b.src] ” +
“-> e = eventStream[cmd==‘delete’ and user==a.user and src==a.src] ” +
“-> f = eventStream[cmd==‘rename’ and user==a.user and src==b.src and dst==a.src]”
2015-11-20 00:06:47,090 INFO FSNamesystem.audit: allowed=true ugi=root (auth:SIMPLE) ip=/10.0.2.15 cmd=getfileinfo src=/tmp/private dst=null perm=null proto=rpc
2015-11-20 00:06:47,185 INFO FSNamesystem.audit: allowed=true ugi=root (auth:SIMPLE) ip=/10.0.2.15 cmd=getfileinfo src=/tmp/private._COPYING_ dst=null perm=null
proto=rpc
2015-11-20 00:06:47,254 INFO FSNamesystem.audit: allowed=true ugi=root (auth:SIMPLE) ip=/10.0.2.15 cmd=create src=/tmp/private._COPYING_ dst=null
perm=root:hdfs:rw-r--r-- proto=rpc
2015-11-20 00:06:47,289 INFO FSNamesystem.audit: allowed=true ugi=root (auth:SIMPLE) ip=/10.0.2.15 cmd=getfileinfo src=/tmp/private._COPYING_ dst=null perm=null
proto=rpc
2015-11-20 00:06:47,609 INFO FSNamesystem.audit: allowed=true ugi=root (auth:SIMPLE) ip=/10.0.2.15 cmd=delete src=/tmp/private dst=null perm=null proto=rpc
2015-11-20 00:06:47,624 INFO FSNamesystem.audit: allowed=true ugi=root (auth:SIMPLE) ip=/10.0.2.15 cmd=rename src=/tmp/private._COPYING_ dst=/tmp/private
perm=root:hdfs:rw-r--r-- proto=rpc
User Command Re-assembly
• Policy evaluation is stateful (one user’s data has to go to one physical bolt)
• Partition by user all the way (hash)
• User is not balanced at all
• Greedy algorithm https://en.wikipedia.org/wiki/Partition_problem#The_greedy_algorithm
Data Skew Problem
 Policy weight is not even
• Regex policy is CPU intensive
• Window based policy is Memory intensive
Computation Skew Problem
Example 2: Integration with Hive
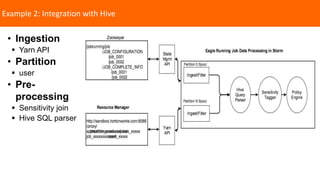
• Ingestion
 Yarn API
• Partition
 user
• Pre-
processing
 Sensitivity join
 Hive SQL parser
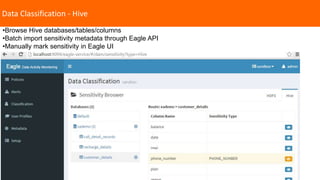
Data Classification - Hive
•Browse Hive databases/tables/columns
•Batch import sensitivity metadata through Eagle API
•Manually mark sensitivity in Eagle UI
Eagle Alert Engine Overview
1 Runs CEP engine on Apache
Storm
• Use CEP engine as library (Siddhi CEP)
• Evaluate policy on streamed data
• Rule is hot deployable
2 Inject policy dynamically
• API
• Intuitive UI
3 Scalability
• Computation
# of policies (policy placement)
• Storage
# of events (event partition)
4 Extensibility for policy
enforcement
• Post-alert processing with plugin
Run CEP Engine on Storm
Storm Bolt
CEP
Worker
CEP
Worker
CEP
Worker
… …
Policy
Check
Thread
Policy
Store
Metadata API
event1
event1
event1
event1
policy1,2,3,4,5,6policy1,2,3
policy1
policy2
policy3
Storm Bolt
event1
policy4,5,6
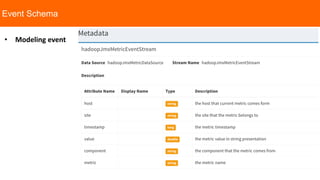
event schema
Primitives – event, policy, alert
Raw Event
2015-10-11 01:00:00,014 INFO FSNamesystem.audit: allowed=true
ugi=user_tom@sandbox.hortonworks.com (auth:KERBEROS) ip=/10.0.0.1 cmd=getfileinfo
src=/tmp/private dst=null perm=null
Alert Event
Timestamp, cmd, src, dst, ugi, sensitivityType, securityZone
Policy
viewPrivate: from hdfsAuditLogEventStream[(cmd=='getfileinfo') and (src=’/tmp/private’)]
Alert
2015-10-11 01:00:09[UTC] hdfsAuditLog viewPrivate user_tom/10.0.0.1 The Policy "viewPrivate" has
been detected with the below information: timestamp="1445993770932" allowed="true"
cmd="getfileinfo" host="/10.0.0.1" sensitivityType="PRIVATE" securityZone="NA" src="/tmp/private"
dst="NA" user=“user_tom”
Event Schema
• Modeling event
1 Single event evaluation
• threshold check with various conditions
Policy Capabilities
2 Event window based evaluation
• various window semantics (time/length sliding/batch window)
• comprehensive aggregation support
3 Correlation for multiple event
streams
• SQL-like join
4 Pattern Match and
Sequence
• a happens followed by b
Powered by Siddhi 3.0.5, but Eagle provides dynamic capabilities
and intuitive API/UI
1 Namenode master/slave lag
from every a =
hadoopJmxMetricEventStream[metric=="hadoop.namenode.journaltransaction.lastappliedorwrittent
xid"] -> b = hadoopJmxMetricEventStream[metric==a.metric and b.host != a.host and
(max(convert(a.value, "long")) + 100) <= max(convert(value, "long"))] within 5 min select a.host as
hostA, a.value as transactIdA, b.host as hostB, b.value as transactIdB insert into tmp;
Some policy examples
3 Namenode HA state change
from every a = hadoopJmxMetricEventStream[metric=="hadoop.namenode.hastate.active.count"] ->
b = hadoopJmxMetricEventStream[metric==a.metric and b.host == a.host and (convert(a.value,
"long") != convert(value, "long"))] within 10 min select a.host, a.value as oldHaState, b.value as
newHaState, b.timestamp as timestamp, b.metric as metric, b.component as component, b.site as
site insert into tmp;
2 Namenode last checkpoint time
• from hadoopJmxMetricEventStream[metric == "hadoop.namenode.dfs.lastcheckpointtime" and
(convert(value, "long") + 18000000) < timestamp] select metric, host, value, timestamp,
component, site insert into tmp;
Define policy in UI and API
curl -u ${EAGLE_SERVICE_USER}:${EAGLE_SERVICE_PASSWD} -X POST -H 'Content-
Type:application/json' 
"http://${EAGLE_SERVICE_HOST}:${EAGLE_SERVICE_PORT}/eagle-
service/rest/entities?serviceName=AlertDefinitionService" 
-d '
[
{
"prefix": "alertdef",
"tags": {
"site": "sandbox",
"application": "hadoopJmxMetricDataSource",
"policyId": "capacityUsedPolicy",
"alertExecutorId": "hadoopJmxMetricAlertExecutor",
"policyType": "siddhiCEPEngine"
},
"description": "jmx metric ",
"policyDef": "{"expression":"from hadoopJmxMetricEventStream[metric ==
"hadoop.namenode.fsnamesystemstate.capacityused" and convert(value,
"long") > 0] select metric, host, value, timestamp, component, site insert into
tmp; ","type":"siddhiCEPEngine"}",
"enabled": true,
"dedupeDef": "{"alertDedupIntervalMin":10,"emailDedupIntervalMin":10}",
"notificationDef":
"[{"sender":"eagle@apache.org","recipients":"eagle@apache.org","subject
":"missing block
found.","flavor":"email","id":"email_1","tplFileName":""}]"
}
]
'
1 Create policy using API 2 Create policy using UI
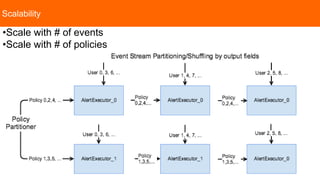
Scalability
•Scale with # of events
•Scale with # of policies
Statistics
• # of events evaluated per
second
• audit for policy change
Eagle Service
As of 0.3.0, Eagle stores metadata and statistics into HBASE, and
support Druid as metric store.
Metadata
• Policy
• Event schema
• Site/Application/UI Features
HBASE
• Store metrics
• Store M/R job/task data
• Rowkey design for time-series data
• HBase Coprocessor
Raw data
• Druid for metric
• HBASE for M/R job/task
etc.
• ES for log (future)
1 Data to be stored 2 Storage 3 API/UI
Druid
• Consume data from Kafka
HBASE
• filter, groupby, sort, top
Druid
• Druid query API
• Dashboard in Eagle
Alert Engine Limitations in Eagle 0.3
1 High cost for integrating
• Coding for onboarding new data source
• Monolithic topology for pre-processing and alert
3 Policy capability restricted by event
partition
• Can’t do ad-hoc group-by policy expression
For example from groupby user to groupby cmd
2 Not multi-tenant
• Alert engine is embedded into application
• Many separate Storm topologies
4 Correlation is not declarative
• Coding for correlating existing data sources
If traffic is partitioned by user, policy only
supports expression of user based group-by
One storm topology even for one trivial data
source
Even if it is a simple data source, you have
to write storm topology and then deploy
Can’t declare correlations for multiple
metrics
5 Stateful policy evaluation
• fail over when bolt is down
How to replay one week history data when
node is down
Eagle Next Releases
• Improve User experience
 Remote start storm topology
 Metadata stored in RDBMS
Eagle 0.4 Eagle 0.5
• Alert Engine as Platform
 No monolithic topology
 Declarative data source onboard
 Easy correlation
 Support policies with any field group-by
 Elastic capacity management
USER PROFILE ALGORITHMS…
Eigen Value Decomposition
• Compute mean and variance
• Compute Eigen Vectors and determine Principal Components
• Normal data points lie near first few principal components
• Abnormal data points lie further from first few principal components and
closer to later components
USER PROFILE ARCHITECTURE
dev@eagle.incubator.apache.org
http://eagle.incubator.apache.org
https://github.com/apache/incubator-eagleGithub
Dev Mail
List
@TheApacheEagleTwitter
Q & A

ebay

  • 2.
    2 Apache Eagle Monitor Hadoopin Real Time Yong Zhang | Senior Architect | yonzhang2012@gmail.com Arun Manoharan | Senior Product Manager | @lycos_86
  • 3.
    Big Data @eBay 800M Listings * 159M Global Active Buyers * *Q3 2015 data 7 Hadoop Clusters* 800M HDFS operations (single cluster)* 120 PB Data* Hadoop @ eBay
  • 4.
    HADOOP SECURITY Authorization & AccessControl Perimeter Security Data Classification Activity Monitoring Security MDR • Perimeter Security • Authorization & Access Control • Discovery • Activity Monitoring Security for Hadoop
  • 5.
    Who is accessingthe data? What data are they accessing? Is someone trying to access data that they don’t have access to? Are there any anomalous access patterns? Is there a security threat? How to monitor and get notified during or prior to an anomalous event occurring? Motivation
  • 6.
    Apache Eagle Apache Eagle:Monitor Hadoop in Real Time Apache Eagle is an Open Source Monitoring Platform for Hadoop eco-system, which started with monitoring data activities in Hadoop. It can instantly identify access to sensitive data, recognize attacks/malicious activities and blocks access in real time. In conjunction with components such as Ranger, Sentry, Knox, DgSecure and Splunk etc., Eagle provides comprehensive solution to secure sensitive data stored in Hadoop.
  • 7.
    Apache Eagle Composition ApacheEagle Integrations Alert Engine HDFS AUDIT HIVE QUERY HBASE AUDIT CASSANDRA AUDIT MapR AUDIT 2 HADOOP Performance Metric Namenode JMX Metrics Datanode JMX Metrics System Metrics 3 M/R Job Performance Metric History Job Metrics Running Job Metrics 4 Spark Job Performance Metric Spark Job Metrics Queue Metrics 1 Data Activity Monitoring RM JMX Metrics 1 Policy Store 2 Metadata API 3 Scalability 4 Extensibility [Domains] [Applications]
  • 8.
  • 9.
    Extensibility  Ranger • Asremediation engine • As generic data source  DgSecure • Source of truth for data classification  Splunk • Syslog format output • EAGLE alert output is the 1st abstraction of analytics and Splunk is the 2nd abstraction
  • 10.
  • 11.
    Highlights 1. Turn-key integration:after installation, user defines rules 2. Comprehensive rules on high volume of data: Eagle solves some unique problem in Hadoop 3. Hot deploy rule: Eagle does not provide a lot of charts, instead it allows user to write ad-hoc rule and hot deploy it. 4. Metadata driven: kept in mind, here metadata includes policy, event schema and UI component etc. 5. Extensibility: Keep in mind that Eagle can’t succeed alone, Eagle has to be integrated with other system for example data classification, policy enforcement etc. 6. Monolithic storm topology: application pre-processing are running together with alert engine.
  • 12.
    Example 1: Integrationwith HDFS AUDIT log • Ingestion  KafkaLog4jAppender+Kafk a  Logstash+Kafka • Partition  By user • Pre-processing  Sensitivity join  Command re-assembler Namenode Kafka Partition_1 Kafka Partition_2 Kafka Partition_N Storm Kafka Spout User1 User1 Alert Executor_1 Alert Executor_2 Alert Executor_K User2 User2 User1 User2
  • 13.
    Data Classification -HDFS •Browse HDFS file system •Batch import sensitivity metadata through Eagle API •Manually mark sensitivity in Eagle UI
  • 14.
     One usercommand generates multiple HDFS audit events  Eagle does reverse engineering to figure out original user command  Example COPYFROMLOCAL_PATTERN = “every a = eventStream[cmd==‘getfileinfo’] ” + “-> b = eventStream[cmd==‘getfileinfo’ and user==a.user and src==str:concat(a.src,‘._COPYING_’)] ” + “-> c = eventStream[cmd==‘create’ and user==a.user and src==b.src] ” + “-> d = eventStream[cmd==‘getfileinfo’ and user==a.user and src==b.src] ” + “-> e = eventStream[cmd==‘delete’ and user==a.user and src==a.src] ” + “-> f = eventStream[cmd==‘rename’ and user==a.user and src==b.src and dst==a.src]” 2015-11-20 00:06:47,090 INFO FSNamesystem.audit: allowed=true ugi=root (auth:SIMPLE) ip=/10.0.2.15 cmd=getfileinfo src=/tmp/private dst=null perm=null proto=rpc 2015-11-20 00:06:47,185 INFO FSNamesystem.audit: allowed=true ugi=root (auth:SIMPLE) ip=/10.0.2.15 cmd=getfileinfo src=/tmp/private._COPYING_ dst=null perm=null proto=rpc 2015-11-20 00:06:47,254 INFO FSNamesystem.audit: allowed=true ugi=root (auth:SIMPLE) ip=/10.0.2.15 cmd=create src=/tmp/private._COPYING_ dst=null perm=root:hdfs:rw-r--r-- proto=rpc 2015-11-20 00:06:47,289 INFO FSNamesystem.audit: allowed=true ugi=root (auth:SIMPLE) ip=/10.0.2.15 cmd=getfileinfo src=/tmp/private._COPYING_ dst=null perm=null proto=rpc 2015-11-20 00:06:47,609 INFO FSNamesystem.audit: allowed=true ugi=root (auth:SIMPLE) ip=/10.0.2.15 cmd=delete src=/tmp/private dst=null perm=null proto=rpc 2015-11-20 00:06:47,624 INFO FSNamesystem.audit: allowed=true ugi=root (auth:SIMPLE) ip=/10.0.2.15 cmd=rename src=/tmp/private._COPYING_ dst=/tmp/private perm=root:hdfs:rw-r--r-- proto=rpc User Command Re-assembly
  • 15.
    • Policy evaluationis stateful (one user’s data has to go to one physical bolt) • Partition by user all the way (hash) • User is not balanced at all • Greedy algorithm https://en.wikipedia.org/wiki/Partition_problem#The_greedy_algorithm Data Skew Problem
  • 16.
     Policy weightis not even • Regex policy is CPU intensive • Window based policy is Memory intensive Computation Skew Problem
  • 17.
    Example 2: Integrationwith Hive • Ingestion  Yarn API • Partition  user • Pre- processing  Sensitivity join  Hive SQL parser
  • 18.
    Data Classification -Hive •Browse Hive databases/tables/columns •Batch import sensitivity metadata through Eagle API •Manually mark sensitivity in Eagle UI
  • 19.
    Eagle Alert EngineOverview 1 Runs CEP engine on Apache Storm • Use CEP engine as library (Siddhi CEP) • Evaluate policy on streamed data • Rule is hot deployable 2 Inject policy dynamically • API • Intuitive UI 3 Scalability • Computation # of policies (policy placement) • Storage # of events (event partition) 4 Extensibility for policy enforcement • Post-alert processing with plugin
  • 20.
    Run CEP Engineon Storm Storm Bolt CEP Worker CEP Worker CEP Worker … … Policy Check Thread Policy Store Metadata API event1 event1 event1 event1 policy1,2,3,4,5,6policy1,2,3 policy1 policy2 policy3 Storm Bolt event1 policy4,5,6 event schema
  • 21.
    Primitives – event,policy, alert Raw Event 2015-10-11 01:00:00,014 INFO FSNamesystem.audit: allowed=true ugi=user_tom@sandbox.hortonworks.com (auth:KERBEROS) ip=/10.0.0.1 cmd=getfileinfo src=/tmp/private dst=null perm=null Alert Event Timestamp, cmd, src, dst, ugi, sensitivityType, securityZone Policy viewPrivate: from hdfsAuditLogEventStream[(cmd=='getfileinfo') and (src=’/tmp/private’)] Alert 2015-10-11 01:00:09[UTC] hdfsAuditLog viewPrivate user_tom/10.0.0.1 The Policy "viewPrivate" has been detected with the below information: timestamp="1445993770932" allowed="true" cmd="getfileinfo" host="/10.0.0.1" sensitivityType="PRIVATE" securityZone="NA" src="/tmp/private" dst="NA" user=“user_tom”
  • 22.
  • 23.
    1 Single eventevaluation • threshold check with various conditions Policy Capabilities 2 Event window based evaluation • various window semantics (time/length sliding/batch window) • comprehensive aggregation support 3 Correlation for multiple event streams • SQL-like join 4 Pattern Match and Sequence • a happens followed by b Powered by Siddhi 3.0.5, but Eagle provides dynamic capabilities and intuitive API/UI
  • 24.
    1 Namenode master/slavelag from every a = hadoopJmxMetricEventStream[metric=="hadoop.namenode.journaltransaction.lastappliedorwrittent xid"] -> b = hadoopJmxMetricEventStream[metric==a.metric and b.host != a.host and (max(convert(a.value, "long")) + 100) <= max(convert(value, "long"))] within 5 min select a.host as hostA, a.value as transactIdA, b.host as hostB, b.value as transactIdB insert into tmp; Some policy examples 3 Namenode HA state change from every a = hadoopJmxMetricEventStream[metric=="hadoop.namenode.hastate.active.count"] -> b = hadoopJmxMetricEventStream[metric==a.metric and b.host == a.host and (convert(a.value, "long") != convert(value, "long"))] within 10 min select a.host, a.value as oldHaState, b.value as newHaState, b.timestamp as timestamp, b.metric as metric, b.component as component, b.site as site insert into tmp; 2 Namenode last checkpoint time • from hadoopJmxMetricEventStream[metric == "hadoop.namenode.dfs.lastcheckpointtime" and (convert(value, "long") + 18000000) < timestamp] select metric, host, value, timestamp, component, site insert into tmp;
  • 25.
    Define policy inUI and API curl -u ${EAGLE_SERVICE_USER}:${EAGLE_SERVICE_PASSWD} -X POST -H 'Content- Type:application/json' "http://${EAGLE_SERVICE_HOST}:${EAGLE_SERVICE_PORT}/eagle- service/rest/entities?serviceName=AlertDefinitionService" -d ' [ { "prefix": "alertdef", "tags": { "site": "sandbox", "application": "hadoopJmxMetricDataSource", "policyId": "capacityUsedPolicy", "alertExecutorId": "hadoopJmxMetricAlertExecutor", "policyType": "siddhiCEPEngine" }, "description": "jmx metric ", "policyDef": "{"expression":"from hadoopJmxMetricEventStream[metric == "hadoop.namenode.fsnamesystemstate.capacityused" and convert(value, "long") > 0] select metric, host, value, timestamp, component, site insert into tmp; ","type":"siddhiCEPEngine"}", "enabled": true, "dedupeDef": "{"alertDedupIntervalMin":10,"emailDedupIntervalMin":10}", "notificationDef": "[{"sender":"eagle@apache.org","recipients":"eagle@apache.org","subject ":"missing block found.","flavor":"email","id":"email_1","tplFileName":""}]" } ] ' 1 Create policy using API 2 Create policy using UI
  • 26.
    Scalability •Scale with #of events •Scale with # of policies
  • 27.
    Statistics • # ofevents evaluated per second • audit for policy change Eagle Service As of 0.3.0, Eagle stores metadata and statistics into HBASE, and support Druid as metric store. Metadata • Policy • Event schema • Site/Application/UI Features HBASE • Store metrics • Store M/R job/task data • Rowkey design for time-series data • HBase Coprocessor Raw data • Druid for metric • HBASE for M/R job/task etc. • ES for log (future) 1 Data to be stored 2 Storage 3 API/UI Druid • Consume data from Kafka HBASE • filter, groupby, sort, top Druid • Druid query API • Dashboard in Eagle
  • 28.
    Alert Engine Limitationsin Eagle 0.3 1 High cost for integrating • Coding for onboarding new data source • Monolithic topology for pre-processing and alert 3 Policy capability restricted by event partition • Can’t do ad-hoc group-by policy expression For example from groupby user to groupby cmd 2 Not multi-tenant • Alert engine is embedded into application • Many separate Storm topologies 4 Correlation is not declarative • Coding for correlating existing data sources If traffic is partitioned by user, policy only supports expression of user based group-by One storm topology even for one trivial data source Even if it is a simple data source, you have to write storm topology and then deploy Can’t declare correlations for multiple metrics 5 Stateful policy evaluation • fail over when bolt is down How to replay one week history data when node is down
  • 29.
    Eagle Next Releases •Improve User experience  Remote start storm topology  Metadata stored in RDBMS Eagle 0.4 Eagle 0.5 • Alert Engine as Platform  No monolithic topology  Declarative data source onboard  Easy correlation  Support policies with any field group-by  Elastic capacity management
  • 30.
    USER PROFILE ALGORITHMS… EigenValue Decomposition • Compute mean and variance • Compute Eigen Vectors and determine Principal Components • Normal data points lie near first few principal components • Abnormal data points lie further from first few principal components and closer to later components
  • 31.
  • 32.

Editor's Notes

  • #3 Eagle was started by end of 2013 for monitoring job performance, bad node in large Hadoop clusters. That was very successful. From early this year, we started to use EAGLE to monitor data activities in Hadoop ecosystem and then open source it under apache because we believe data activity monitoring is a common problem for all the companies which have lots of users and data and we want to collaborate with community to solve the problem.
  • #5 2FA+firewall lockdown MDR?
  • #7 The first case which Apache Eagle developed is security monitoring for Hadoop ecosystem but we will expand Eagle to monitor more than security
  • #8 Apache Eagle includes applications and alert engine. Today application connects to alert engine with JAVA API, in future, Alert Engine is a separate component, application can send data into Alert Engine
  • #14 Setup – one single Eagle instance can manage multiple sites
  • #18 Hive is very popular method by which user accesses Hadoop resources. What Eagle does for Hive security monitoring is to collect Hive query log from map/reduce job and parse the query and to get who accesses what database/table/column
  • #19 Setup – one single Eagle instance can manage multiple sites
  • #21 Anatomy of Eagle alert engine
  • #24 There is some policies day-over-day, week-over-week comparison not supported by CEP
  • #25 There is some policies day-over-day, week-over-week comparison not supported by CEP
  • #26 Setup – one single Eagle instance can manage multiple sites