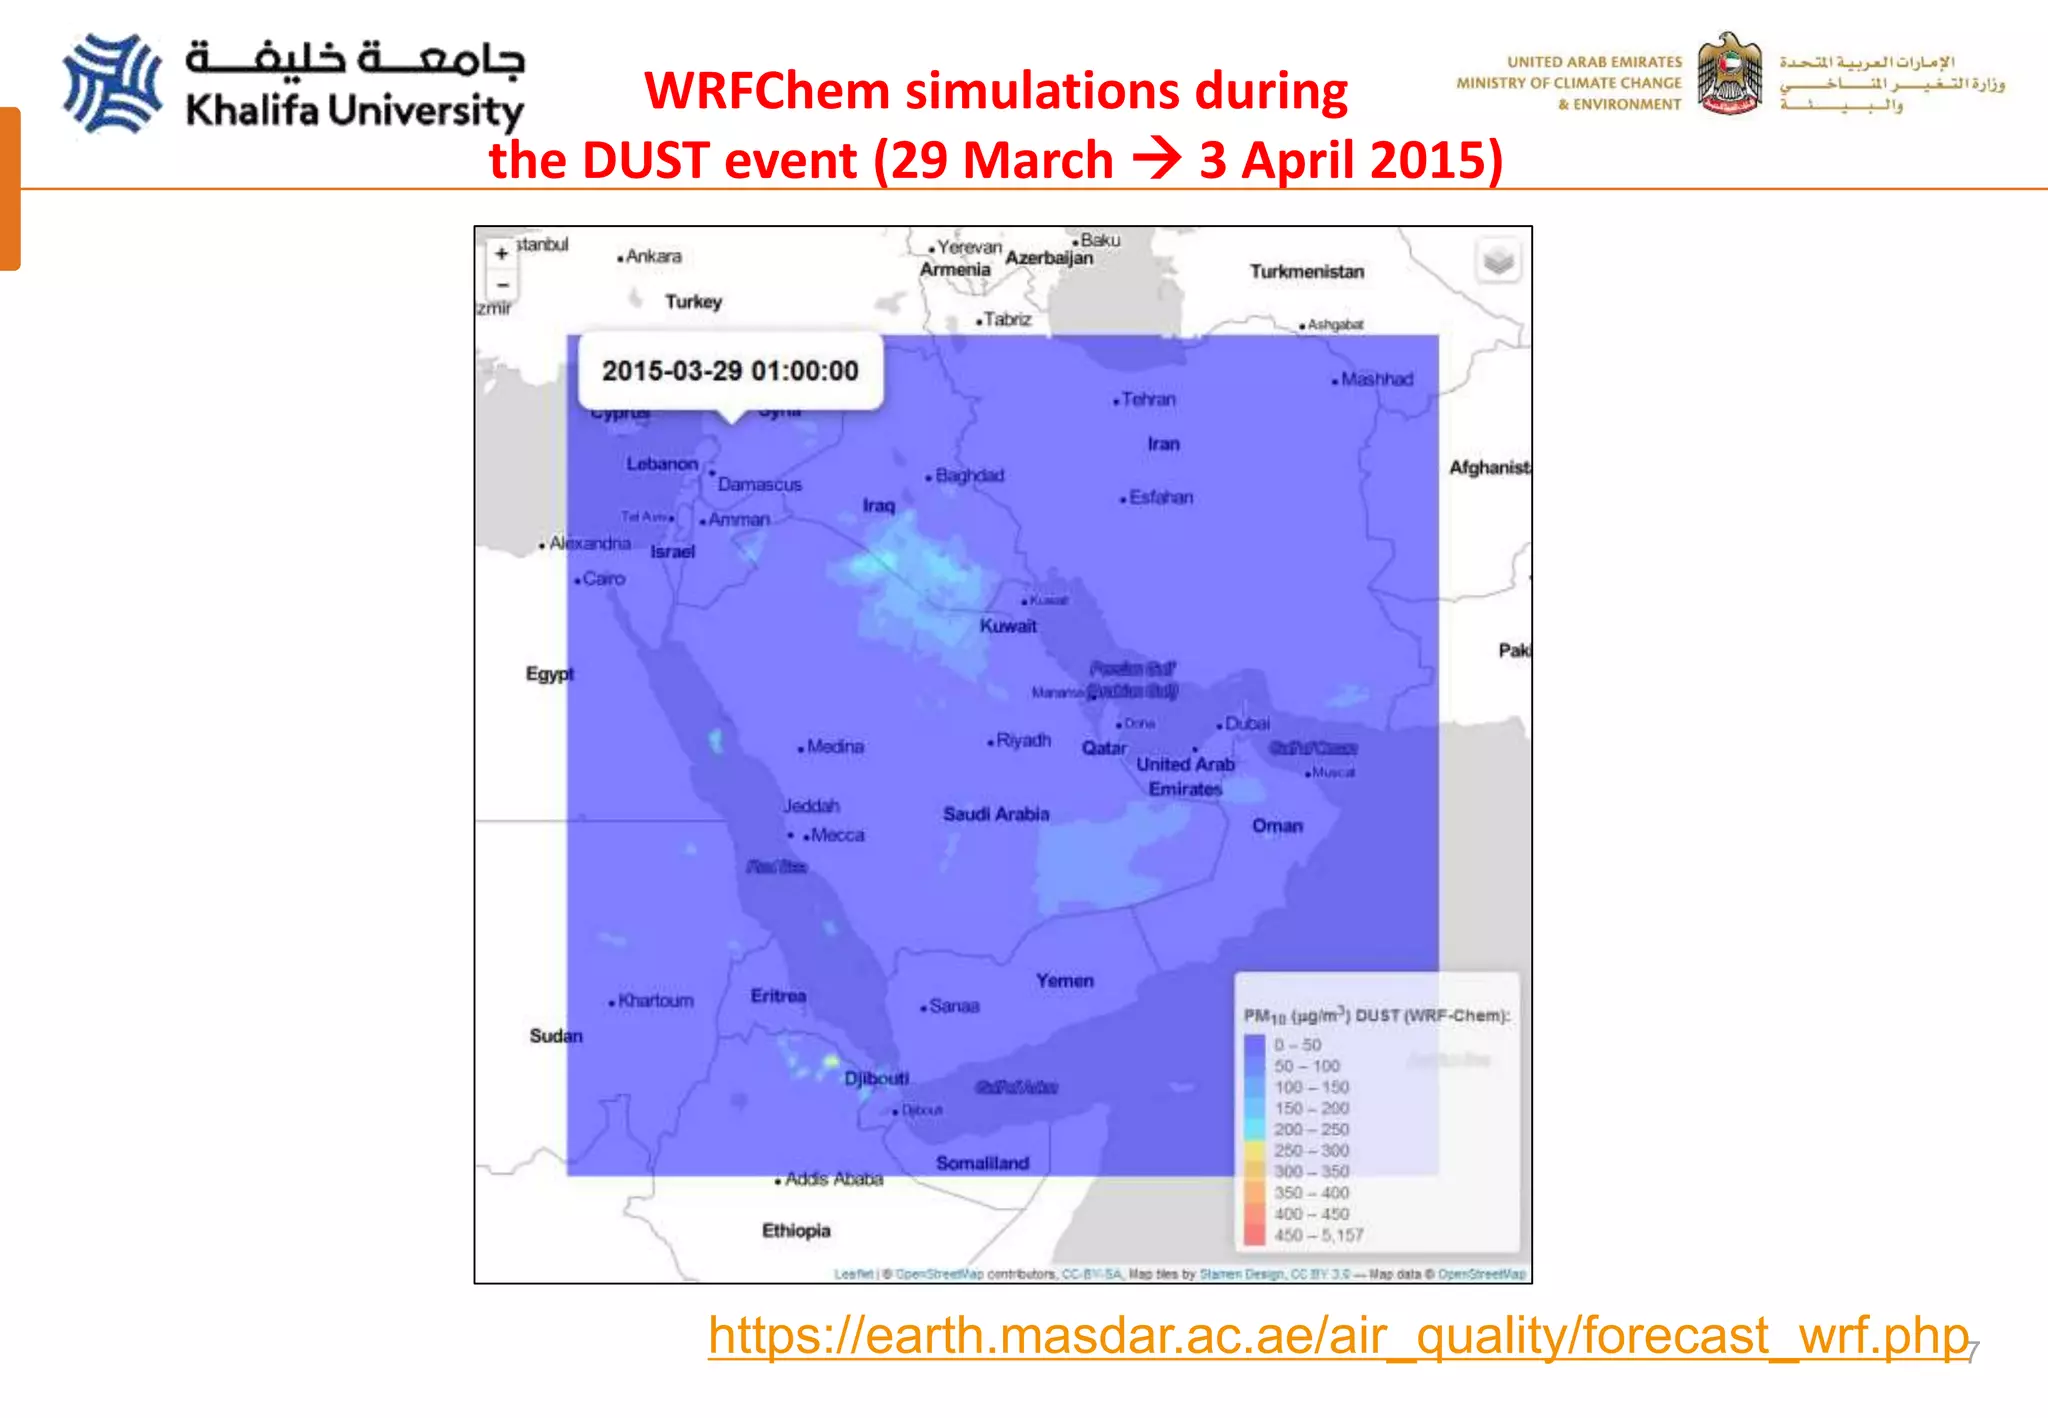
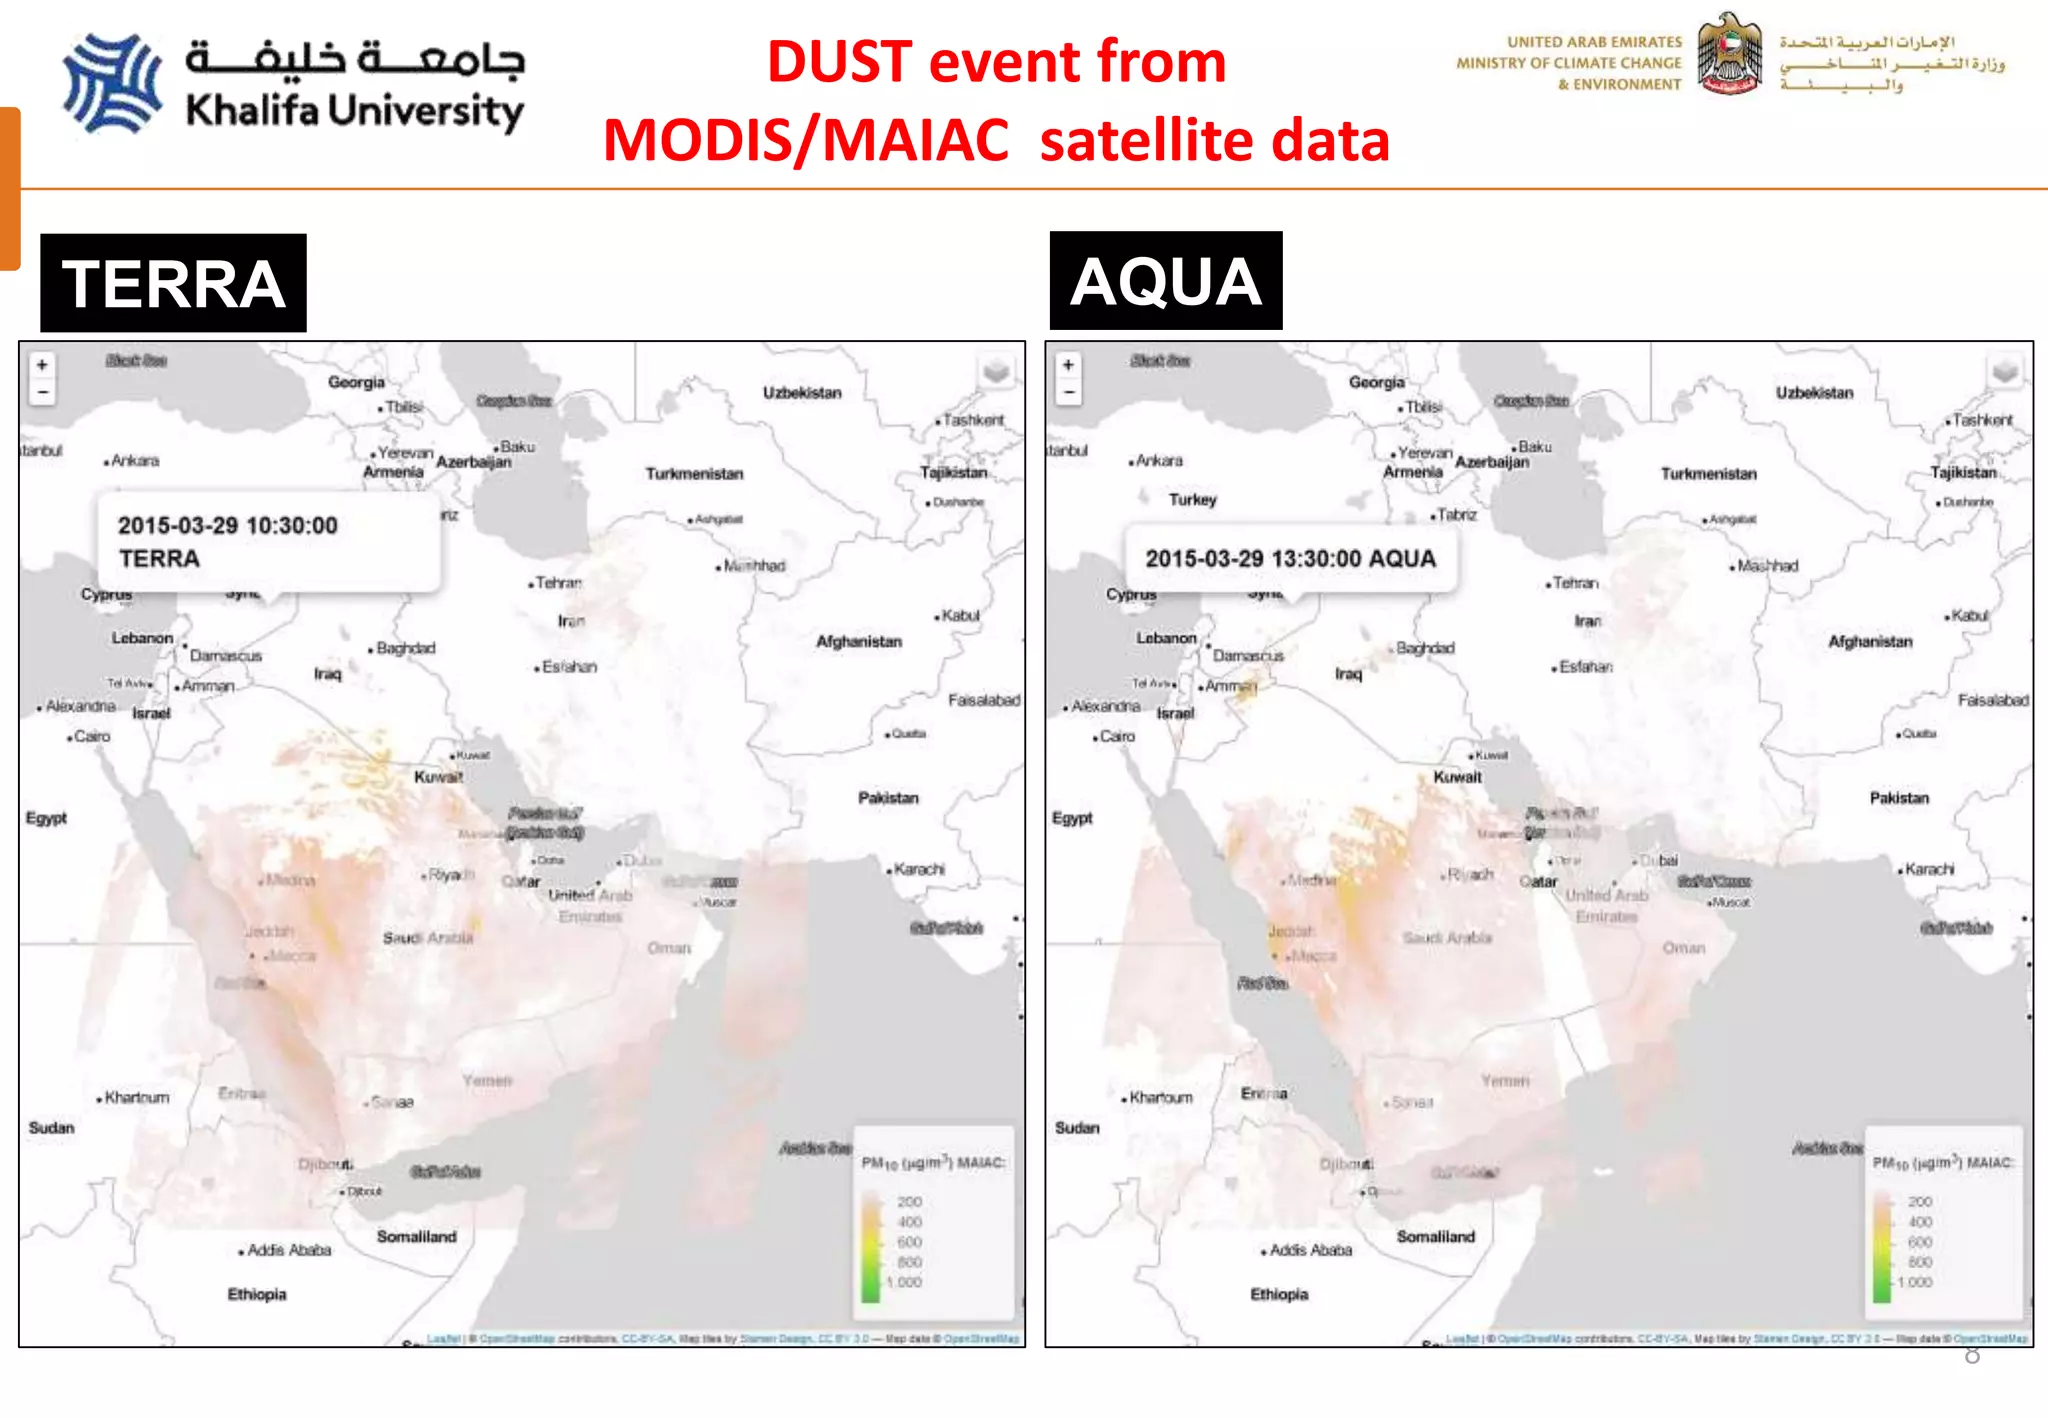
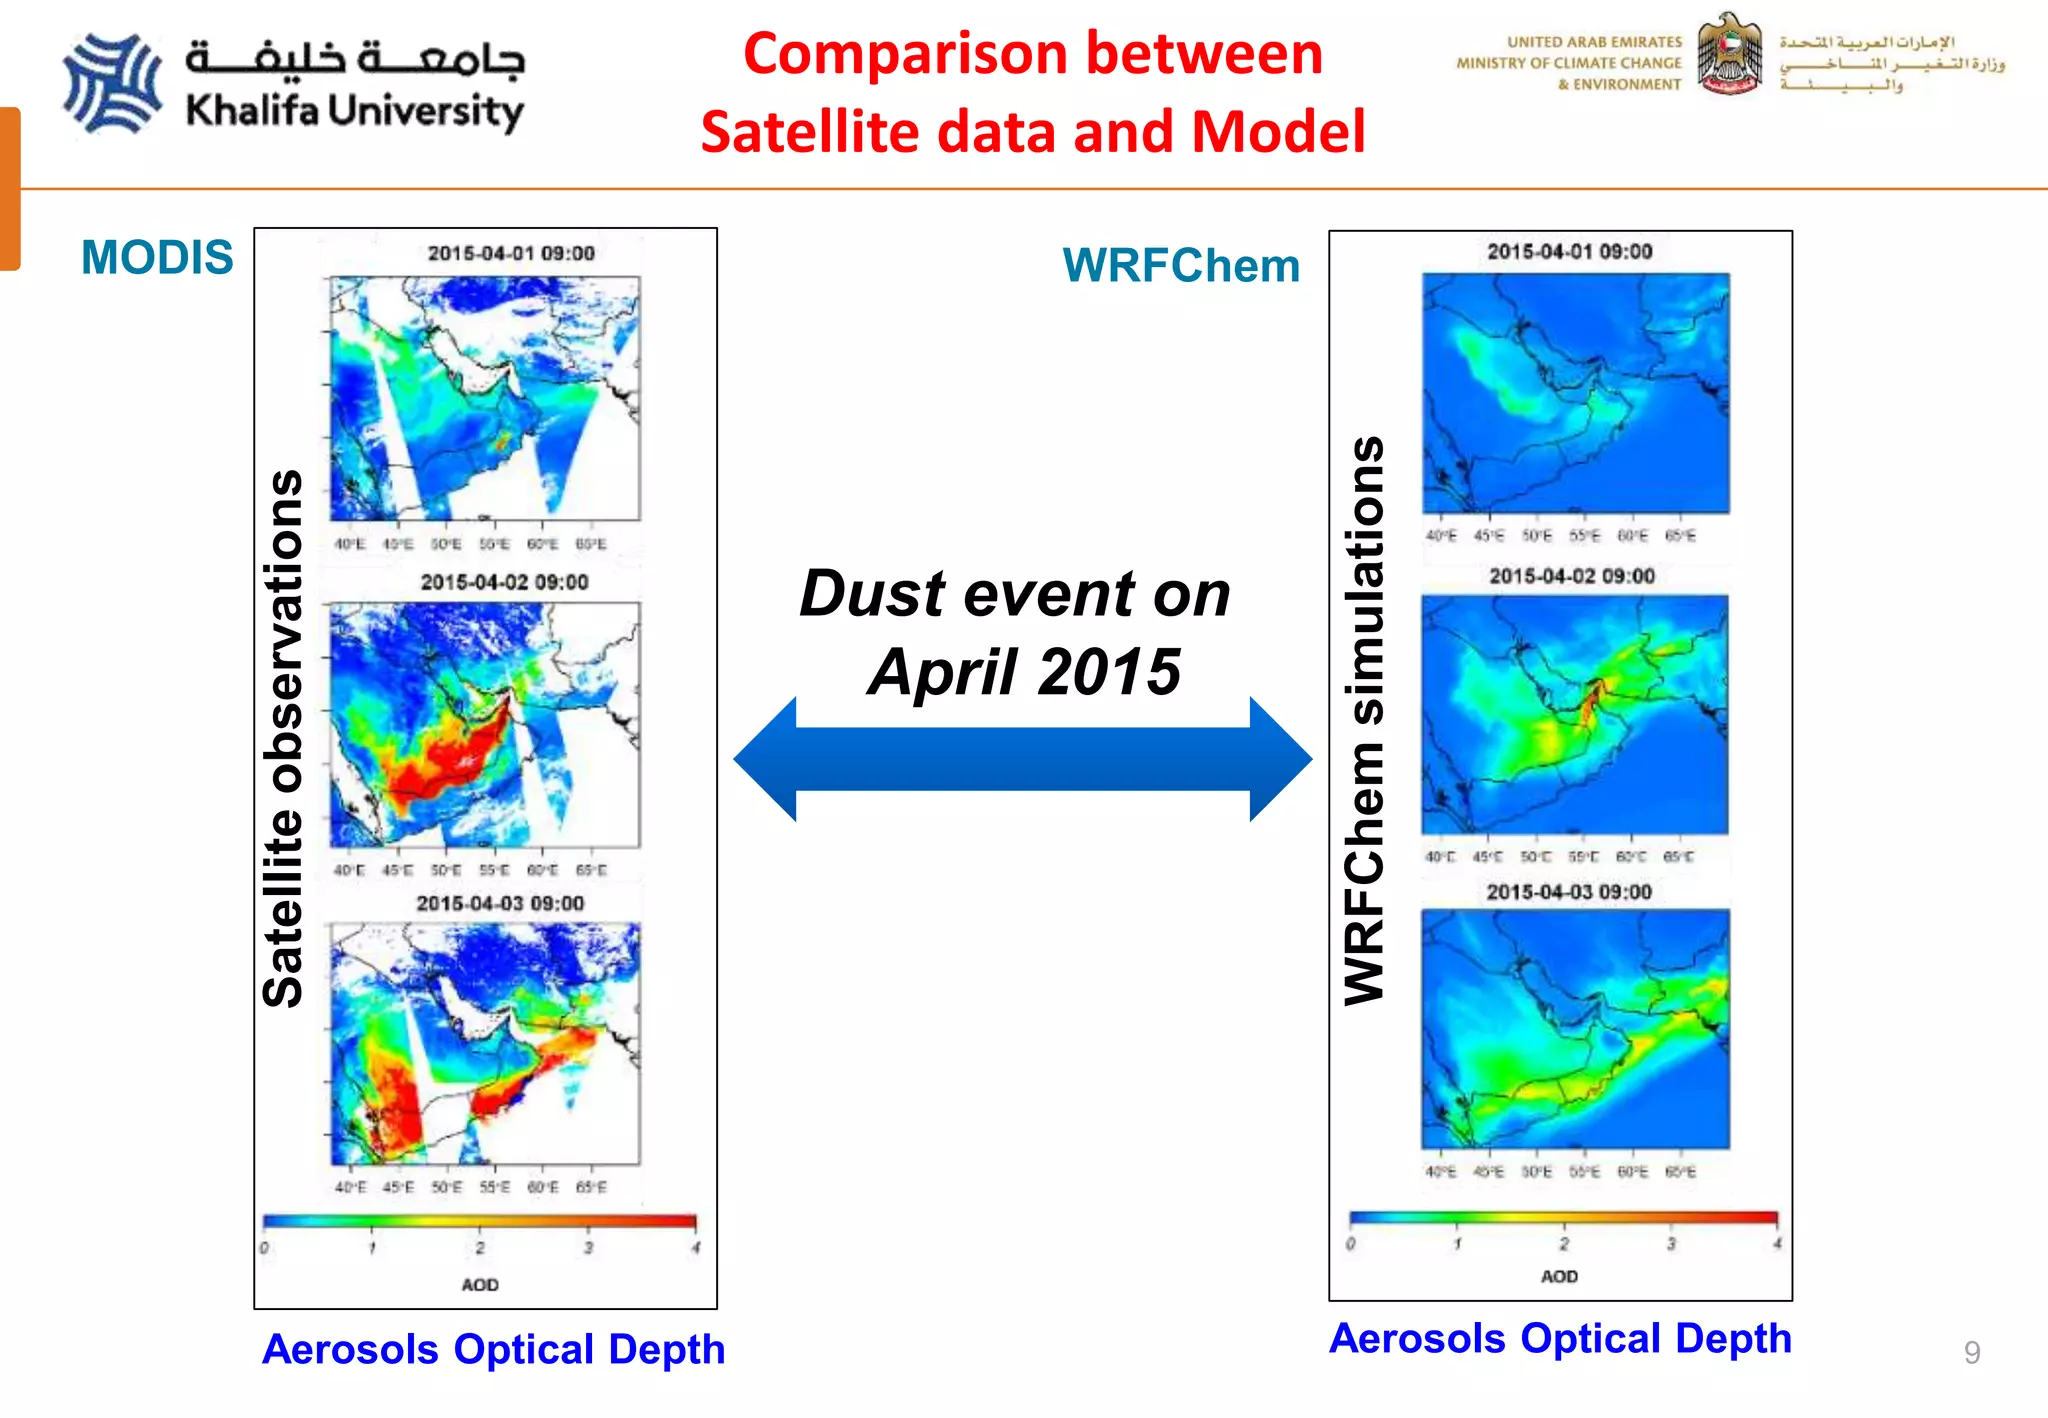
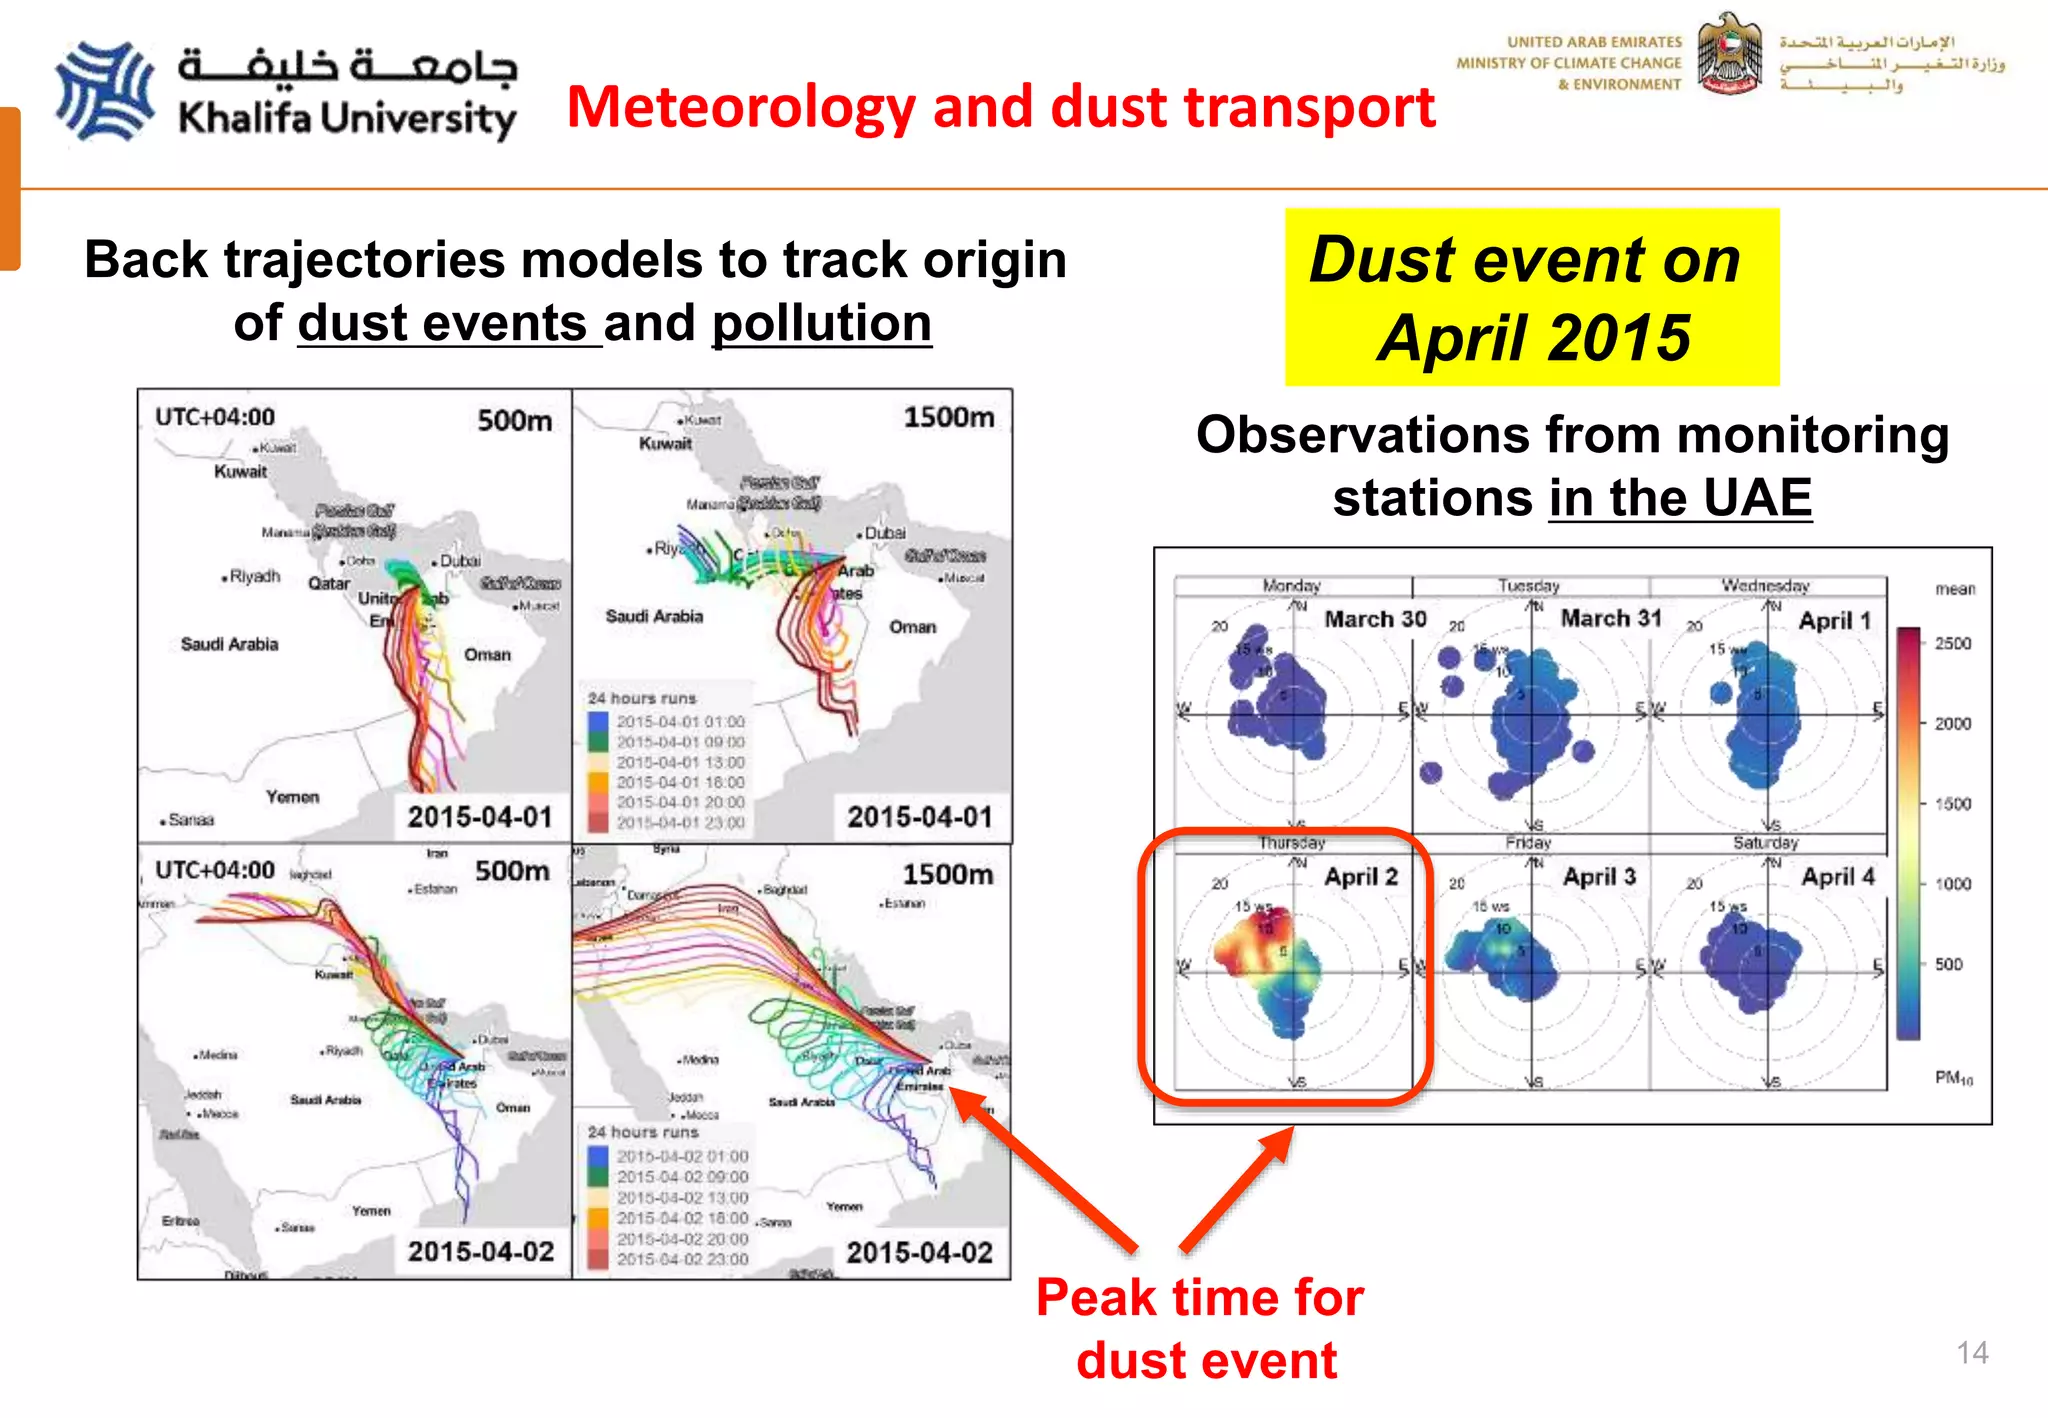
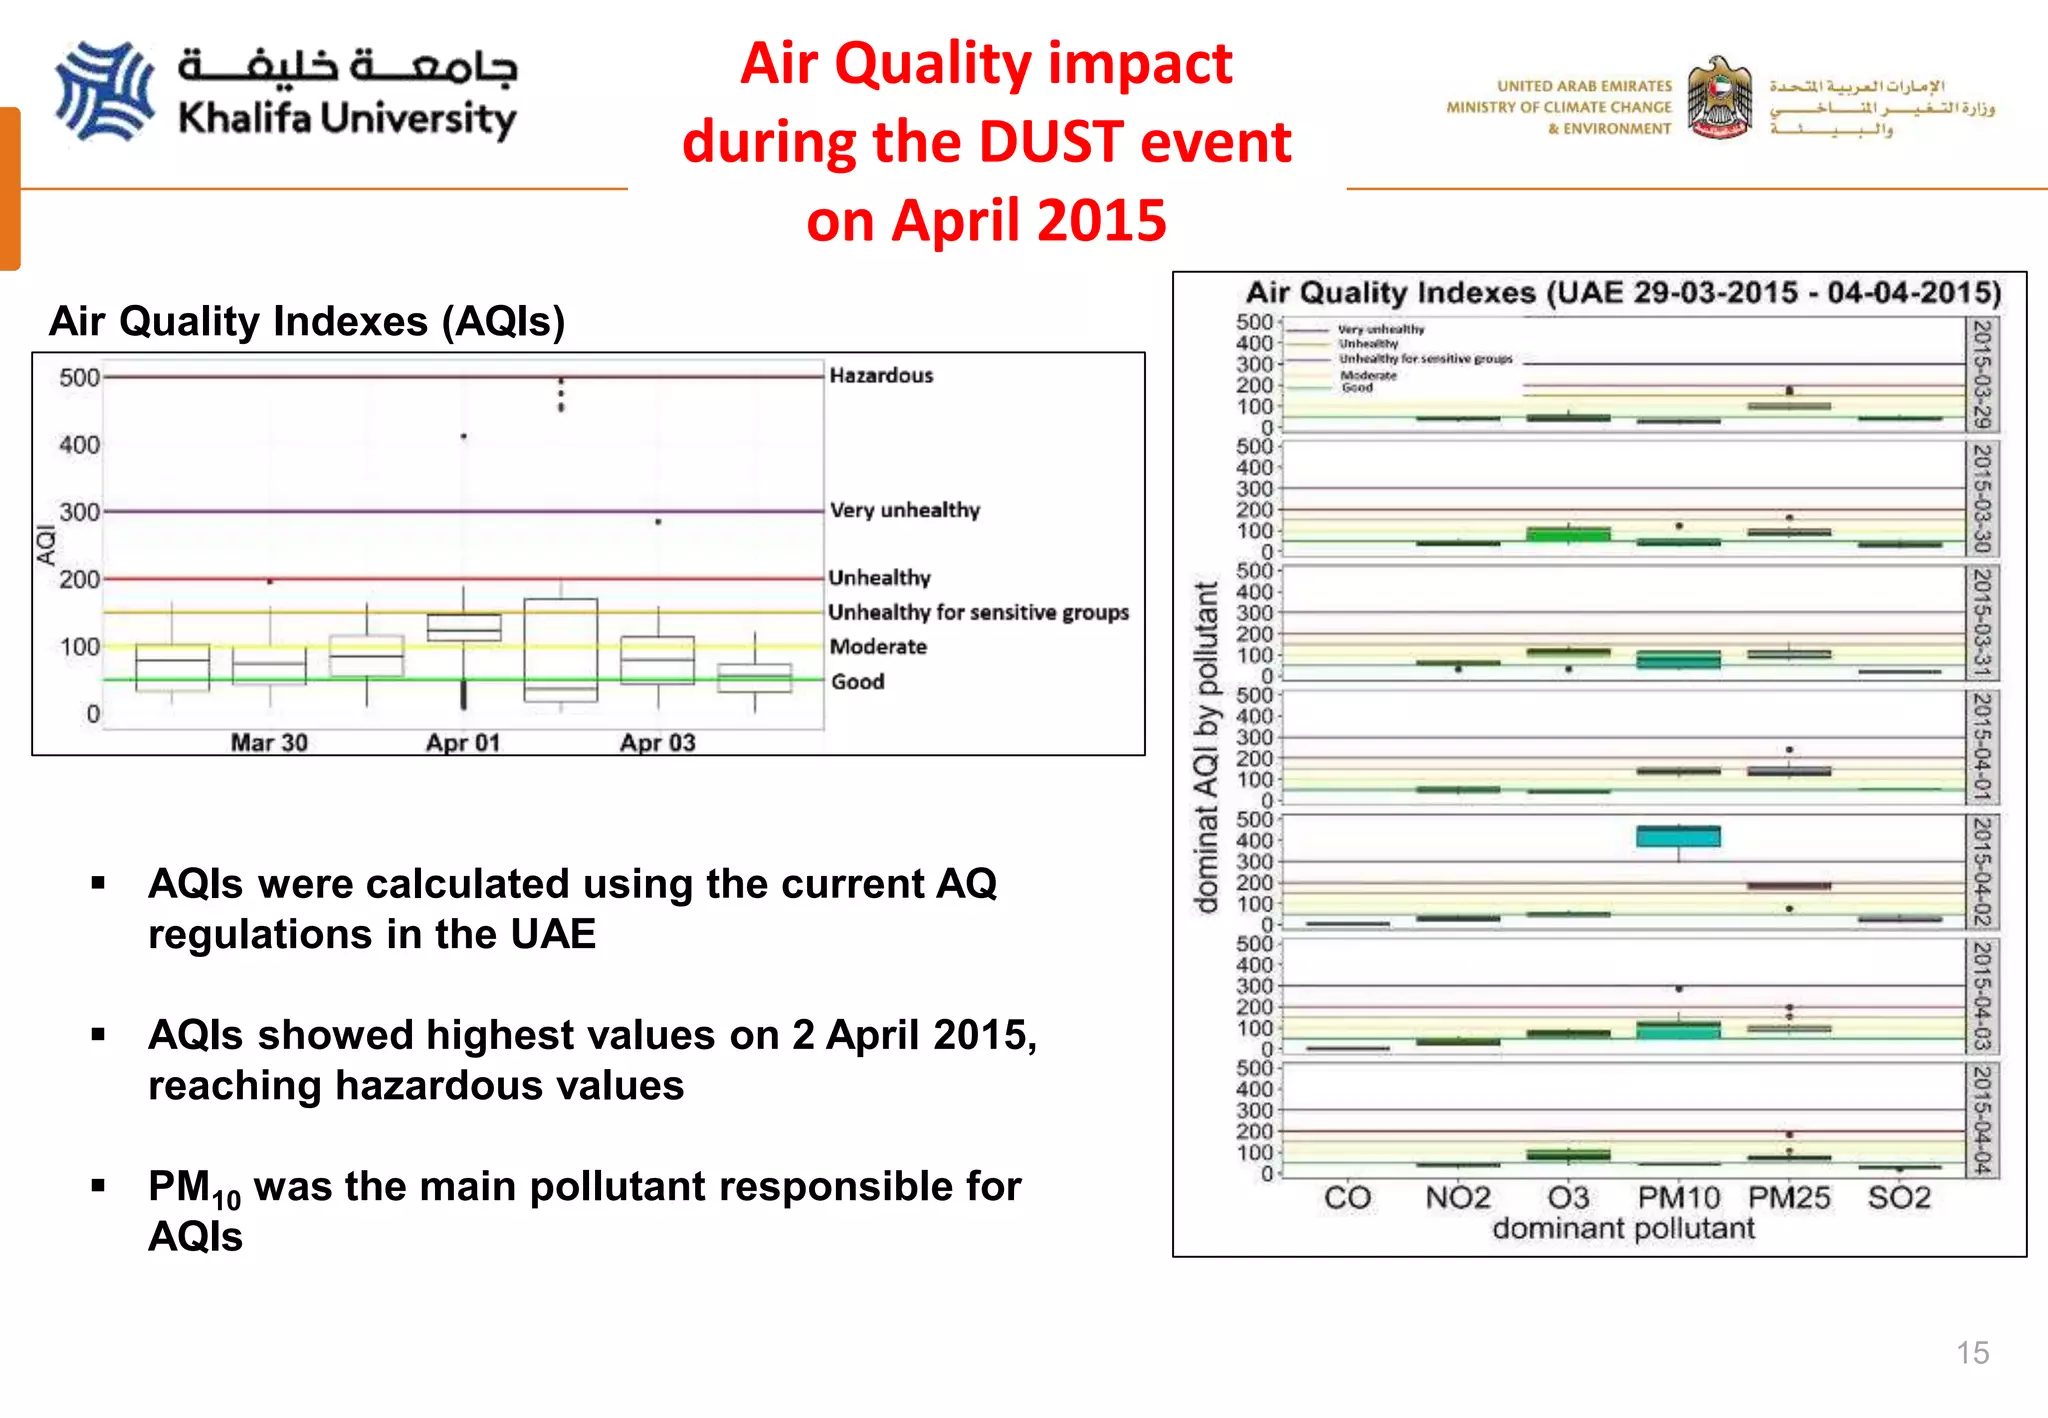
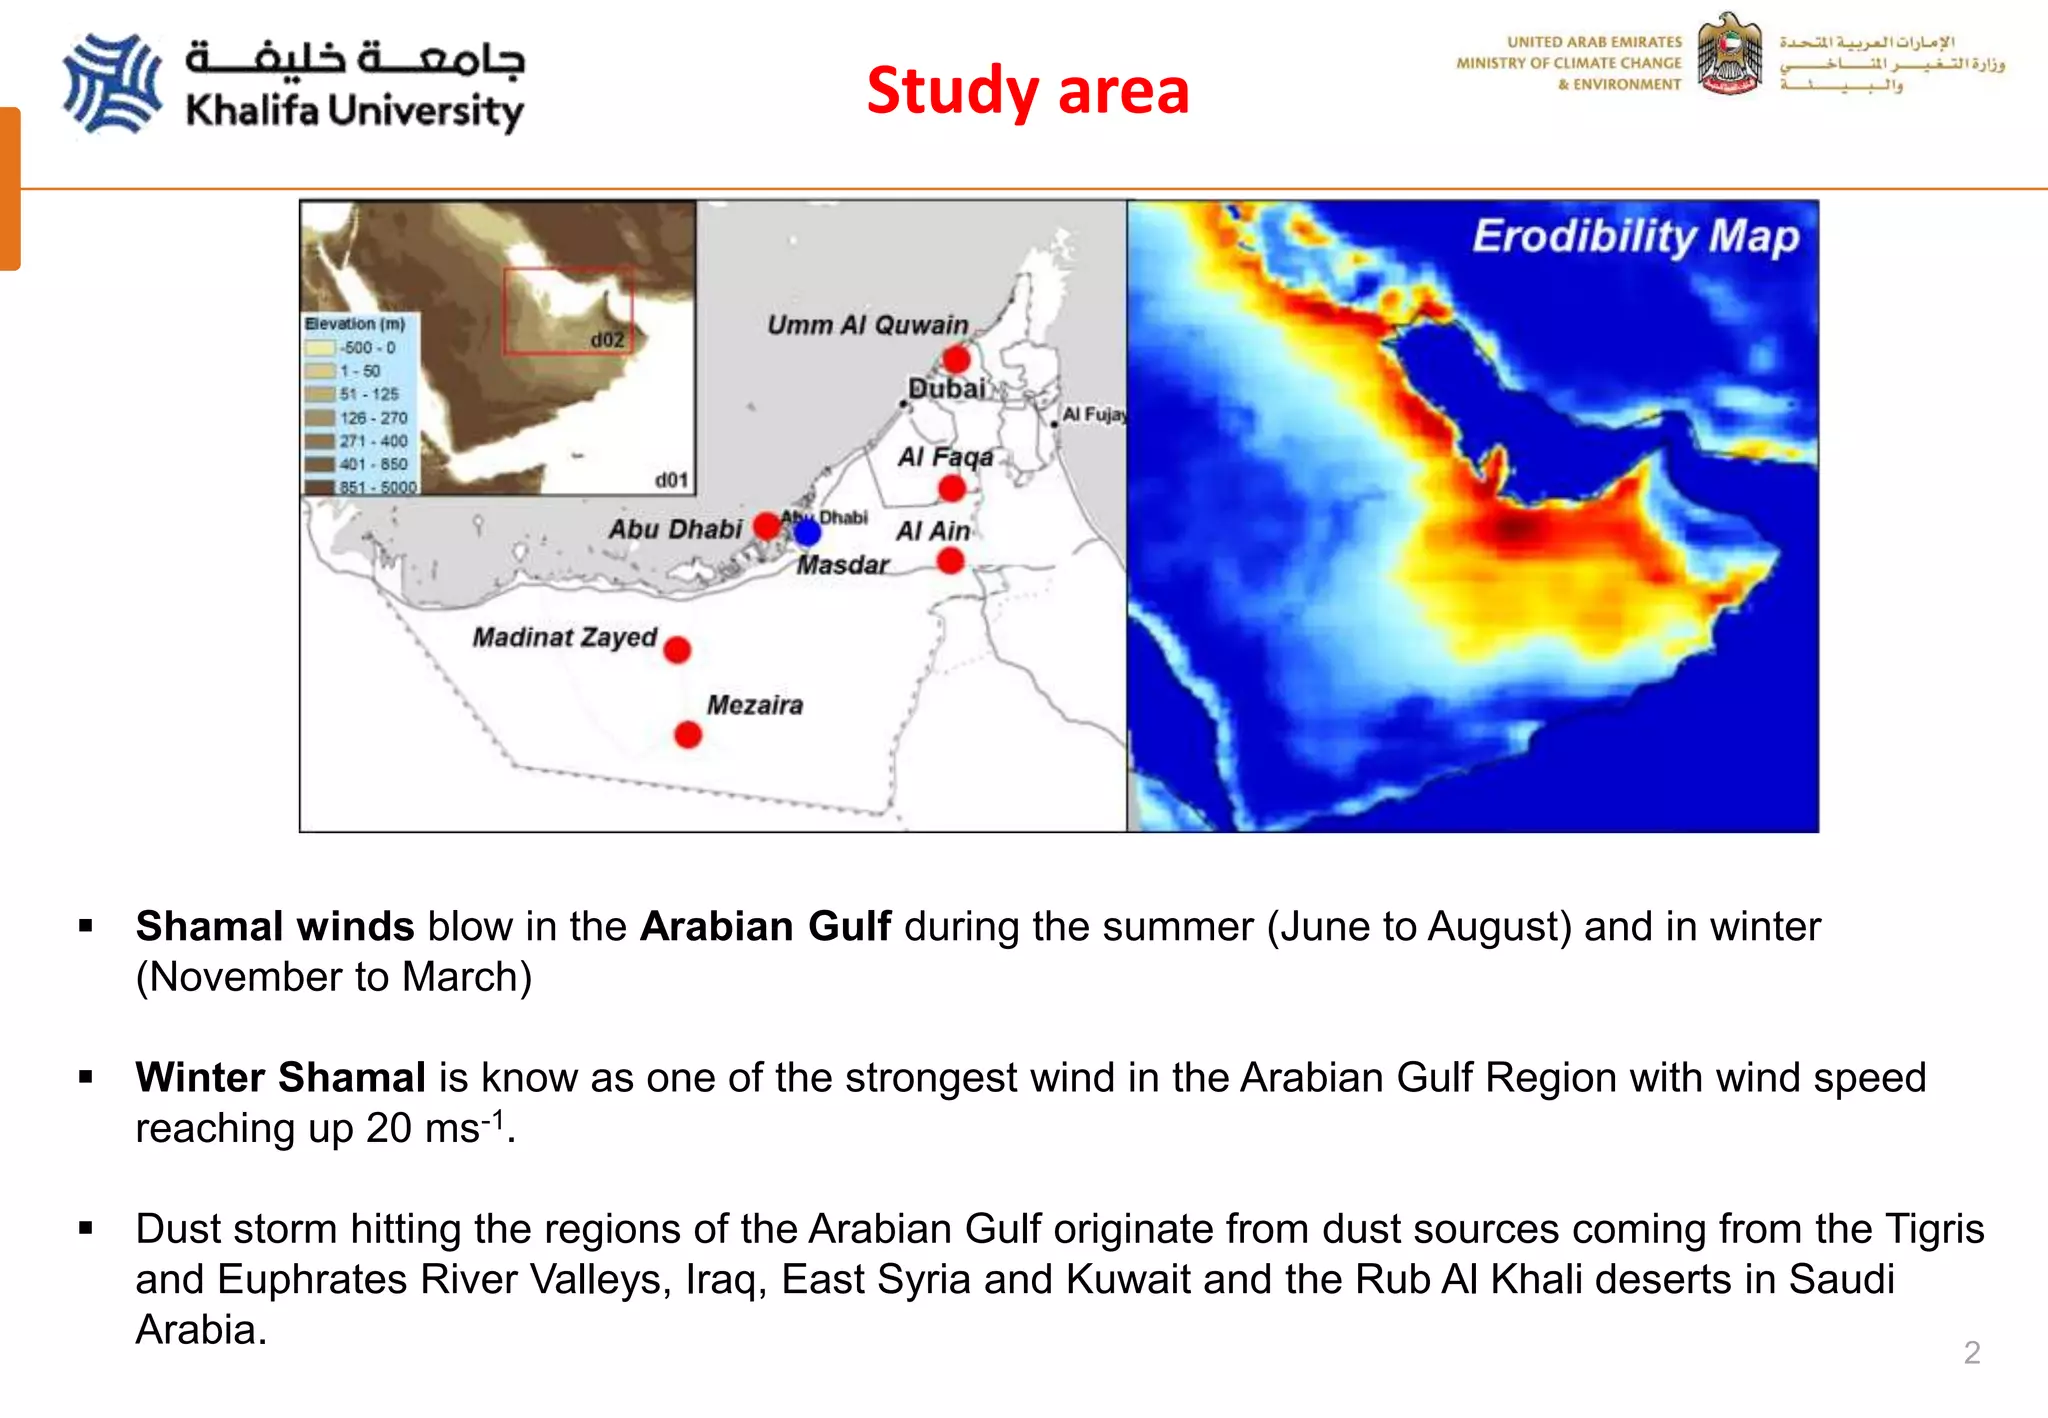
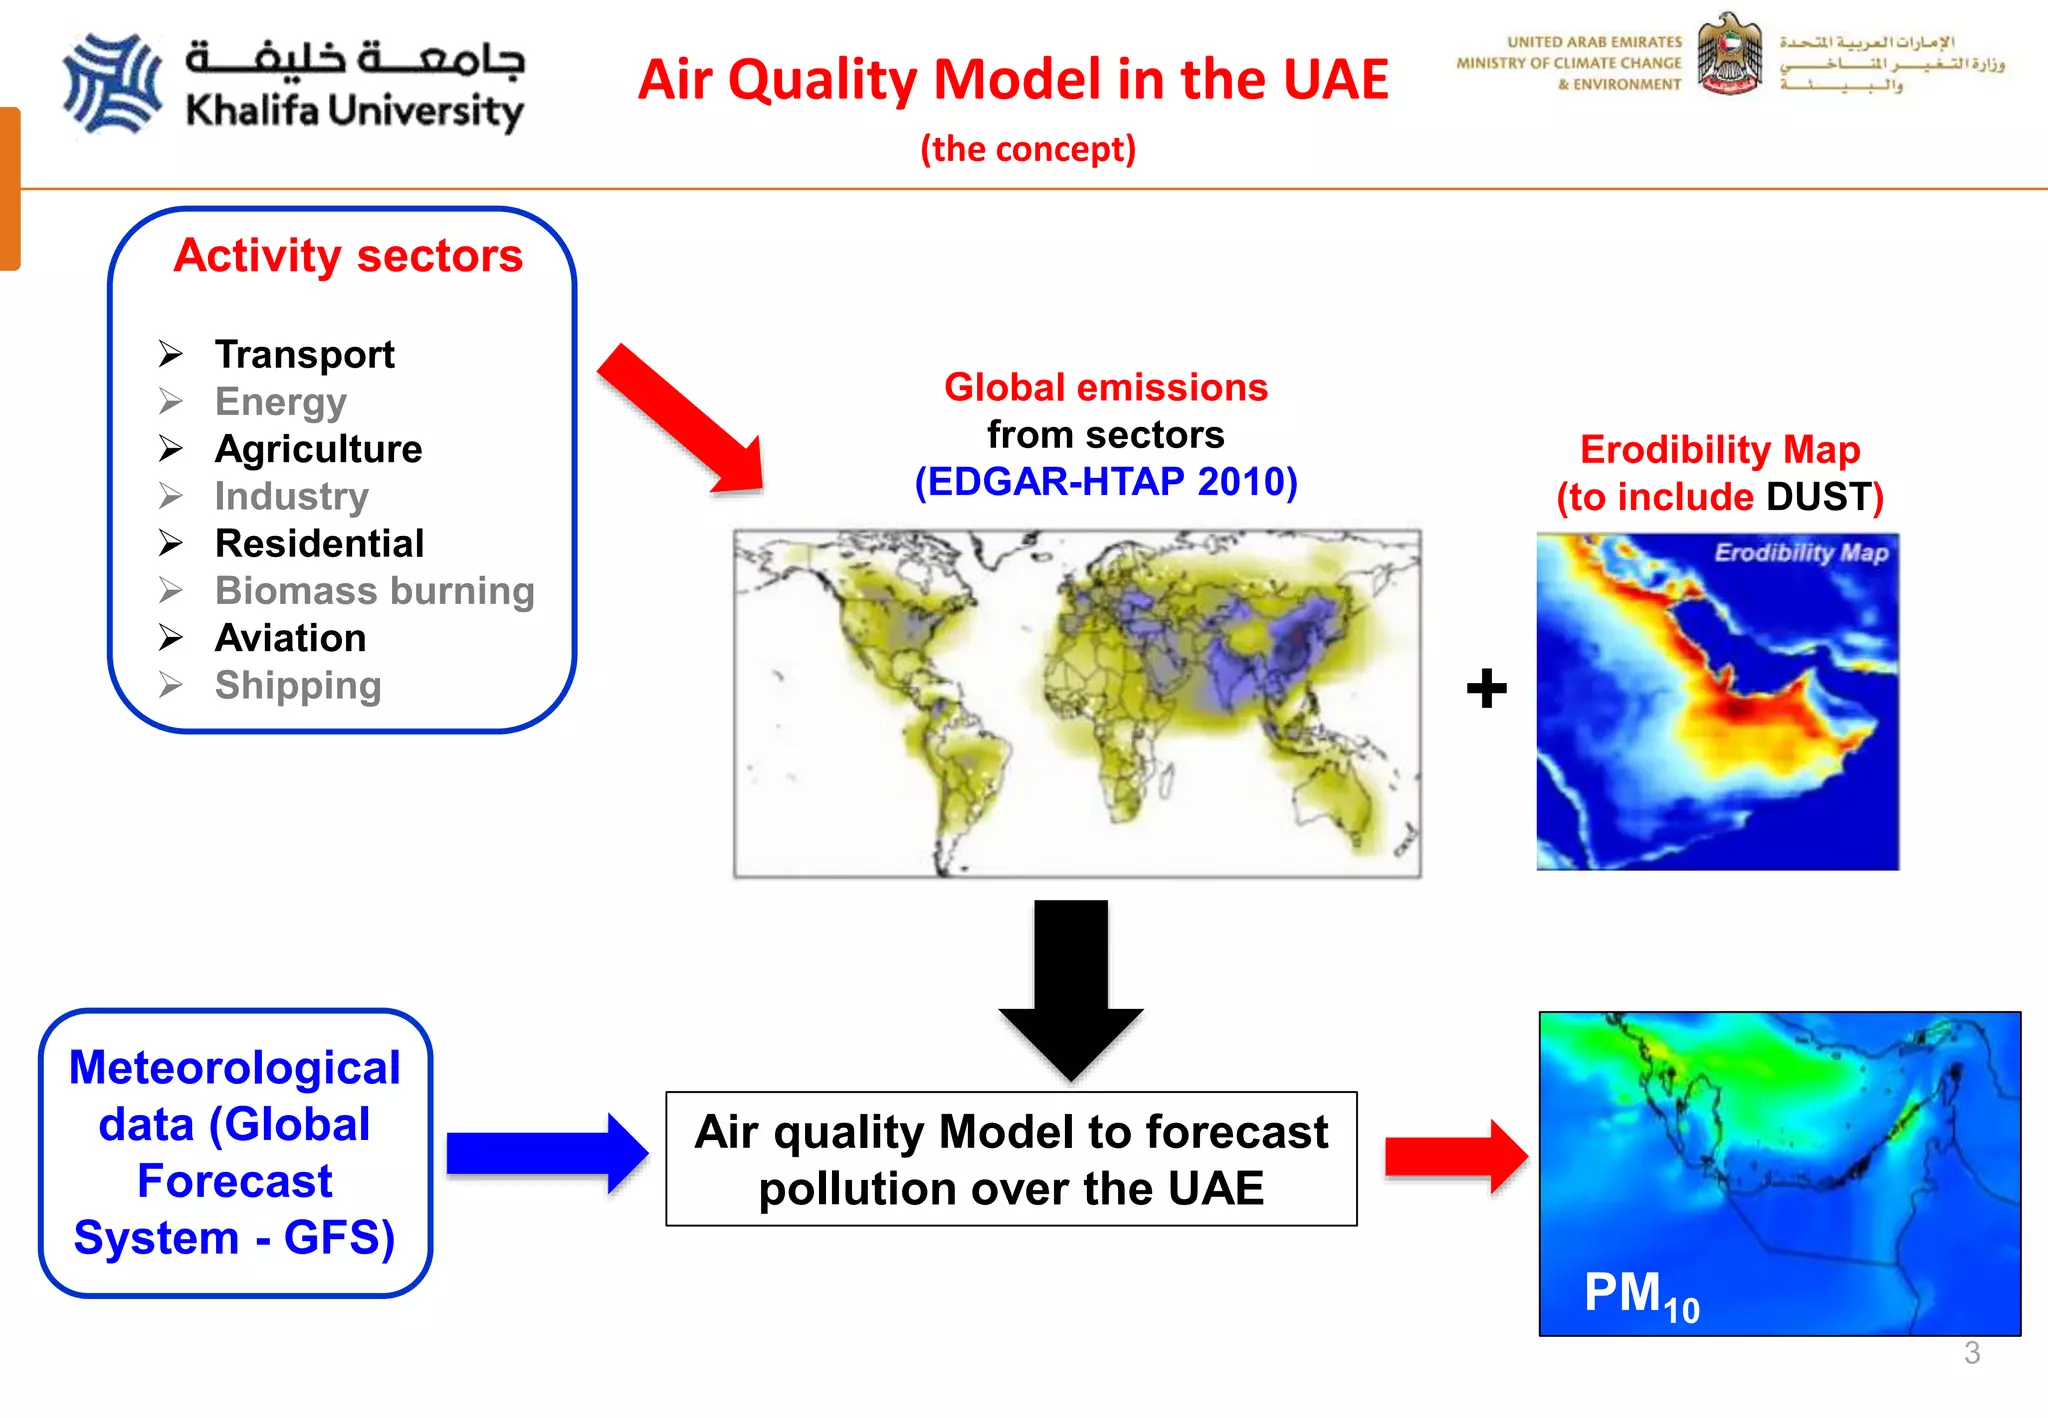
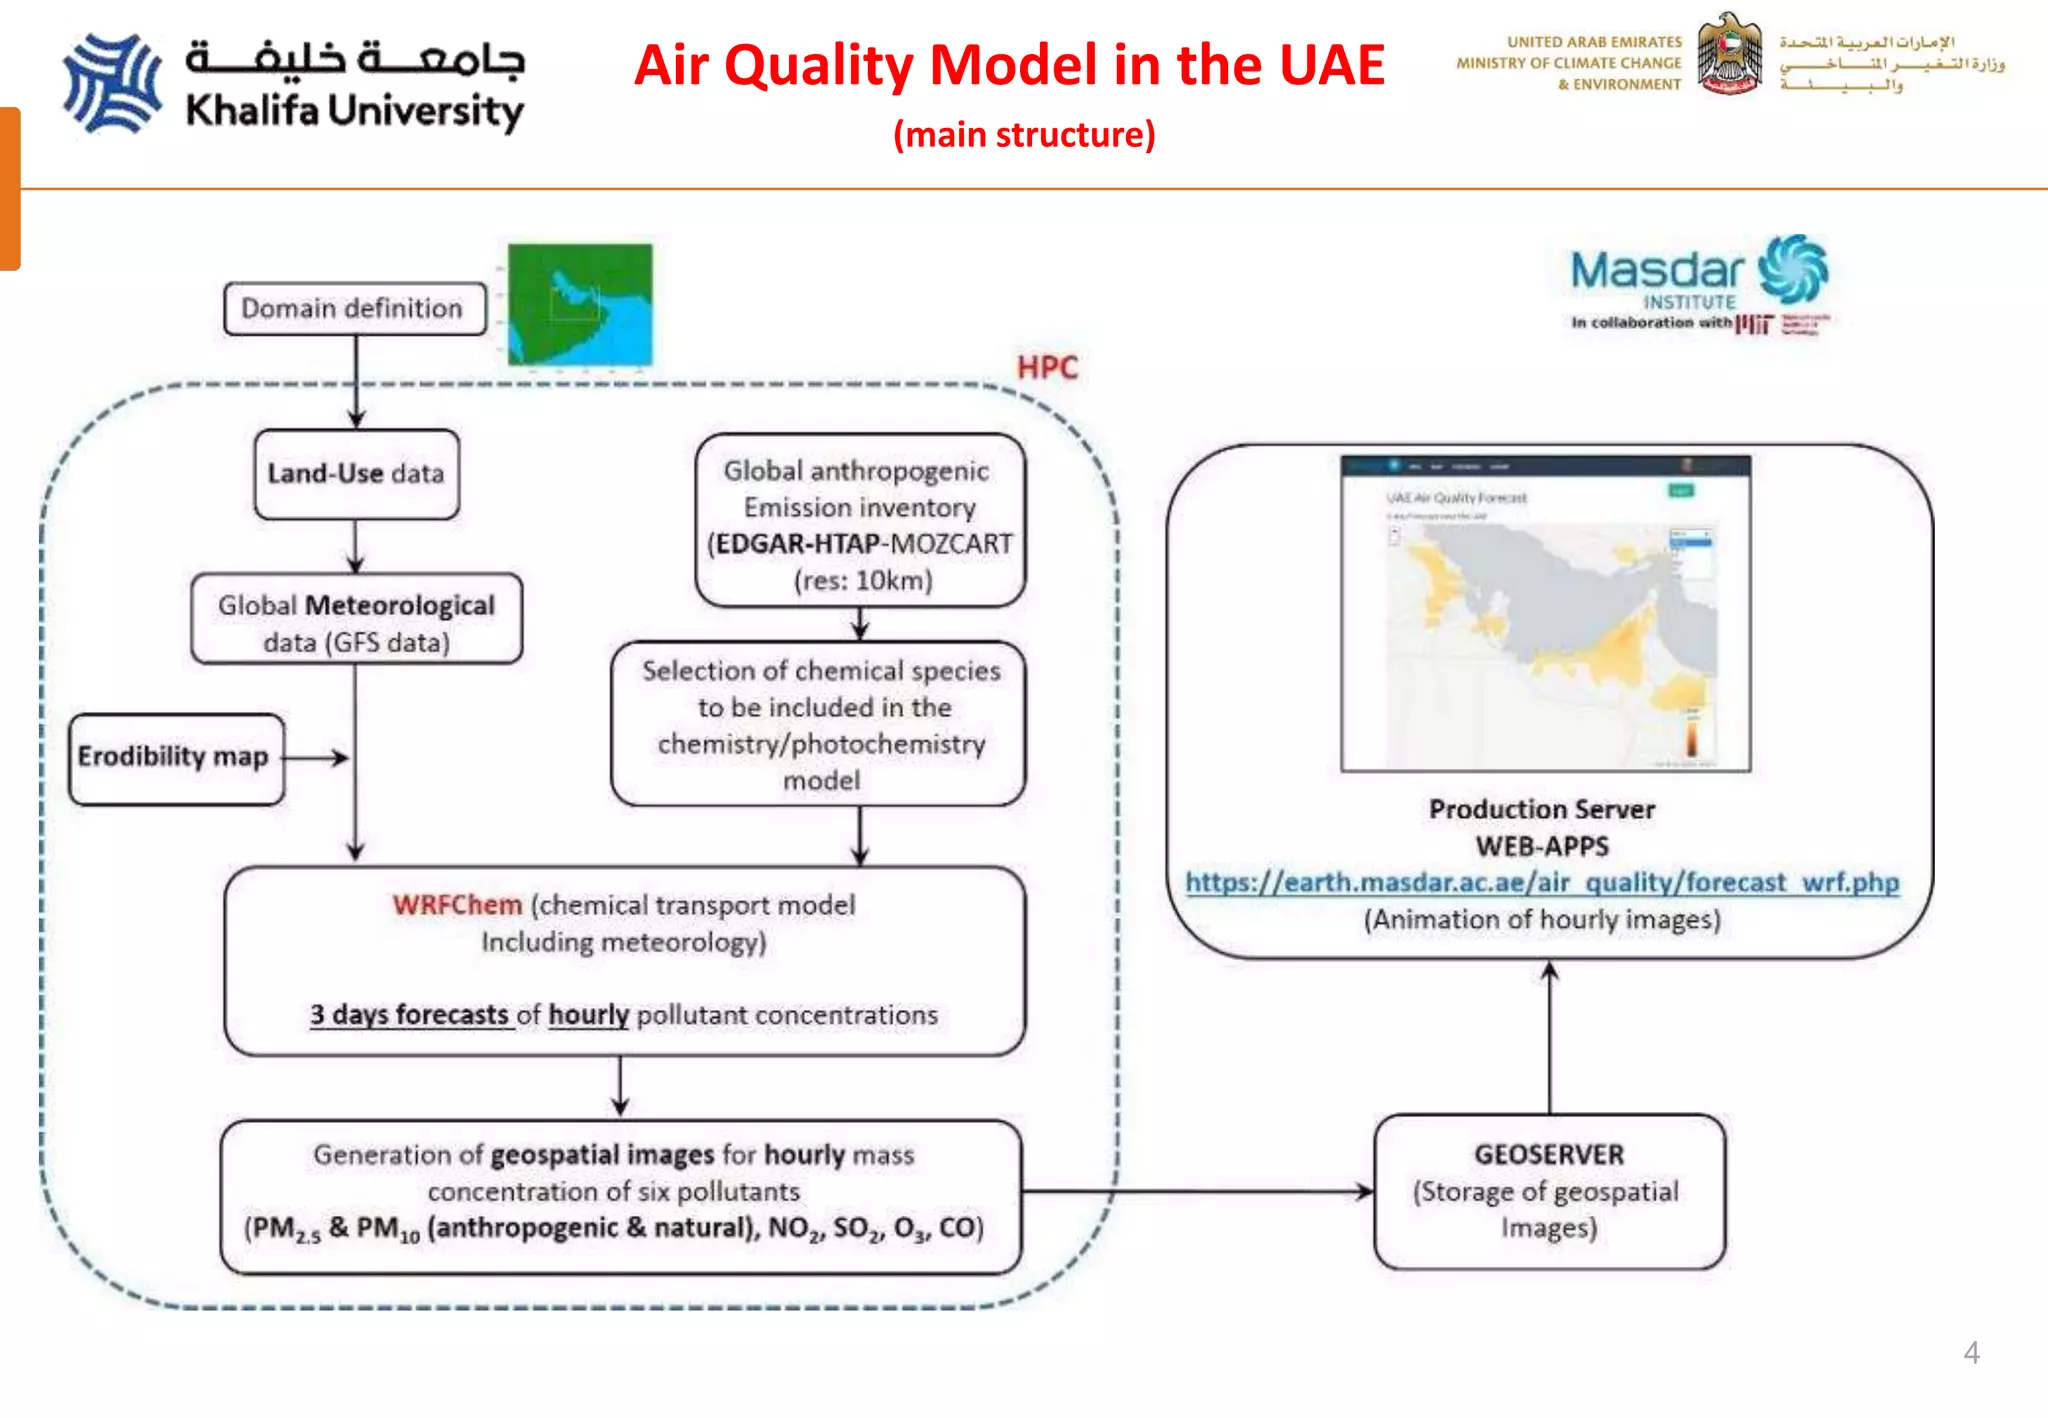
1
A thorough analysis of a severe dust storm in the
Arabian Peninsula using WRF-Chem, satellite
imagery, and ground observations. Impact on air
quality in the United Arab Emirates
Federico Karagulian, Marouane Temimi, Aisha Al Abdooli, Fatima Al Hammadi
2
Study area
 Shamal winds blow in the Arabian Gulf during the summer (June to August) and in winter
(November to March)
 Winter Shamal is know as one of the strongest wind in the Arabian Gulf Region with wind speed
reaching up 20 ms-1.
 Dust storm hitting the regions of the Arabian Gulf originate from dust sources coming from the Tigris
and Euphrates River Valleys, Iraq, East Syria and Kuwait and the Rub Al Khali deserts in Saudi
Arabia.
3
Air Quality Model in the UAE
(the concept)
Air quality Model to forecast
pollution over the UAE
Activity sectors
 Transport
 Energy
 Agriculture
 Industry
 Residential
 Biomass burning
 Aviation
 Shipping
Global emissions
from sectors
(EDGAR-HTAP 2010)
Meteorological
data (Global
Forecast
System - GFS)
+
Erodibility Map
(to include DUST)
PM10
4
Air Quality Model in the UAE
(main structure)
5
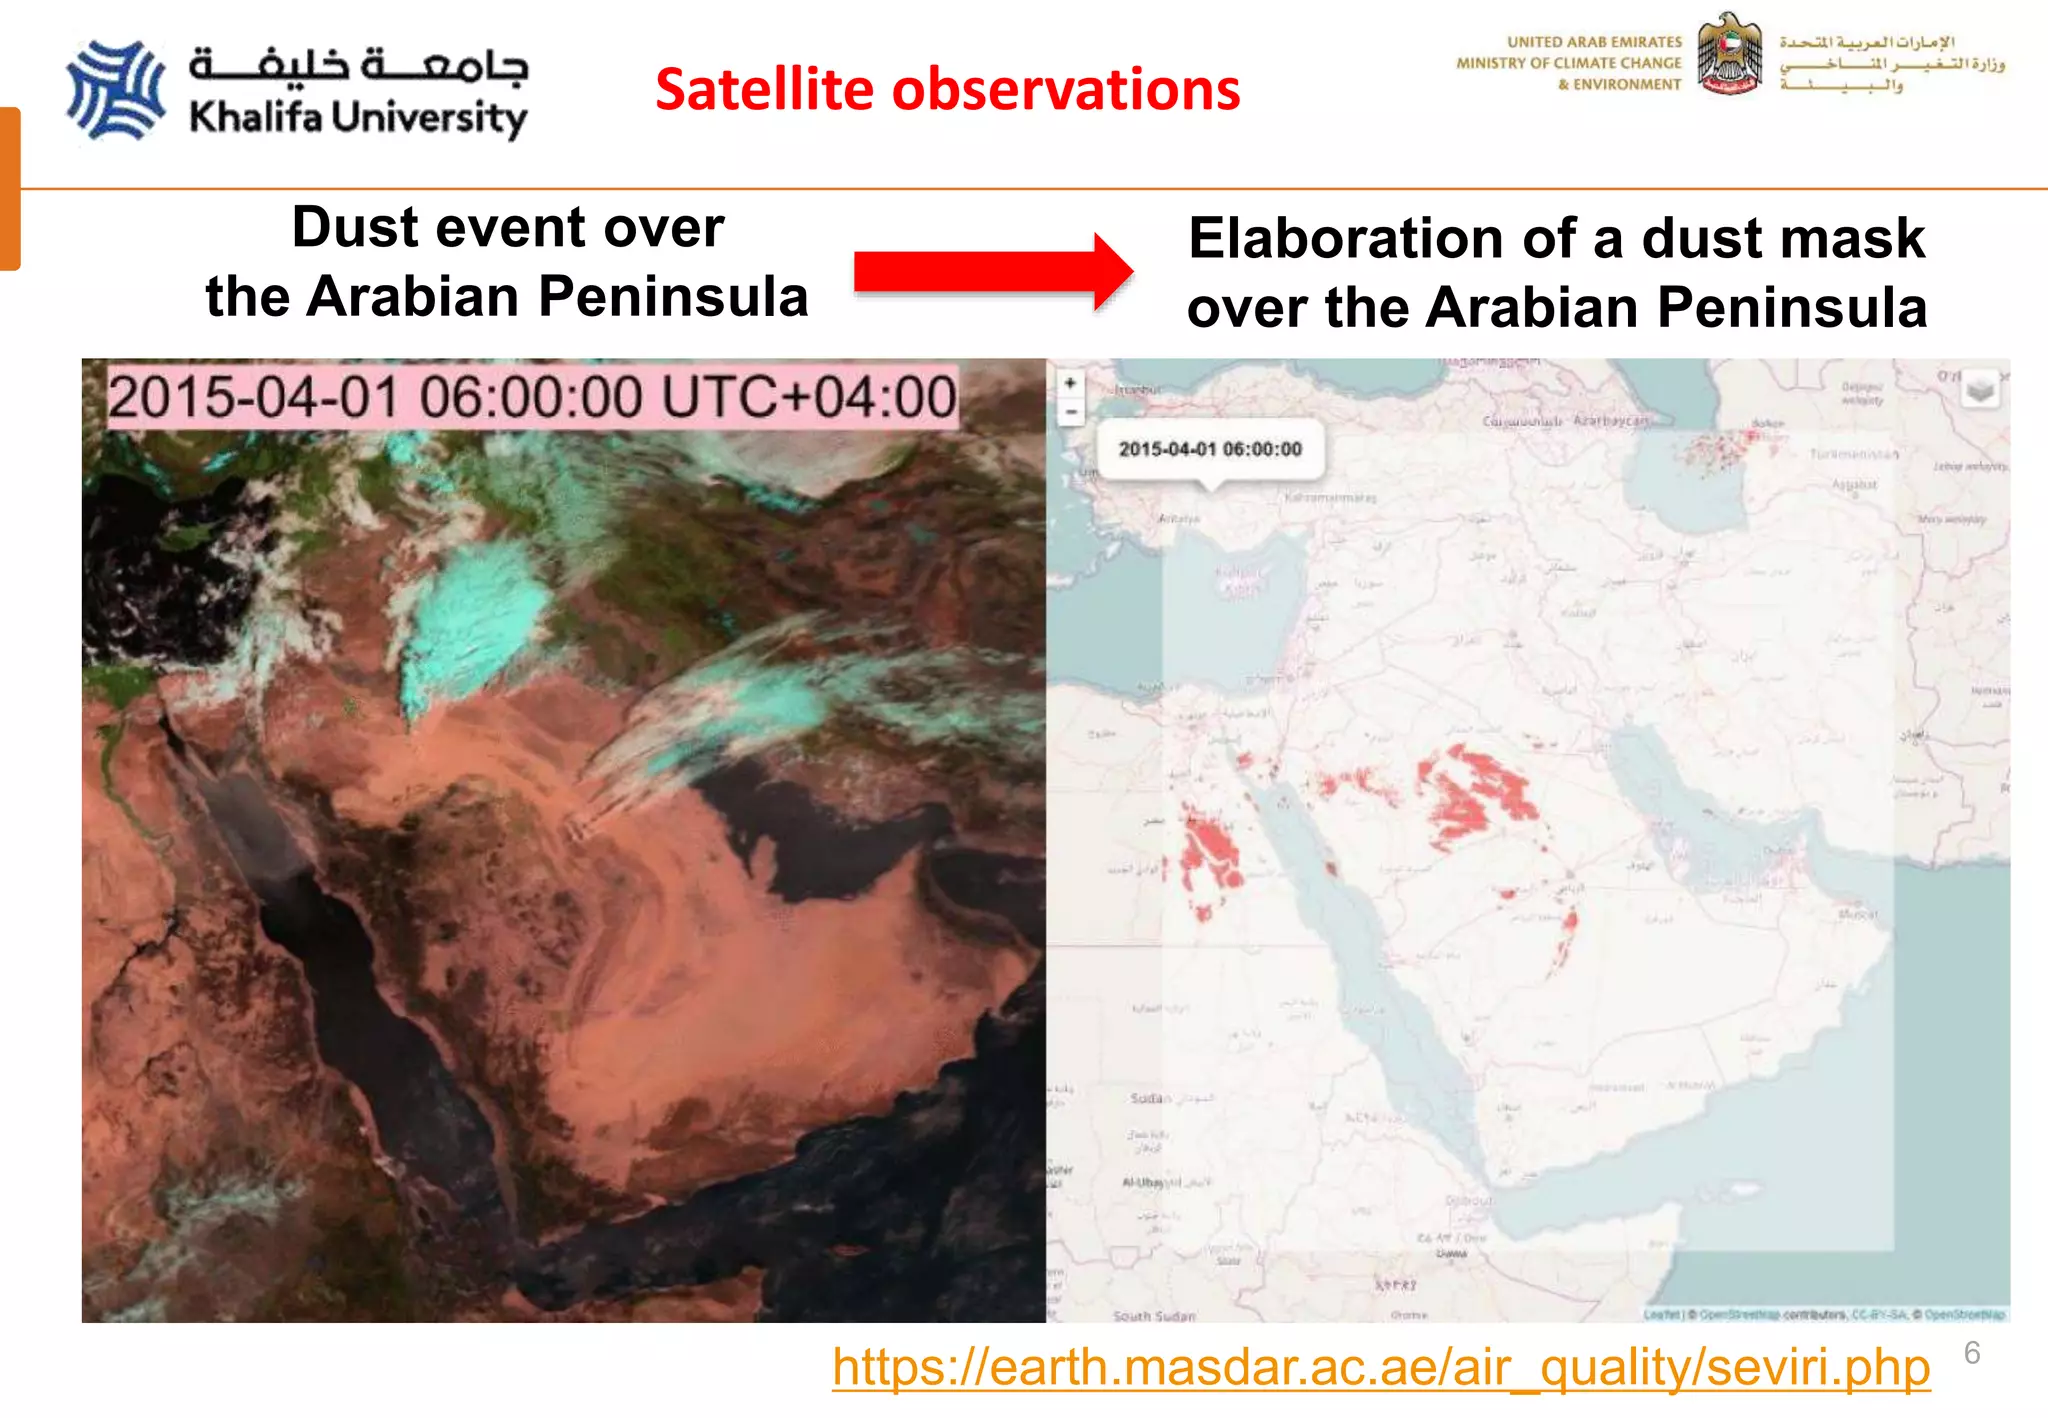
SEVIRI satellite data processing
[1] Martínez, M. A.; Ruiz, J.; Cuevas, E. Use of SEVIRI images and derived
products in a WMO Sand and dust Storm Warning System. IOP Conf. Ser.
Earth Environ. Sci. 2009, 7, 012004, doi:10.1088/1755-1307/7/1/012004
[2] Ashpole Ian; Washington Richard An automated dust detection using
SEVIRI: A multiyear climatology of summertime dustiness in the central and
western Sahara. J. Geophys. Res. Atmospheres 2012, 117,
doi:10.1029/2011JD016845.
[3] Banks, J. R.; Brindley, H. E. Evaluation of MSG-SEVIRI mineral dust
retrieval products over North Africa and the Middle East. Remote Sens.
Environ. 2013, 128, 58–73, doi:10.1016/j.rse.2012.07.017
[4] MétéoFrance Algorithm theoretical basis document for cloud products
(CMa-PGE01 v3.2, CT-PGE02 v2.2 & CTTH-PGE03 v2.2). Technical Report
SAF/NWC/CDOP/MFL/ SCI/ATBD/01. Paris: MétéoFrance, 2011.
References
Used two methodologies to process
SEVIRI satellite data:
1) EUMETSAT algorithm
2) MeteoFrance algorithm
6
Satellite observations
Dust event over
the Arabian Peninsula
Elaboration of a dust mask
over the Arabian Peninsula
https://earth.masdar.ac.ae/air_quality/seviri.php
7
WRFChem simulations during
the DUST event (29 March  3 April 2015)
https://earth.masdar.ac.ae/air_quality/forecast_wrf.php
8
DUST event from
MODIS/MAIAC satellite data
AQUATERRA
9
Comparison between
Satellite data and Model
Satelliteobservations
WRFChemsimulations
Dust event on
April 2015
Aerosols Optical Depth
WRFChemMODIS
Aerosols Optical Depth
10
Radiation
Wind Speed/Direction
(at the meteorological stations)
Meteorological data
During the DUST event
(29 March  03 April 2015)
Temperature
11
Validation with AERONET data
Good matching between WRFChem, MODIS and AERONET when compared with AOD
12
Comparisons of WRFChem model outputs
and ground-observations
Dust (PM10)
concentration from
measurements and
from the WRFChem
model
Temperature from
measurements and
from the WRFChem
model
13
Comparisons between WRFChem
outputs and ground-observations
Wind speed from
measurements and
from the WRFChem
model
Relative Humidity from
measurements and
from the WRFChem
model
14
Meteorology and dust transport
Back trajectories models to track origin
of dust events and pollution
Observations from monitoring
stations in the UAE
Peak time for
dust event
Dust event on
April 2015
15
Air Quality impact
during the DUST event
on April 2015
 AQIs were calculated using the current AQ
regulations in the UAE
 AQIs showed highest values on 2 April 2015,
reaching hazardous values
 PM10 was the main pollutant responsible for
AQIs
Air Quality Indexes (AQIs)
16
Contacts:
Dr. Federico Karagulian: federico.karagulian@ku.ac.ae
Dr. Marouane Temimi: marouane.temimi@ku.ac.ae
Thank you!

Dust Detection in the UAE

  • 1.
    1 A thorough analysisof a severe dust storm in the Arabian Peninsula using WRF-Chem, satellite imagery, and ground observations. Impact on air quality in the United Arab Emirates Federico Karagulian, Marouane Temimi, Aisha Al Abdooli, Fatima Al Hammadi
  • 2.
    2 Study area  Shamalwinds blow in the Arabian Gulf during the summer (June to August) and in winter (November to March)  Winter Shamal is know as one of the strongest wind in the Arabian Gulf Region with wind speed reaching up 20 ms-1.  Dust storm hitting the regions of the Arabian Gulf originate from dust sources coming from the Tigris and Euphrates River Valleys, Iraq, East Syria and Kuwait and the Rub Al Khali deserts in Saudi Arabia.
  • 3.
    3 Air Quality Modelin the UAE (the concept) Air quality Model to forecast pollution over the UAE Activity sectors  Transport  Energy  Agriculture  Industry  Residential  Biomass burning  Aviation  Shipping Global emissions from sectors (EDGAR-HTAP 2010) Meteorological data (Global Forecast System - GFS) + Erodibility Map (to include DUST) PM10
  • 4.
    4 Air Quality Modelin the UAE (main structure)
  • 5.
    5 SEVIRI satellite dataprocessing [1] Martínez, M. A.; Ruiz, J.; Cuevas, E. Use of SEVIRI images and derived products in a WMO Sand and dust Storm Warning System. IOP Conf. Ser. Earth Environ. Sci. 2009, 7, 012004, doi:10.1088/1755-1307/7/1/012004 [2] Ashpole Ian; Washington Richard An automated dust detection using SEVIRI: A multiyear climatology of summertime dustiness in the central and western Sahara. J. Geophys. Res. Atmospheres 2012, 117, doi:10.1029/2011JD016845. [3] Banks, J. R.; Brindley, H. E. Evaluation of MSG-SEVIRI mineral dust retrieval products over North Africa and the Middle East. Remote Sens. Environ. 2013, 128, 58–73, doi:10.1016/j.rse.2012.07.017 [4] MétéoFrance Algorithm theoretical basis document for cloud products (CMa-PGE01 v3.2, CT-PGE02 v2.2 & CTTH-PGE03 v2.2). Technical Report SAF/NWC/CDOP/MFL/ SCI/ATBD/01. Paris: MétéoFrance, 2011. References Used two methodologies to process SEVIRI satellite data: 1) EUMETSAT algorithm 2) MeteoFrance algorithm
  • 6.
    6 Satellite observations Dust eventover the Arabian Peninsula Elaboration of a dust mask over the Arabian Peninsula https://earth.masdar.ac.ae/air_quality/seviri.php
  • 7.
    7 WRFChem simulations during theDUST event (29 March  3 April 2015) https://earth.masdar.ac.ae/air_quality/forecast_wrf.php
  • 8.
    8 DUST event from MODIS/MAIACsatellite data AQUATERRA
  • 9.
    9 Comparison between Satellite dataand Model Satelliteobservations WRFChemsimulations Dust event on April 2015 Aerosols Optical Depth WRFChemMODIS Aerosols Optical Depth
  • 10.
    10 Radiation Wind Speed/Direction (at themeteorological stations) Meteorological data During the DUST event (29 March  03 April 2015) Temperature
  • 11.
    11 Validation with AERONETdata Good matching between WRFChem, MODIS and AERONET when compared with AOD
  • 12.
    12 Comparisons of WRFChemmodel outputs and ground-observations Dust (PM10) concentration from measurements and from the WRFChem model Temperature from measurements and from the WRFChem model
  • 13.
    13 Comparisons between WRFChem outputsand ground-observations Wind speed from measurements and from the WRFChem model Relative Humidity from measurements and from the WRFChem model
  • 14.
    14 Meteorology and dusttransport Back trajectories models to track origin of dust events and pollution Observations from monitoring stations in the UAE Peak time for dust event Dust event on April 2015
  • 15.
    15 Air Quality impact duringthe DUST event on April 2015  AQIs were calculated using the current AQ regulations in the UAE  AQIs showed highest values on 2 April 2015, reaching hazardous values  PM10 was the main pollutant responsible for AQIs Air Quality Indexes (AQIs)
  • 16.
    16 Contacts: Dr. Federico Karagulian:federico.karagulian@ku.ac.ae Dr. Marouane Temimi: marouane.temimi@ku.ac.ae Thank you!