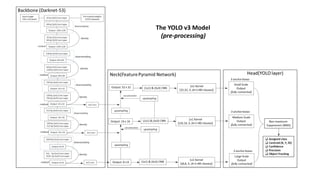
The document summarizes research on characterizing crowds in Piazza Duca d’Aosta in Milan, Italy using computer vision. A YOLO v3 model was used to detect and track pedestrians from camera footage. Trajectories were estimated and filtered to remove errors. Speed, direction, and density heatmaps were generated from the data at 15-minute intervals. Three main clusters of pedestrians were observed near subway entrances and in the center of the square. Speed heatmaps showed higher speeds in the center and uniform speeds near entrances, while density heatmaps illustrated pedestrian concentration patterns over time.
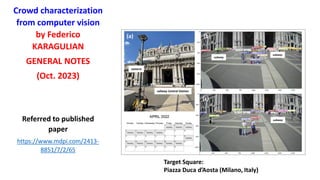


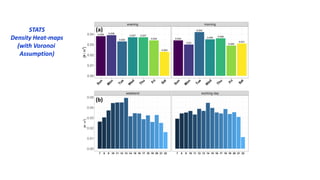
![Speed Heat-maps
Spatial representation of identified pedestrians from CV
a) Three main clusters of pedestrian were found
b) Centroid of the clusters were localized in the proximity
of the subway access points (A) and in the middle of
the square (B) Piazza Duca d’Aosta in front of the
central station.
Mean SPEED heatmaps of pedestrians.
Speeds have been computed for every
trajectory of each pedestrian ID by
considering spatial increment within 1 sec.
Speed values were averaged every 15
minutes.
➢ Speed were filtered for considering a minimum
forward speed of 0.3 [m/s] and a maximum
speed of 2.5 [m/s].
➢ High speed values were observed at the centre
of the square while subway access points
showed homogeneous speeds](https://image.slidesharecdn.com/computervision-231126174823-e1401691/85/Computer-Vision-13-320.jpg)