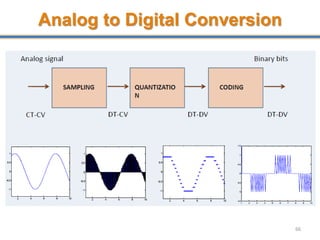
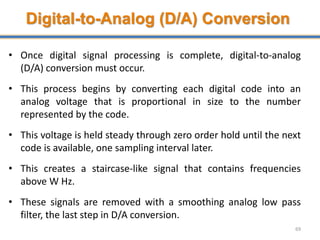
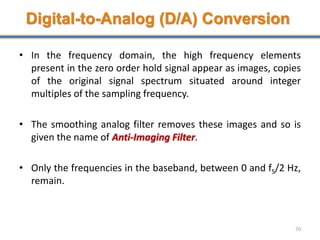
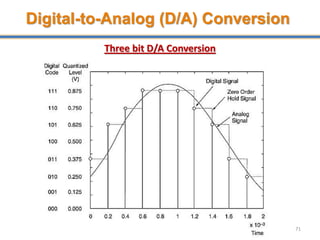
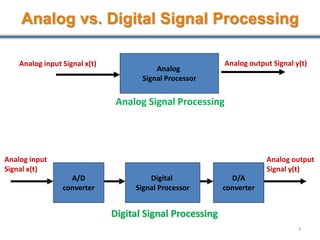
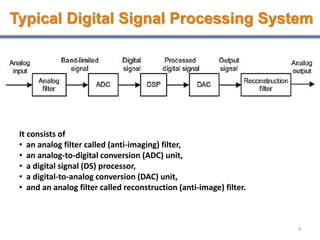
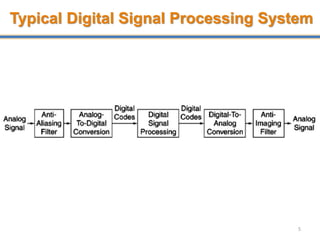
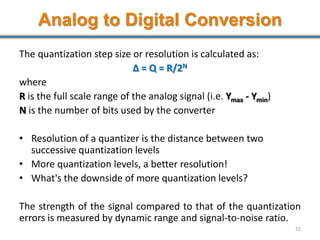
- Digital signal processing systems convert analog signals to digital signals for processing. They consist of anti-aliasing filters, analog-to-digital converters (ADCs), digital signal processors, digital-to-analog converters (DACs), and reconstruction filters.
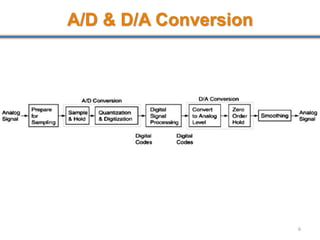
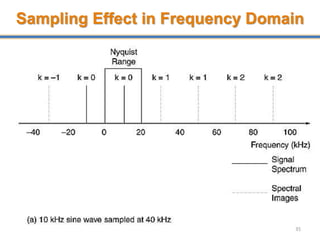
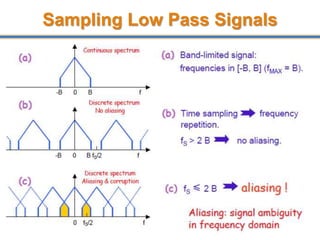
- ADCs sample analog signals and convert them to discrete digital values. Sampling must occur at least twice the maximum frequency of the analog signal, as per the Nyquist-Shannon sampling theorem, to avoid aliasing.
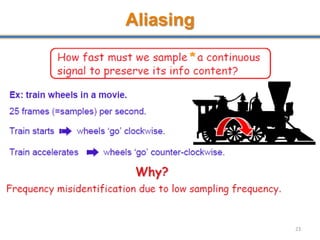
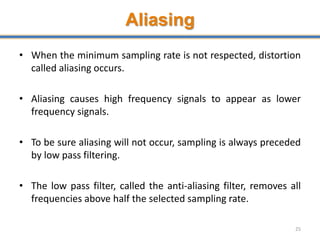
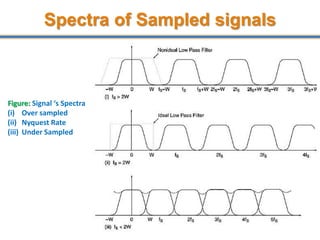
- Aliasing occurs when the sampling rate is too low, causing high frequency signals to appear as lower frequencies. Anti-aliasing filters are used before sampling to remove frequencies above half the sampling rate.
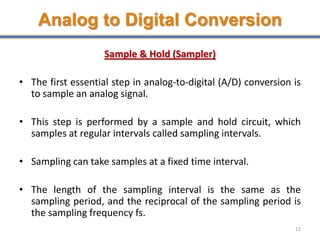
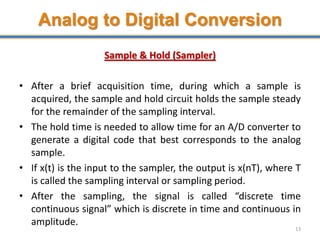
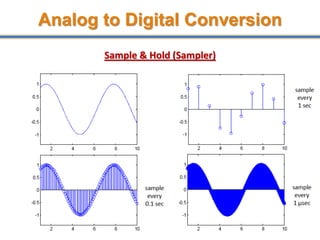
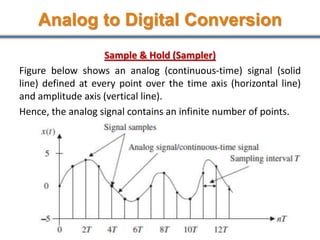
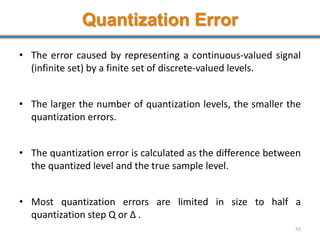
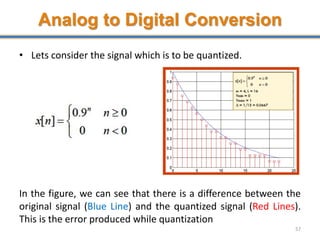
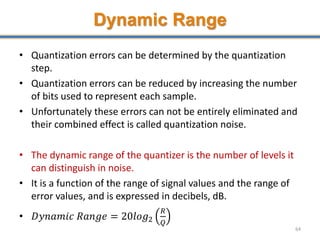
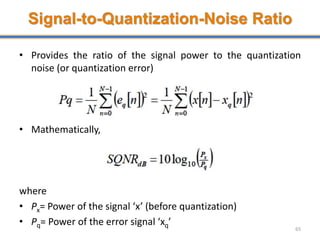
![Quantization Error
• Suppose a quantizer operation given by Q(.) is performed on
continuous-valued samples x[n] is given by Q(x[n]), then the
quantization error is given by
56](https://image.slidesharecdn.com/lecture-2-220718045709-9214ba2d/85/dsp-dip-pptx-56-320.jpg)