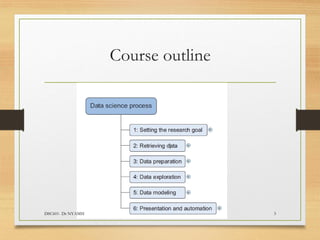
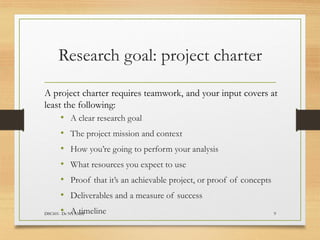
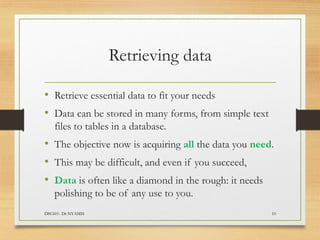
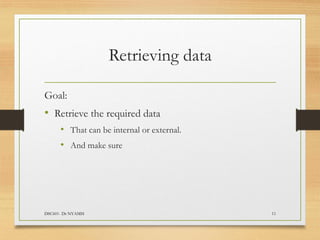
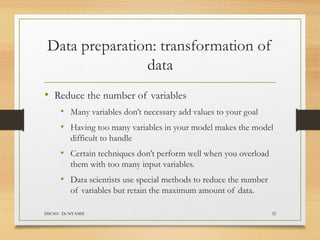
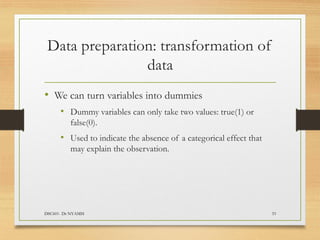
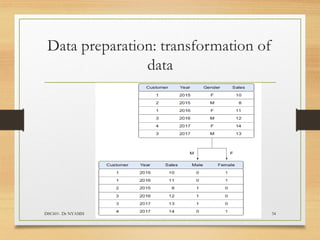
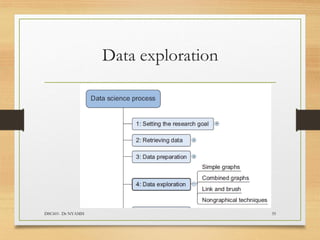
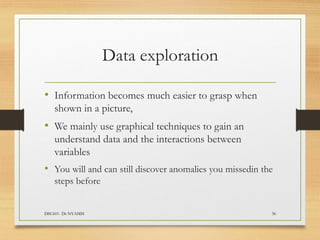
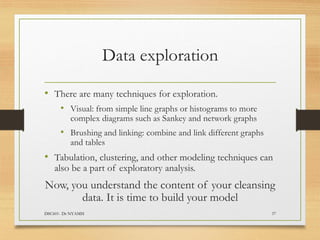
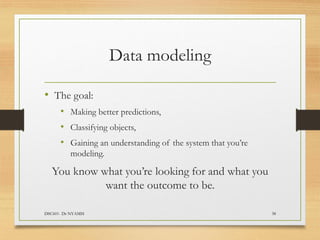
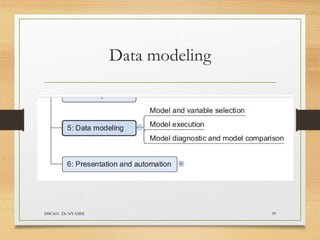
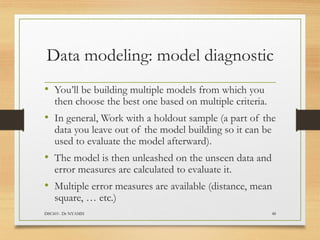
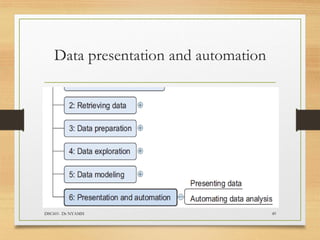
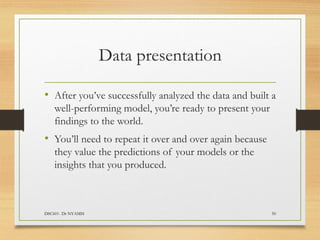
DSC 601
Data Science Process
Dr M. Nyamsi
Course Objectives
• Give an overview of the data science process
• Understand the flow of a data science process
• Learn how to work with big data sets, streaming data
DSC601- Dr NYAMSI 2
Course outline
DSC601- Dr NYAMSI 3
Course outline
• Research Goal
• Retrieving data
• Data preparation
• Data exploration
• Data modeling
• Presentation.
DSC601- Dr NYAMSI 4
Research goal
A project charter requires teamwork, and your input covers at
least the following:
• A clear research goal and the project mission and context
• How you’re going to perform your analysis
• What resources you expect to use
• Proof that it’s an achievable project, or proof of
concepts
• Deliverables and a measure of success; A timeline
DSC601- Dr NYAMSI 5
Research goal
• It states the purpose of your assignment in a clear and
focused manner
• Understand the business goals and context of the project
• Continue asking questions and devising examples until you
grasp the exact business expectations
• Identify how your project fits in the bigger picture
• Appreciate how your research is going to change the
business and understand how they’ll use your results.
DSC601- Dr NYAMSI 6
Research goal
• Many data scientists fail here:
• Despite their mathematical wit and scientific brilliance,
• They never seem to grasp the business goals and
context.
• Many students fail here:
• Despite their CSC background
• Despite their will
• Despite the explanations from their supervisors!
DSC601- Dr NYAMSI 7
Research goal
So, take time to search, refine,
ask good questions, … etc.
DSC601- Dr NYAMSI 8
Research goal: project charter
A project charter requires teamwork, and your input covers at
least the following:
• A clear research goal
• The project mission and context
• How you’re going to perform your analysis
• What resources you expect to use
• Proof that it’s an achievable project, or proof of concepts
• Deliverables and a measure of success
• A timeline
DSC601- Dr NYAMSI 9
Retrieving data
• Retrieve essential data to fit your needs
• Data can be stored in many forms, from simple text
files to tables in a database.
• The objective now is acquiring all the data you need.
• This may be difficult, and even if you succeed,
• Data is often like a diamond in the rough: it needs
polishing to be of any use to you.
DSC601- Dr NYAMSI 10
Retrieving data
Goal:
• Retrieve the required data
• That can be internal or external.
• And make sure
DSC601- Dr NYAMSI 11
Retrieving data: from the company
• First assess the relevance and quality of the data
that’s readily available within your company.
• This data can be founded in data repositories such as
• Databases: an organized collection of structured
information, or data, typically stored electronically in a
computer system.
• Data marts: a subject-oriented database that meets the
demands of a specific group of users.
DSC601- Dr NYAMSI 12
Retrieving data: from the company
• This data can be founded in data repositories such as
• Data warehouses: a large store of data accumulated from a
wide range of sources within a company and used to guide
management decisions.
• Data lakes: a centralized repository designed to store,
process, and secure large amounts of structured, semi-
structured, and unstructured data.
• Possibility exists that your data still resides in Excel files on
the desktop of a domain expert.
DSC601- Dr NYAMSI 13
Retrieving data: from the company
• As companies grow, their data becomes scattered
around many places.
• Organizations understand the value and sensitivity of
data
• Organizations often have policies in place, so
everyone has access to what they need and nothing
more.
DSC601- Dr NYAMSI 14
Retrieving data: out of the company
• You can shop data: Nielsen and GFK are well known
for this in the retail industry.
• Other companies provide data, in turn, they can
enrich their services and ecosystem.
• Example: Twitter, LinkedIn, and Facebook.
• More governments and organizations share their data
for free with the world. Share broad numbers of
topics
DSC601- Dr NYAMSI 15
Retrieving data: out of the company
DSC601- Dr NYAMSI 16
Retrieving data: data quality checks
• During data retrieval, you
• Check to see if the data is equal to the data in the source
document and
• Look to see if you have the right data types.
DSC601- Dr NYAMSI 17
Retrieving data: data quality checks
• With data preparation, you do a more elaborate
check.
• During the exploratory phase your focus shifts to
what you can learn from the data.
DSC601- Dr NYAMSI 18
Data preparation
Objective:
• Sanitize data
• Prepare it
for the
modeling
and
reporting
phase
DSC601- Dr NYAMSI 19
Data preparation: cleansing
• It focuses on removing errors in your data
• data becomes a true and consistent
• Avoid interpretation errors and standardization errors
• Example
• Gender: F, female,
• Money: cents and euro, or pound and dollars
• There are some possible solutions
DSC601- Dr NYAMSI 20
Data preparation: cleansing
DSC601- Dr NYAMSI 21
Data preparation: cleansing
DSC601- Dr NYAMSI 22
Data preparation: correction of
errors
DSC601- Dr NYAMSI 23
• Correct errors as early as possible
• The data collection process is error prone,
• In a big organization it involves many steps and
teams.
• Data should be cleansed when acquired for many
reasons
Data preparation: correction of
errors
DSC601- Dr NYAMSI 24
• Reasons of cleaning data
• Decision-makers may make costly mistakes on decisions
• Reusability of data: If not corrected early on in the
process, the cleansing will be done for every project that
uses that data.
• Data errors can point to bugs in software or in the
integration of software that may be critical to the
company
Data preparation: correction of
errors
DSC601- Dr NYAMSI 25
• Remarks:
• Always keep a copy of your original data (when
possible).
Data preparation: combine data
from different sources
DSC601- Dr NYAMSI 26
• Your data comes from several different places
• Data varies in size, type, and structure,
• Ranging from databases and Excel files to text
documents.
• We focus on data in table structures for the moment
• Keep in mind that other types of data sources exist,
such as key-value stores, document stores, … etc.
Data preparation: combine data
from different sources
DSC601- Dr NYAMSI 27
• Two ways to combine information from different
data sets.
• Join : enrich an observation from one table wit
information from another table.
• Appending or stacking: adding the observations of one
table to those of another table.
• Using union set, difference and intersection
• Operations from relational algebra seen in relational data
base.
Data preparation: combine data
from different sources
DSC601- Dr NYAMSI 28
• To join tables:
• You use variables that represents the same object in both
tables
• These common fields are known as keys.
• They can be primary keys or not
• We can also use views (virtual layer that combines the
tables) to simulate data joins or appends.
• We can enrich aggregated measures
Data preparation: transformation of
data
DSC601- Dr NYAMSI 29
• We have cleaned and integrated the data
• Certain models require their data to be in a certain
shape.
• We transform data so it takes a suitable form for data
modeling.
• We can transform data, we can reduce the number of
variables, we can turn variables into dummies
Data preparation: transformation of
data
DSC601- Dr NYAMSI 30
• Transformation:
• Found a relationships between an input variable and an
output variable
• Relationship can be linear or not
• Use numerical or statistical methods to do it
Data preparation: transformation of
data
DSC601- Dr NYAMSI 31
Data preparation: transformation of
data
DSC601- Dr NYAMSI 32
• Reduce the number of variables
• Many variables don’t necessary add values to your goal
• Having too many variables in your model makes the model
difficult to handle
• Certain techniques don’t perform well when you overload
them with too many input variables.
• Data scientists use special methods to reduce the number
of variables but retain the maximum amount of data.
Data preparation: transformation of
data
DSC601- Dr NYAMSI 33
• We can turn variables into dummies
• Dummy variables can only take two values: true(1) or
false(0).
• Used to indicate the absence of a categorical effect that
may explain the observation.
Data preparation: transformation of
data
DSC601- Dr NYAMSI 34
Data exploration
DSC601- Dr NYAMSI 35
Data exploration
• Information becomes much easier to grasp when
shown in a picture,
• We mainly use graphical techniques to gain an
understand data and the interactions between
variables
• You will and can still discover anomalies you missedin the
steps before
DSC601- Dr NYAMSI 36
Data exploration
• There are many techniques for exploration.
• Visual: from simple line graphs or histograms to more
complex diagrams such as Sankey and network graphs
• Brushing and linking: combine and link different graphs
and tables
• Tabulation, clustering, and other modeling techniques can
also be a part of exploratory analysis.
Now, you understand the content of your cleansing
data. It is time to build your model
DSC601- Dr NYAMSI 37
Data modeling
• The goal:
• Making better predictions,
• Classifying objects,
• Gaining an understanding of the system that you’re
modeling.
You know what you’re looking for and what you
want the outcome to be.
DSC601- Dr NYAMSI 38
Data modeling
DSC601- Dr NYAMSI 39
Data modeling
• The techniques we use here are borrowed from the
field of machine learning, data mining, and/or
statistics.
• Building a model is an iterative process.
• Most models consist of the following main steps:
1. Selection of a modeling technique and variables to enter
in the model
2. Execution of the model
3. Diagnosis and model comparison
DSC601- Dr NYAMSI 40
Data modeling: models and variables
• Objectives:
• Choose variables you need for your model,
• Choose a modeling technique
• From the exploratory analysis phase, we can flair
what variables will help us construct a good
model.
DSC601- Dr NYAMSI 41
Data modeling: models and variables
• Many modeling techniques are available,
• Choosing the right model for a problem requires
judgment on your part.
• Consider model performance and whether your
project meets all the requirements to use your
model
DSC601- Dr NYAMSI 42
Data modeling: models and variables
• Regression techniques: What is the predicted
value for the given data?
• Linear regression: it is a machine learning algorithm
based on supervised learning and is used for
predictive analysis. Regression models a target
prediction value based on independent variables.
Y=ax+b is an example of simple regression equation
• Multivariate regression, like linear regression but with
multiple variables.
DSC601- Dr NYAMSI 43
Data modeling: models and variables
• Classification techniques: what category does this
data belong to?
• Decision Trees: A simple non-linear and explainable
algorithm based on if-else rules.
• Support Vector Machines(SVMs): aim to draw a line or
plane with a wide margin to separate data into different
categories.
• Naïve Bayes Classifiers: simple probabilistic classifiers
based on applying Bayes’ theorem (from Bayesian statistics)
with strong (naive) independence assumptions.
DSC601- Dr NYAMSI 44
Data modeling: models and variables
• Classification techniques: what category does this
data belong to?
• Logistic regression: it is a popular supervised learning
algorithm used to assess the probability of a variable
having a binary label based on some predictive features.
• K-Nearest Neighbor (KNN): it is one of the simplest and
most effective classical machine learning algorithms. It
classifies an unknown test state by finding the k-nearest
neighbors from a set of M train states.
DSC601- Dr NYAMSI 45
Data modeling: models and variables
• Classification techniques: what category does this
data belong to?
• Random forests: the one of the most widely used ML
classifiers. They are ensemble learning method for
classification task.
• Artificial Neural Networks (ANNs): one of the best
models to find non-linear patterns in data and to
build really complex relationships between
independent and dependent variables.
DSC601- Dr NYAMSI 46
Data modeling: model execution
• Once you’ve chosen a model you’ll need to
implement it in code.
• Most programming languages, such as Python,
already have libraries such as StatsModels or Scikit-
learn.
• These packages use several of the most popular
techniques.
• Take the book on page 49 and try given examples.
(homework 1)
DSC601- Dr NYAMSI 47
Data modeling: model diagnostic
• You’ll be building multiple models from which you
then choose the best one based on multiple criteria.
• In general, Work with a holdout sample (a part of the
data you leave out of the model building so it can be
used to evaluate the model afterward).
• The model is then unleashed on the unseen data and
error measures are calculated to evaluate it.
• Multiple error measures are available (distance, mean
square, … etc.)
DSC601- Dr NYAMSI 48
Data presentation and automation
DSC601- Dr NYAMSI 49
Data presentation
• After you’ve successfully analyzed the data and built a
well-performing model, you’re ready to present your
findings to the world.
• You’ll need to repeat it over and over again because
they value the predictions of your models or the
insights that you produced.
DSC601- Dr NYAMSI 50

DS601-Data Science Processes for Data science Student.pdf

  • 1.
    DSC 601 Data ScienceProcess Dr M. Nyamsi
  • 2.
    Course Objectives • Givean overview of the data science process • Understand the flow of a data science process • Learn how to work with big data sets, streaming data DSC601- Dr NYAMSI 2
  • 3.
  • 4.
    Course outline • ResearchGoal • Retrieving data • Data preparation • Data exploration • Data modeling • Presentation. DSC601- Dr NYAMSI 4
  • 5.
    Research goal A projectcharter requires teamwork, and your input covers at least the following: • A clear research goal and the project mission and context • How you’re going to perform your analysis • What resources you expect to use • Proof that it’s an achievable project, or proof of concepts • Deliverables and a measure of success; A timeline DSC601- Dr NYAMSI 5
  • 6.
    Research goal • Itstates the purpose of your assignment in a clear and focused manner • Understand the business goals and context of the project • Continue asking questions and devising examples until you grasp the exact business expectations • Identify how your project fits in the bigger picture • Appreciate how your research is going to change the business and understand how they’ll use your results. DSC601- Dr NYAMSI 6
  • 7.
    Research goal • Manydata scientists fail here: • Despite their mathematical wit and scientific brilliance, • They never seem to grasp the business goals and context. • Many students fail here: • Despite their CSC background • Despite their will • Despite the explanations from their supervisors! DSC601- Dr NYAMSI 7
  • 8.
    Research goal So, taketime to search, refine, ask good questions, … etc. DSC601- Dr NYAMSI 8
  • 9.
    Research goal: projectcharter A project charter requires teamwork, and your input covers at least the following: • A clear research goal • The project mission and context • How you’re going to perform your analysis • What resources you expect to use • Proof that it’s an achievable project, or proof of concepts • Deliverables and a measure of success • A timeline DSC601- Dr NYAMSI 9
  • 10.
    Retrieving data • Retrieveessential data to fit your needs • Data can be stored in many forms, from simple text files to tables in a database. • The objective now is acquiring all the data you need. • This may be difficult, and even if you succeed, • Data is often like a diamond in the rough: it needs polishing to be of any use to you. DSC601- Dr NYAMSI 10
  • 11.
    Retrieving data Goal: • Retrievethe required data • That can be internal or external. • And make sure DSC601- Dr NYAMSI 11
  • 12.
    Retrieving data: fromthe company • First assess the relevance and quality of the data that’s readily available within your company. • This data can be founded in data repositories such as • Databases: an organized collection of structured information, or data, typically stored electronically in a computer system. • Data marts: a subject-oriented database that meets the demands of a specific group of users. DSC601- Dr NYAMSI 12
  • 13.
    Retrieving data: fromthe company • This data can be founded in data repositories such as • Data warehouses: a large store of data accumulated from a wide range of sources within a company and used to guide management decisions. • Data lakes: a centralized repository designed to store, process, and secure large amounts of structured, semi- structured, and unstructured data. • Possibility exists that your data still resides in Excel files on the desktop of a domain expert. DSC601- Dr NYAMSI 13
  • 14.
    Retrieving data: fromthe company • As companies grow, their data becomes scattered around many places. • Organizations understand the value and sensitivity of data • Organizations often have policies in place, so everyone has access to what they need and nothing more. DSC601- Dr NYAMSI 14
  • 15.
    Retrieving data: outof the company • You can shop data: Nielsen and GFK are well known for this in the retail industry. • Other companies provide data, in turn, they can enrich their services and ecosystem. • Example: Twitter, LinkedIn, and Facebook. • More governments and organizations share their data for free with the world. Share broad numbers of topics DSC601- Dr NYAMSI 15
  • 16.
    Retrieving data: outof the company DSC601- Dr NYAMSI 16
  • 17.
    Retrieving data: dataquality checks • During data retrieval, you • Check to see if the data is equal to the data in the source document and • Look to see if you have the right data types. DSC601- Dr NYAMSI 17
  • 18.
    Retrieving data: dataquality checks • With data preparation, you do a more elaborate check. • During the exploratory phase your focus shifts to what you can learn from the data. DSC601- Dr NYAMSI 18
  • 19.
    Data preparation Objective: • Sanitizedata • Prepare it for the modeling and reporting phase DSC601- Dr NYAMSI 19
  • 20.
    Data preparation: cleansing •It focuses on removing errors in your data • data becomes a true and consistent • Avoid interpretation errors and standardization errors • Example • Gender: F, female, • Money: cents and euro, or pound and dollars • There are some possible solutions DSC601- Dr NYAMSI 20
  • 21.
  • 22.
  • 23.
    Data preparation: correctionof errors DSC601- Dr NYAMSI 23 • Correct errors as early as possible • The data collection process is error prone, • In a big organization it involves many steps and teams. • Data should be cleansed when acquired for many reasons
  • 24.
    Data preparation: correctionof errors DSC601- Dr NYAMSI 24 • Reasons of cleaning data • Decision-makers may make costly mistakes on decisions • Reusability of data: If not corrected early on in the process, the cleansing will be done for every project that uses that data. • Data errors can point to bugs in software or in the integration of software that may be critical to the company
  • 25.
    Data preparation: correctionof errors DSC601- Dr NYAMSI 25 • Remarks: • Always keep a copy of your original data (when possible).
  • 26.
    Data preparation: combinedata from different sources DSC601- Dr NYAMSI 26 • Your data comes from several different places • Data varies in size, type, and structure, • Ranging from databases and Excel files to text documents. • We focus on data in table structures for the moment • Keep in mind that other types of data sources exist, such as key-value stores, document stores, … etc.
  • 27.
    Data preparation: combinedata from different sources DSC601- Dr NYAMSI 27 • Two ways to combine information from different data sets. • Join : enrich an observation from one table wit information from another table. • Appending or stacking: adding the observations of one table to those of another table. • Using union set, difference and intersection • Operations from relational algebra seen in relational data base.
  • 28.
    Data preparation: combinedata from different sources DSC601- Dr NYAMSI 28 • To join tables: • You use variables that represents the same object in both tables • These common fields are known as keys. • They can be primary keys or not • We can also use views (virtual layer that combines the tables) to simulate data joins or appends. • We can enrich aggregated measures
  • 29.
    Data preparation: transformationof data DSC601- Dr NYAMSI 29 • We have cleaned and integrated the data • Certain models require their data to be in a certain shape. • We transform data so it takes a suitable form for data modeling. • We can transform data, we can reduce the number of variables, we can turn variables into dummies
  • 30.
    Data preparation: transformationof data DSC601- Dr NYAMSI 30 • Transformation: • Found a relationships between an input variable and an output variable • Relationship can be linear or not • Use numerical or statistical methods to do it
  • 31.
    Data preparation: transformationof data DSC601- Dr NYAMSI 31
  • 32.
    Data preparation: transformationof data DSC601- Dr NYAMSI 32 • Reduce the number of variables • Many variables don’t necessary add values to your goal • Having too many variables in your model makes the model difficult to handle • Certain techniques don’t perform well when you overload them with too many input variables. • Data scientists use special methods to reduce the number of variables but retain the maximum amount of data.
  • 33.
    Data preparation: transformationof data DSC601- Dr NYAMSI 33 • We can turn variables into dummies • Dummy variables can only take two values: true(1) or false(0). • Used to indicate the absence of a categorical effect that may explain the observation.
  • 34.
    Data preparation: transformationof data DSC601- Dr NYAMSI 34
  • 35.
  • 36.
    Data exploration • Informationbecomes much easier to grasp when shown in a picture, • We mainly use graphical techniques to gain an understand data and the interactions between variables • You will and can still discover anomalies you missedin the steps before DSC601- Dr NYAMSI 36
  • 37.
    Data exploration • Thereare many techniques for exploration. • Visual: from simple line graphs or histograms to more complex diagrams such as Sankey and network graphs • Brushing and linking: combine and link different graphs and tables • Tabulation, clustering, and other modeling techniques can also be a part of exploratory analysis. Now, you understand the content of your cleansing data. It is time to build your model DSC601- Dr NYAMSI 37
  • 38.
    Data modeling • Thegoal: • Making better predictions, • Classifying objects, • Gaining an understanding of the system that you’re modeling. You know what you’re looking for and what you want the outcome to be. DSC601- Dr NYAMSI 38
  • 39.
  • 40.
    Data modeling • Thetechniques we use here are borrowed from the field of machine learning, data mining, and/or statistics. • Building a model is an iterative process. • Most models consist of the following main steps: 1. Selection of a modeling technique and variables to enter in the model 2. Execution of the model 3. Diagnosis and model comparison DSC601- Dr NYAMSI 40
  • 41.
    Data modeling: modelsand variables • Objectives: • Choose variables you need for your model, • Choose a modeling technique • From the exploratory analysis phase, we can flair what variables will help us construct a good model. DSC601- Dr NYAMSI 41
  • 42.
    Data modeling: modelsand variables • Many modeling techniques are available, • Choosing the right model for a problem requires judgment on your part. • Consider model performance and whether your project meets all the requirements to use your model DSC601- Dr NYAMSI 42
  • 43.
    Data modeling: modelsand variables • Regression techniques: What is the predicted value for the given data? • Linear regression: it is a machine learning algorithm based on supervised learning and is used for predictive analysis. Regression models a target prediction value based on independent variables. Y=ax+b is an example of simple regression equation • Multivariate regression, like linear regression but with multiple variables. DSC601- Dr NYAMSI 43
  • 44.
    Data modeling: modelsand variables • Classification techniques: what category does this data belong to? • Decision Trees: A simple non-linear and explainable algorithm based on if-else rules. • Support Vector Machines(SVMs): aim to draw a line or plane with a wide margin to separate data into different categories. • Naïve Bayes Classifiers: simple probabilistic classifiers based on applying Bayes’ theorem (from Bayesian statistics) with strong (naive) independence assumptions. DSC601- Dr NYAMSI 44
  • 45.
    Data modeling: modelsand variables • Classification techniques: what category does this data belong to? • Logistic regression: it is a popular supervised learning algorithm used to assess the probability of a variable having a binary label based on some predictive features. • K-Nearest Neighbor (KNN): it is one of the simplest and most effective classical machine learning algorithms. It classifies an unknown test state by finding the k-nearest neighbors from a set of M train states. DSC601- Dr NYAMSI 45
  • 46.
    Data modeling: modelsand variables • Classification techniques: what category does this data belong to? • Random forests: the one of the most widely used ML classifiers. They are ensemble learning method for classification task. • Artificial Neural Networks (ANNs): one of the best models to find non-linear patterns in data and to build really complex relationships between independent and dependent variables. DSC601- Dr NYAMSI 46
  • 47.
    Data modeling: modelexecution • Once you’ve chosen a model you’ll need to implement it in code. • Most programming languages, such as Python, already have libraries such as StatsModels or Scikit- learn. • These packages use several of the most popular techniques. • Take the book on page 49 and try given examples. (homework 1) DSC601- Dr NYAMSI 47
  • 48.
    Data modeling: modeldiagnostic • You’ll be building multiple models from which you then choose the best one based on multiple criteria. • In general, Work with a holdout sample (a part of the data you leave out of the model building so it can be used to evaluate the model afterward). • The model is then unleashed on the unseen data and error measures are calculated to evaluate it. • Multiple error measures are available (distance, mean square, … etc.) DSC601- Dr NYAMSI 48
  • 49.
    Data presentation andautomation DSC601- Dr NYAMSI 49
  • 50.
    Data presentation • Afteryou’ve successfully analyzed the data and built a well-performing model, you’re ready to present your findings to the world. • You’ll need to repeat it over and over again because they value the predictions of your models or the insights that you produced. DSC601- Dr NYAMSI 50