Download as PDF, PPTX
![Data Stream Mining Methods
Stochastic Gradient Descent
Vanilla stochastic gradient descent with a fixed learning
rate
Optimizing the hinge loss with an L2 penalty commonly
applied to SVM
Loss function to optimize:
λ
2
||w||2
+∑[1−(yxw+b)]+
12 / 26](https://image.slidesharecdn.com/ds10-101101165101-phpapp02/85/Sentiment-Knowledge-Discovery-in-Twitter-Streaming-Data-13-320.jpg)
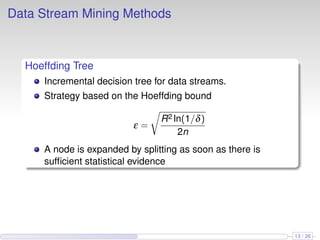

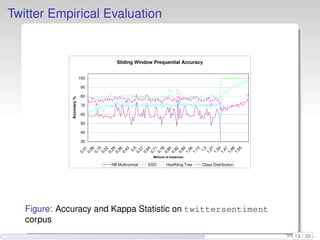
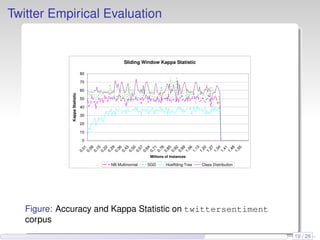
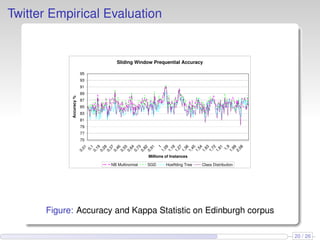
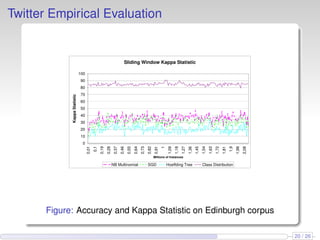
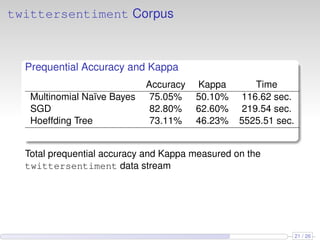
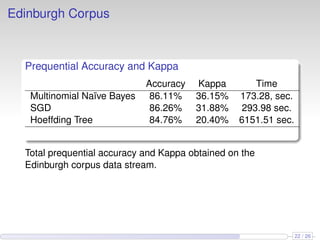
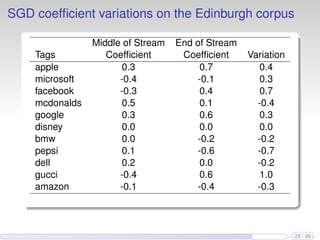
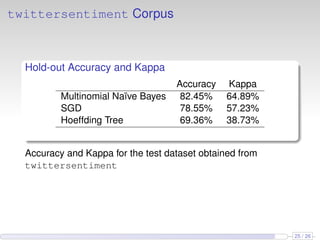
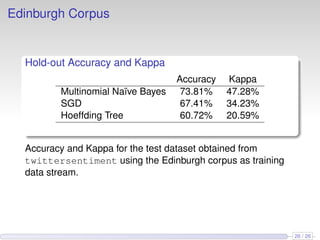

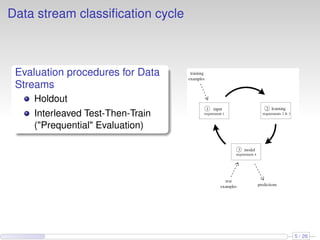
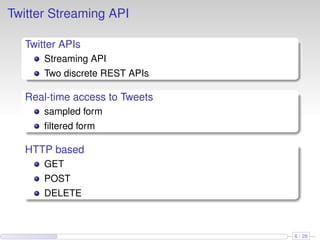
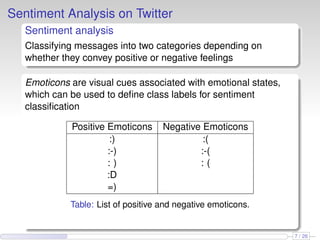
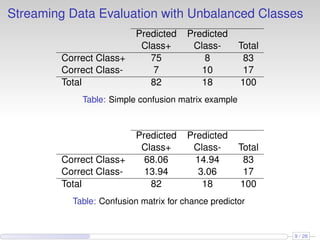
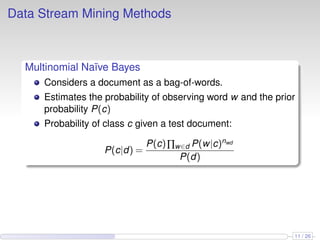
This document discusses the methods and empirical results of sentiment analysis on Twitter's streaming data, emphasizing real-time predictions and sentiment classification techniques. It highlights various data mining methods such as multinomial naïve Bayes, stochastic gradient descent, and Hoeffding trees, alongside evaluation metrics like kappa statistics. The results demonstrate the effectiveness of these techniques in classifying sentiments based on a collection of tweet data, providing insights into user emotions and engagement.