Download to read offline


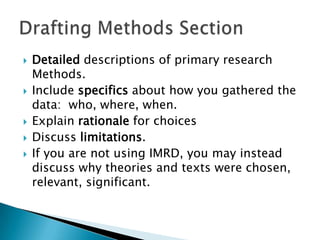
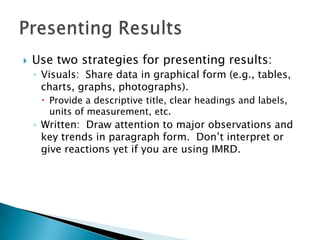
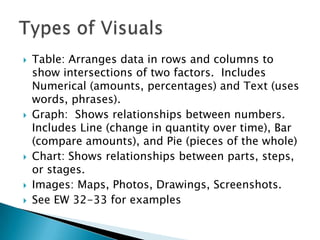
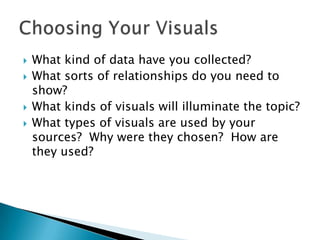


This document provides guidance on presenting data and results in a research paper. It discusses including details on how data was gathered and limitations. Visuals like tables, graphs and images should be used to present results, with a title, labels and legend. The document also provides tips on formatting visuals, citing sources, discussing results in text, and integrating results and discussion.


![Chapter_8.Research_Report_Writing_and_Presentation[1].pptx](https://cdn.slidesharecdn.com/ss_thumbnails/chapter8-260131073202-f187735f-thumbnail.jpg?width=640&height=640&fit=bounds)
