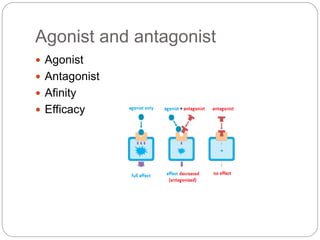
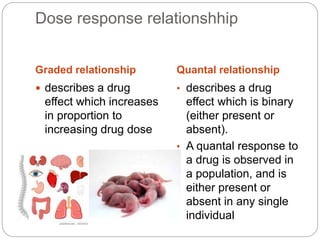
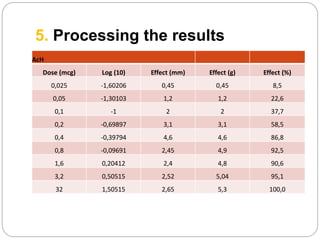
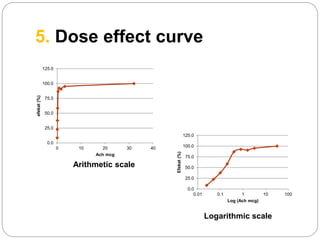
This document discusses dose-response relationships and key pharmacological concepts. It defines agonists and antagonists, and describes graded and quantal dose-response curves. Therapeutic index, safety factor, and therapeutic range are defined. Parameters that influence dose-response curves like potency, efficacy, and biological variability are covered. Different types of doses are outlined. The experimental method uses isolated guinea pig ileum to examine the dose-dependent contractions induced by acetylcholine. Results are processed to generate dose-response curves on both arithmetic and logarithmic scales.
![Dose response relationship
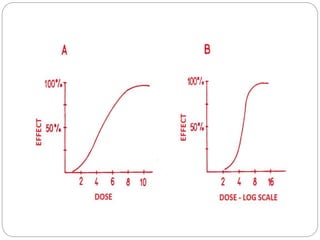
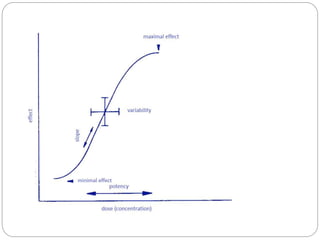
Full description of drug effect in the function of dose
[E=f(D)]
Dose response line: dose is ploted on X-axe and the
effect is ploted on Y-axe](https://image.slidesharecdn.com/doseresponserelationship-240325130303-4ff57bff/85/Dose-response-relationship-ppt-pharmacology-3-320.jpg)


![Non-Narcotic Drug Abuse - Forensic Medicine[1] final (1).pptx](https://cdn.slidesharecdn.com/ss_thumbnails/non-narcoticdrugabuse-forensicmedicine1final1-251214171438-c987c435-thumbnail.jpg?width=640&height=640&fit=bounds)


