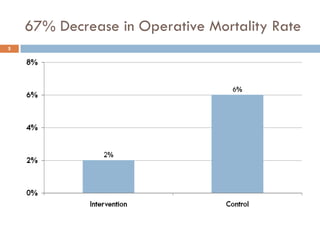
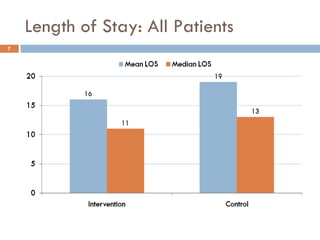
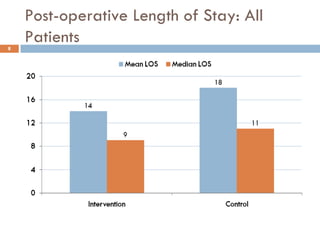
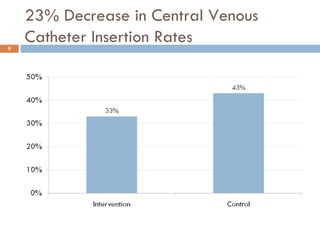
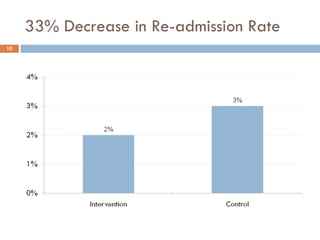
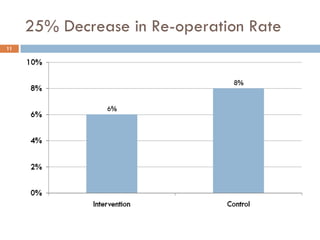
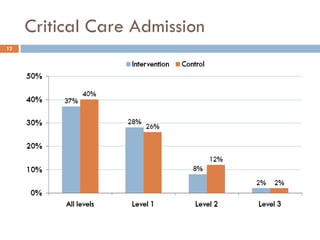
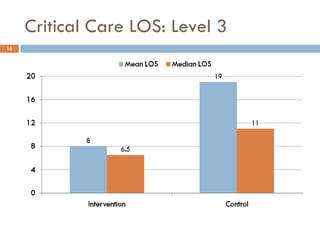
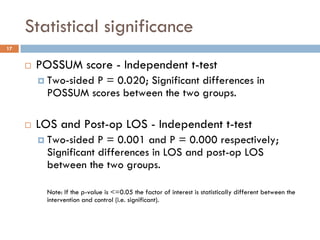
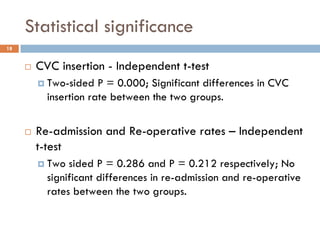
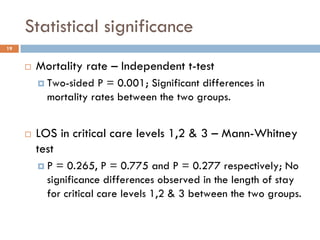
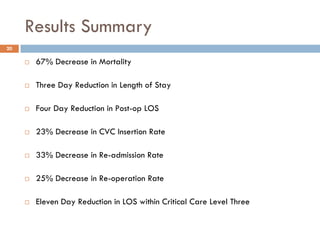
1


DOPPLER GUIDED INTRAOPERATIVE
FLUID MANAGEMENT: DATA
ANALYSIS


  NHS Technology Adoption Centre, January 2010.
Intervention vs. Comparator
2


     Intervention (n = 626)
       London: 1st April 2008 – 30th April 2009;
       Manchester: 1st January 2009 – 30th November 2009;
       Derby: 19th September 2008 – 30th November 2009.


     Control (n = 621)
       London: 1st March 2007 – 31st March 2008;
       Manchester: 1st January 2008 – 30th December 2008;
       Derby: 1st March 2007 – 18th September 2008.
Surgical Procedures
3


     Orthopaedics: Joint Replacement.

     Lower GI: Hartmann’s, Colectomy, Hemicolectomy.

     Upper GI: Whipples, Gastrostomy.

     Colorectal: Laparotomy, Bowel and Anterior Resection.

     Renal and Pancreas Transplants.

     Urological Cancer: Cystectomy and Nephrectomy.
Pre-operative Morbidity Risk
4
    Assessment POSSUM: All Patients
67% Decrease in Operative Mortality Rate
5
Intra-operative fluids administered: All
6
    Patients
Length of Stay: All Patients
7
Post-operative Length of Stay: All
8
    Patients
23% Decrease in Central Venous
9
    Catheter Insertion Rates
33% Decrease in Re-admission Rate
10
25% Decrease in Re-operation Rate
11
Critical Care Admission
12
Critical Care Length of Stay
13


      Level 1:
        Mean LOS – Intervention 3.11 Days, Control 2.95 Days.
        Median LOS – Intervention 3 Days, Control 3 Days.

      Level 2:
        Mean LOS – Intervention 4.58 Days, Control 4.73 Days.
        Median LOS – Intervention 3 Days, Control 3 Days.

      Level 3:
        Mean LOS – Intervention 8.40 Days, Control 19.31 Days.
        Median LOS – Intervention 6.5 Days, Control 11 Days.
Critical Care LOS: Level 1
14
Critical Care LOS: Level 2
15
Critical Care LOS: Level 3
16
Statistical significance
17


      POSSUM score - Independent t-test
        Two-sided P = 0.020; Significant differences in
        POSSUM scores between the two groups.

      LOS and Post-op LOS - Independent t-test
        Two-sided P = 0.001 and P = 0.000 respectively;
        Significant differences in LOS and post-op LOS
        between the two groups.

        Note: If the p-value is <=0.05 the factor of interest is statistically different between the
        intervention and control (i.e. significant).
Statistical significance
18


      CVC insertion - Independent t-test
        Two-sided P = 0.000; Significant differences in CVC
        insertion rate between the two groups.

      Re-admission and Re-operative rates – Independent
      t-test
        Two sided P = 0.286 and P = 0.212 respectively; No
        significant differences in re-admission and re-operative
        rates between the two groups.
Statistical significance
19


      Mortality rate – Independent t-test
        Two-sided P = 0.001; Significant differences in
        mortality rates between the two groups.


      LOS in critical care levels 1,2 & 3 – Mann-Whitney
      test
        P = 0.265, P = 0.775 and P = 0.277 respectively; No
        significance differences observed in the length of stay
        for critical care levels 1,2 & 3 between the two groups.
Results Summary
20

      67% Decrease in Mortality

      Three Day Reduction in Length of Stay

      Four Day Reduction in Post-op LOS

      23% Decrease in CVC Insertion Rate

      33% Decrease in Re-admission Rate

      25% Decrease in Re-operation Rate

      Eleven Day Reduction in LOS within Critical Care Level Three

Doppler Guided Intraoperative Fluid Management Data Analysis

  • 1.
    1 DOPPLER GUIDED INTRAOPERATIVE FLUIDMANAGEMENT: DATA ANALYSIS NHS Technology Adoption Centre, January 2010.
  • 2.
    Intervention vs. Comparator 2 Intervention (n = 626) London: 1st April 2008 – 30th April 2009; Manchester: 1st January 2009 – 30th November 2009; Derby: 19th September 2008 – 30th November 2009. Control (n = 621) London: 1st March 2007 – 31st March 2008; Manchester: 1st January 2008 – 30th December 2008; Derby: 1st March 2007 – 18th September 2008.
  • 3.
    Surgical Procedures 3 Orthopaedics: Joint Replacement. Lower GI: Hartmann’s, Colectomy, Hemicolectomy. Upper GI: Whipples, Gastrostomy. Colorectal: Laparotomy, Bowel and Anterior Resection. Renal and Pancreas Transplants. Urological Cancer: Cystectomy and Nephrectomy.
  • 4.
    Pre-operative Morbidity Risk 4 Assessment POSSUM: All Patients
  • 5.
    67% Decrease inOperative Mortality Rate 5
  • 6.
  • 7.
    Length of Stay:All Patients 7
  • 8.
    Post-operative Length ofStay: All 8 Patients
  • 9.
    23% Decrease inCentral Venous 9 Catheter Insertion Rates
  • 10.
    33% Decrease inRe-admission Rate 10
  • 11.
    25% Decrease inRe-operation Rate 11
  • 12.
  • 13.
    Critical Care Lengthof Stay 13 Level 1: Mean LOS – Intervention 3.11 Days, Control 2.95 Days. Median LOS – Intervention 3 Days, Control 3 Days. Level 2: Mean LOS – Intervention 4.58 Days, Control 4.73 Days. Median LOS – Intervention 3 Days, Control 3 Days. Level 3: Mean LOS – Intervention 8.40 Days, Control 19.31 Days. Median LOS – Intervention 6.5 Days, Control 11 Days.
  • 14.
  • 15.
  • 16.
  • 17.
    Statistical significance 17 POSSUM score - Independent t-test Two-sided P = 0.020; Significant differences in POSSUM scores between the two groups. LOS and Post-op LOS - Independent t-test Two-sided P = 0.001 and P = 0.000 respectively; Significant differences in LOS and post-op LOS between the two groups. Note: If the p-value is <=0.05 the factor of interest is statistically different between the intervention and control (i.e. significant).
  • 18.
    Statistical significance 18 CVC insertion - Independent t-test Two-sided P = 0.000; Significant differences in CVC insertion rate between the two groups. Re-admission and Re-operative rates – Independent t-test Two sided P = 0.286 and P = 0.212 respectively; No significant differences in re-admission and re-operative rates between the two groups.
  • 19.
    Statistical significance 19 Mortality rate – Independent t-test Two-sided P = 0.001; Significant differences in mortality rates between the two groups. LOS in critical care levels 1,2 & 3 – Mann-Whitney test P = 0.265, P = 0.775 and P = 0.277 respectively; No significance differences observed in the length of stay for critical care levels 1,2 & 3 between the two groups.
  • 20.
    Results Summary 20 67% Decrease in Mortality Three Day Reduction in Length of Stay Four Day Reduction in Post-op LOS 23% Decrease in CVC Insertion Rate 33% Decrease in Re-admission Rate 25% Decrease in Re-operation Rate Eleven Day Reduction in LOS within Critical Care Level Three