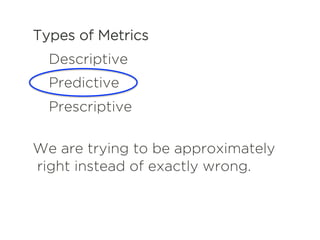
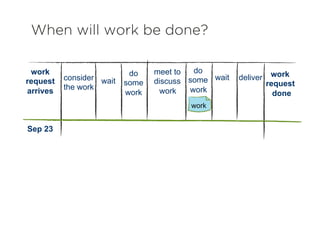
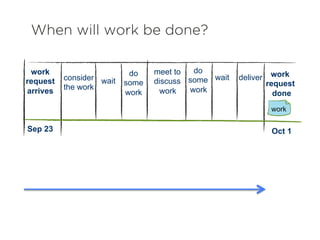
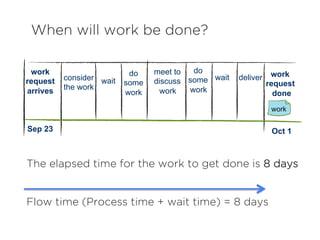
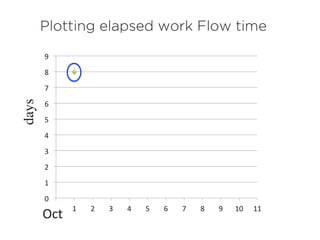
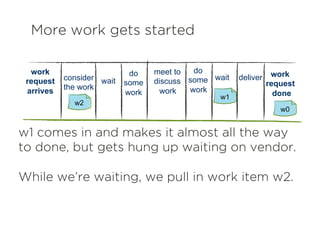
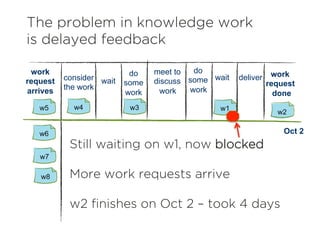
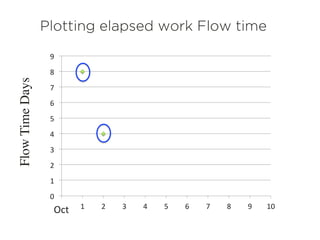
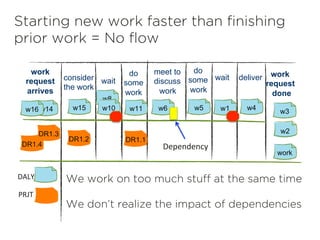
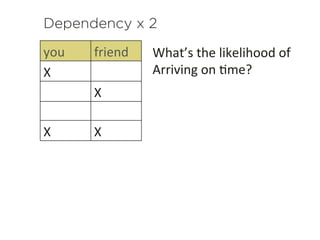
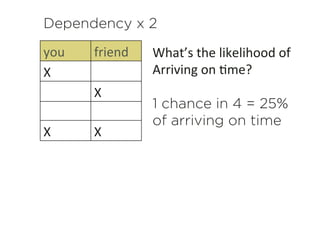
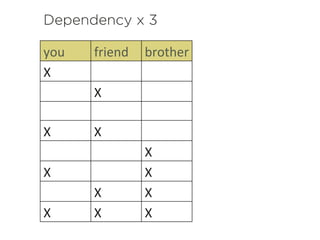
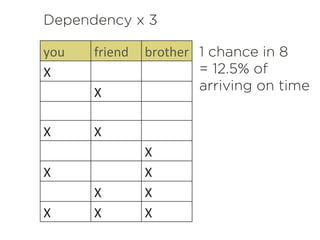
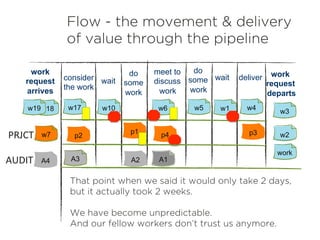
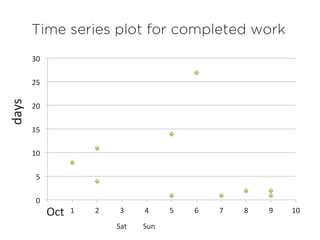
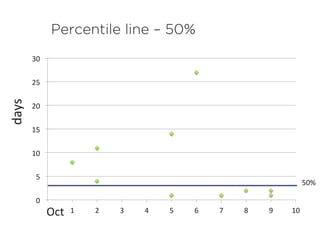
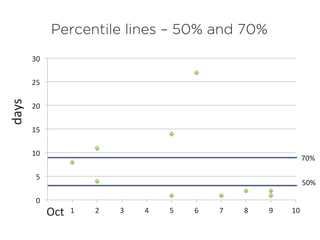
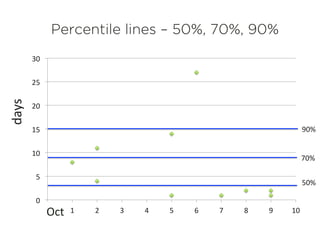
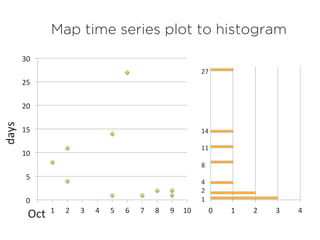
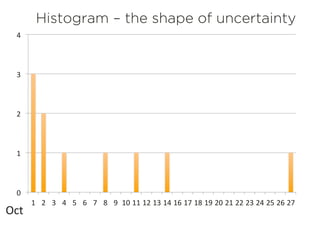
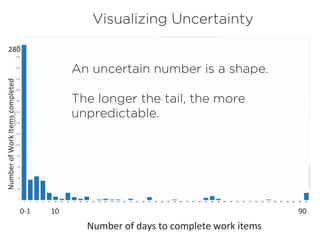
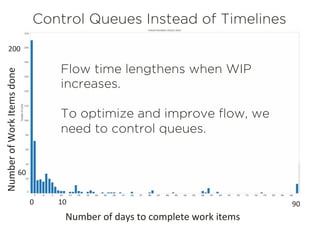
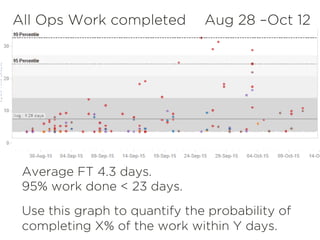
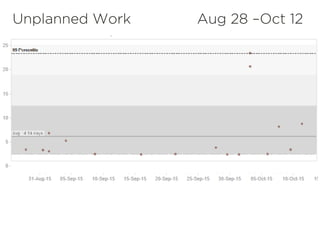
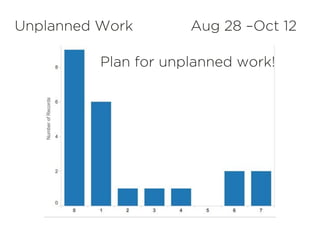
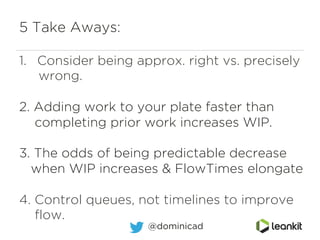
The Shape of Uncertainty
Dominica DeGrandis
Director, Learning & Development
@dominicad
dominica@leankit.com
www.leankit.com
The next full-margin
rupture of the Cascadia
subduction zone will
spell the worst natural
disaster in the history of
the continent.
The New Yorker
July 20, 2015
Year built:
1962
Foundation:
Cinder
blocks with
no rebar
Our house
Year built:
1962
Foundation:
Cinder
blocks with
no rebar
Our house
Types of Metrics
Descriptive
Predictive
Prescriptive
We are trying to be approximately
right instead of exactly wrong.
work
request
done


wait
meet to
discuss
work
wait
work
request
arrives
do
some
work
do
some
work
consider
the work
deliver
When will work be done?
	
  
work
Sep 23
work
request
done


wait
meet to
discuss
work
wait
work
request
arrives
do
some
work
do
some
work
consider
the work
deliver
When will work be done?
	
  
work
Sep 23 Oct 1
work
request
done


wait
meet to
discuss
work
wait
work
request
arrives
do
some
work
do
some
work
consider
the work
deliver
When will work be done?
	
  
work
The elapsed time for the work to get done is 8 days
Flow time (Process time + wait time) = 8 days	
  
Sep 23 Oct 1
Plotting elapsed work Flow timedays
0	
  
1	
  
2	
  
3	
  
4	
  
5	
  
6	
  
7	
  
8	
  
9	
  
0	
   1	
   2	
   3	
   4	
   5	
   6	
   7	
   8	
   9	
   10	
   11	
  
Oct	
  	
  
work
request
done


wait
meet to
discuss
work
wait
work
request
arrives
w1
do
some
work
do
some
work
consider
the work
deliver
More work gets started
	
  
w0
w1 comes in and makes it almost all the way
to done, but gets hung up waiting on vendor.
While we’re waiting, we pull in work item w2.
w2
work
request
done


wait
meet to
discuss
work
wait
work
request
arrives
w1
do
some
work
do
some
work
consider
the work
deliver
The problem in knowledge work
is delayed feedback
w2
w4w5 w3
Still waiting on w1, now blocked
More work requests arrive
w2 finishes on Oct 2 – took 4 days
	
  
w6
w7
w8
Oct 2
0	
  
1	
  
2	
  
3	
  
4	
  
5	
  
6	
  
7	
  
8	
  
9	
  
0	
   1	
   2	
   3	
   4	
   5	
   6	
   7	
   8	
   9	
   10	
  
Plotting elapsed work Flow timeFlowTimeDays
	
  	
  Oct	
  	
  
work
request
done


wait
meet to
discuss
work
wait
work
request
arrives
w1
do
some
work
do
some
work
consider
the work
deliver
Starting new work faster than finishing
prior work = No flow
w2
w4w5 w3
We work on too much stuff at the same time
We don’t realize the impact of dependencies
w6
DR1.1
w8
work
w11
DR1.2
w14 w10w15
DR1.3
DR1.4
w16
	
  Dependency	
  
PRJT	
  
DALY	
  
Dependency x 2
you	
   friend	
  
X	
  
X	
  
X	
   X	
  
What’s	
  the	
  likelihood	
  of	
  	
  
Arriving	
  on	
  Kme?	
  	
  
Dependency x 2
you	
   friend	
  
X	
  
X	
  
X	
   X	
  
What’s	
  the	
  likelihood	
  of	
  	
  
Arriving	
  on	
  Kme?	
  	
  
1 chance in 4 = 25%
of arriving on time
Dependency x 3
you	
   friend	
   brother	
  
X	
  
X	
  
X	
   X	
  
X	
  
X	
   X	
  
X	
   X	
  
X	
   X	
   X	
  
Dependency x 3
you	
   friend	
   brother	
  
X	
  
X	
  
X	
   X	
  
X	
  
X	
   X	
  
X	
   X	
  
X	
   X	
   X	
  
1 chance in 8
= 12.5% of
arriving on time
work
request
departs


wait
meet to
discuss
work
wait
work
request
arrives
w1
do
some
work
do
some
work
consider
the work
deliver
Flow - the movement & delivery
of value through the pipeline
w2
w4w5 w3
That point when we said it would only take 2 days,
but it actually took 2 weeks.
We have become unpredictable.
And our fellow workers don’t trust us anymore.
	
  
w6
p1
work
p2
w10
p3p4
w17
A1A2
w7
A3
w18
A4
w19
AUDIT	
  
PRJCT	
  
work
request
departs


wait
meet to
discuss
work
wait
work
request
arrives
w1
do
some
work
do
some
work
consider
the work
deliver
Flow - the movement & delivery
of value through the pipeline
w2
w4w5 w3
That point when we said it would only take 2 days,
but it actually took 2 weeks.
We have become unpredictable.
And our fellow workers don’t trust us anymore.
	
  
w6
p1
work
p2
w10
p3p4
w17
A1A2
w7
A3
w18
A4
w19
AUDIT	
  
PRJCT	
  
Time series plot for completed work
0	
  
5	
  
10	
  
15	
  
20	
  
25	
  
30	
  
0	
   1	
   2	
   3	
   4	
   5	
   6	
   7	
   8	
   9	
   10	
  
days	
  
	
  Oct	
  	
  
Sat	


  Sun	
  
Percentile line – 50%
0	
  
5	
  
10	
  
15	
  
20	
  
25	
  
30	
  
0	
   1	
   2	
   3	
   4	
   5	
   6	
   7	
   8	
   9	
   10	
  
days	
  
	
  Oct	
  	
  
50%	
  
Percentile lines – 50% and 70%
0	
  
5	
  
10	
  
15	
  
20	
  
25	
  
30	
  
0	
   1	
   2	
   3	
   4	
   5	
   6	
   7	
   8	
   9	
   10	
  
days	
  
	
  Oct	
  	
  
50%	
  
70%	
  
Percentile lines – 50%, 70%, 90%
0	
  
5	
  
10	
  
15	
  
20	
  
25	
  
30	
  
0	
   1	
   2	
   3	
   4	
   5	
   6	
   7	
   8	
   9	
   10	
  
days	
  
	
  Oct	
  	
  
50%	
  
70%	
  
90%	
  
Map time series plot to histogram
0	
  
5	
  
10	
  
15	
  
20	
  
25	
  
30	
  
0	
   1	
   2	
   3	
   4	
   5	
   6	
   7	
   8	
   9	
   10	
  
	
  Oct	
  	
  
0	
   1	
   2	
   3	
   4	
  
days	
  
27	


14	


11	


8	


4	
  
2	
  	
  
1	
  
0	
  
1	
  
2	
  
3	
  
4	
  
1	
   2	
   3	
   4	
   5	
   6	
   7	
   8	
   9	
   10	
  11	
  12	
  13	
  14	
  16	
  17	
  18	
  19	
  20	
  21	
  22	
  23	
  24	
  25	
  26	
  27	
  
Histogram – the shape of uncertainty
	
  Oct	
  	
  
Visualizing Uncertainty
An uncertain number is a shape.
The longer the tail, the more
unpredictable.
280	
  
90	
  0-­‐1	
  	
   10	
  
Number	
  of	
  Work	
  Items	
  completed	
  
Number	
  of	
  days	
  to	
  complete	
  work	
  items	
  
Control Queues Instead of Timelines
Flow time lengthens when WIP
increases.
To optimize and improve flow, we
need to control queues.
200	
  
60	
  
90	
  0	
   10	
  
Number	
  of	
  Work	
  Items	
  done	
  
Number	
  of	
  days	
  to	
  complete	
  work	
  items	
  
Average FT 4.3 days.
95% work done < 23 days.
Use this graph to quantify the probability of
completing X% of the work within Y days.
All Ops Work completed Aug 28 –Oct 12
Unplanned Work Aug 28 –Oct 12
Aug 28 Oct 12
12	
  data	
  points	
  
Number	
  of	
  Unplanned	
  Work	
  items	
  
Unplanned Work Aug 28 –Oct 12
Plan for unplanned work!
“If we have data, let’s look at
data. If all we have are
opinions, let’s go with mine.”
Jim Barksdale
former Netscape CEO
5 Take Aways:
1.  Consider being approx. right vs. precisely
wrong.
2. Adding work to your plate faster than
completing prior work increases WIP.
3. The odds of being predictable decrease
when WIP increases & FlowTimes elongate
4. Control queues, not timelines to improve
flow.
@dominicad
“If predictability is your goal,
the best thing you can do
as a leader is reserve capacity”
Troy Magennis
Founder, Focused Objective
	
  
Where is the costliest
uncertainty in your
organization?
	
  
@dominicad
References
@dominicad	
  
The Shape of Uncertainty
Dominica DeGrandis
Director, Learning & Development
dominica@leankit.com
www.leankit.com
@dominicad

Dominica the shapeofuncertainty.oct20

  • 1.
    The Shape ofUncertainty Dominica DeGrandis Director, Learning & Development @dominicad dominica@leankit.com www.leankit.com
  • 2.
    The next full-margin ruptureof the Cascadia subduction zone will spell the worst natural disaster in the history of the continent. The New Yorker July 20, 2015
  • 3.
  • 4.
  • 5.
    Types of Metrics Descriptive Predictive Prescriptive Weare trying to be approximately right instead of exactly wrong.
  • 6.
    work request done         wait meet to discuss work wait work request arrives do some work do some work consider the work deliver When will work be done?   work Sep 23
  • 7.
    work request done         wait meet to discuss work wait work request arrives do some work do some work consider the work deliver When will work be done?   work Sep 23 Oct 1
  • 8.
    work request done         wait meet to discuss work wait work request arrives do some work do some work consider the work deliver When will work be done?   work The elapsed time for the work to get done is 8 days Flow time (Process time + wait time) = 8 days   Sep 23 Oct 1
  • 9.
    Plotting elapsed workFlow timedays 0   1   2   3   4   5   6   7   8   9   0   1   2   3   4   5   6   7   8   9   10   11   Oct    
  • 10.
    work request done         wait meet to discuss work wait work request arrives w1 do some work do some work consider the work deliver More work gets started   w0 w1 comes in and makes it almost all the way to done, but gets hung up waiting on vendor. While we’re waiting, we pull in work item w2. w2
  • 11.
    work request done         wait meet to discuss work wait work request arrives w1 do some work do some work consider the work deliver The problem in knowledge work is delayed feedback w2 w4w5 w3 Still waiting on w1, now blocked More work requests arrive w2 finishes on Oct 2 – took 4 days   w6 w7 w8 Oct 2
  • 12.
    0   1   2   3   4   5   6   7   8   9   0   1   2   3   4   5   6   7   8   9   10   Plotting elapsed work Flow timeFlowTimeDays    Oct    
  • 13.
    work request done         wait meet to discuss work wait work request arrives w1 do some work do some work consider the work deliver Starting new work faster than finishing prior work = No flow w2 w4w5 w3 We work on too much stuff at the same time We don’t realize the impact of dependencies w6 DR1.1 w8 work w11 DR1.2 w14 w10w15 DR1.3 DR1.4 w16  Dependency   PRJT   DALY  
  • 14.
    Dependency x 2 you   friend   X   X   X   X   What’s  the  likelihood  of     Arriving  on  Kme?    
  • 15.
    Dependency x 2 you   friend   X   X   X   X   What’s  the  likelihood  of     Arriving  on  Kme?     1 chance in 4 = 25% of arriving on time
  • 16.
    Dependency x 3 you   friend   brother   X   X   X   X   X   X   X   X   X   X   X   X  
  • 17.
    Dependency x 3 you   friend   brother   X   X   X   X   X   X   X   X   X   X   X   X   1 chance in 8 = 12.5% of arriving on time
  • 18.
    work request departs         wait meet to discuss work wait work request arrives w1 do some work do some work consider the work deliver Flow - the movement & delivery of value through the pipeline w2 w4w5 w3 That point when we said it would only take 2 days, but it actually took 2 weeks. We have become unpredictable. And our fellow workers don’t trust us anymore.   w6 p1 work p2 w10 p3p4 w17 A1A2 w7 A3 w18 A4 w19 AUDIT   PRJCT  
  • 19.
    work request departs         wait meet to discuss work wait work request arrives w1 do some work do some work consider the work deliver Flow - the movement & delivery of value through the pipeline w2 w4w5 w3 That point when we said it would only take 2 days, but it actually took 2 weeks. We have become unpredictable. And our fellow workers don’t trust us anymore.   w6 p1 work p2 w10 p3p4 w17 A1A2 w7 A3 w18 A4 w19 AUDIT   PRJCT  
  • 20.
    work request departs         wait meet to discuss work wait work request arrives w1 do some work do some work consider the work deliver Flow - the movement & delivery of value through the pipeline w2 w4w5 w3 That point when we said it would only take 2 days, but it actually took 2 weeks. We have become unpredictable. And our fellow workers don’t trust us anymore.   w6 p1 work p2 w10 p3p4 w17 A1A2 w7 A3 w18 A4 w19 AUDIT   PRJCT  
  • 21.
    Time series plotfor completed work 0   5   10   15   20   25   30   0   1   2   3   4   5   6   7   8   9   10   days    Oct     Sat                  Sun  
  • 22.
    Percentile line –50% 0   5   10   15   20   25   30   0   1   2   3   4   5   6   7   8   9   10   days    Oct     50%  
  • 23.
    Percentile lines –50% and 70% 0   5   10   15   20   25   30   0   1   2   3   4   5   6   7   8   9   10   days    Oct     50%   70%  
  • 24.
    Percentile lines –50%, 70%, 90% 0   5   10   15   20   25   30   0   1   2   3   4   5   6   7   8   9   10   days    Oct     50%   70%   90%  
  • 25.
    Map time seriesplot to histogram 0   5   10   15   20   25   30   0   1   2   3   4   5   6   7   8   9   10    Oct     0   1   2   3   4   days   27               14     11     8     4   2     1  
  • 26.
    0   1   2   3   4   1   2   3   4   5   6   7   8   9   10  11  12  13  14  16  17  18  19  20  21  22  23  24  25  26  27   Histogram – the shape of uncertainty  Oct    
  • 27.
    Visualizing Uncertainty An uncertainnumber is a shape. The longer the tail, the more unpredictable. 280   90  0-­‐1     10   Number  of  Work  Items  completed   Number  of  days  to  complete  work  items  
  • 28.
    Control Queues Insteadof Timelines Flow time lengthens when WIP increases. To optimize and improve flow, we need to control queues. 200   60   90  0   10   Number  of  Work  Items  done   Number  of  days  to  complete  work  items  
  • 29.
    Average FT 4.3days. 95% work done < 23 days. Use this graph to quantify the probability of completing X% of the work within Y days. All Ops Work completed Aug 28 –Oct 12
  • 30.
    Unplanned Work Aug28 –Oct 12 Aug 28 Oct 12 12  data  points  
  • 31.
    Number  of  Unplanned  Work  items   Unplanned Work Aug 28 –Oct 12 Plan for unplanned work!
  • 32.
    “If we havedata, let’s look at data. If all we have are opinions, let’s go with mine.” Jim Barksdale former Netscape CEO
  • 33.
    5 Take Aways: 1. Consider being approx. right vs. precisely wrong. 2. Adding work to your plate faster than completing prior work increases WIP. 3. The odds of being predictable decrease when WIP increases & FlowTimes elongate 4. Control queues, not timelines to improve flow. @dominicad
  • 34.
    “If predictability isyour goal, the best thing you can do as a leader is reserve capacity” Troy Magennis Founder, Focused Objective  
  • 35.
    Where is thecostliest uncertainty in your organization?   @dominicad
  • 36.
  • 37.
    The Shape ofUncertainty Dominica DeGrandis Director, Learning & Development dominica@leankit.com www.leankit.com @dominicad