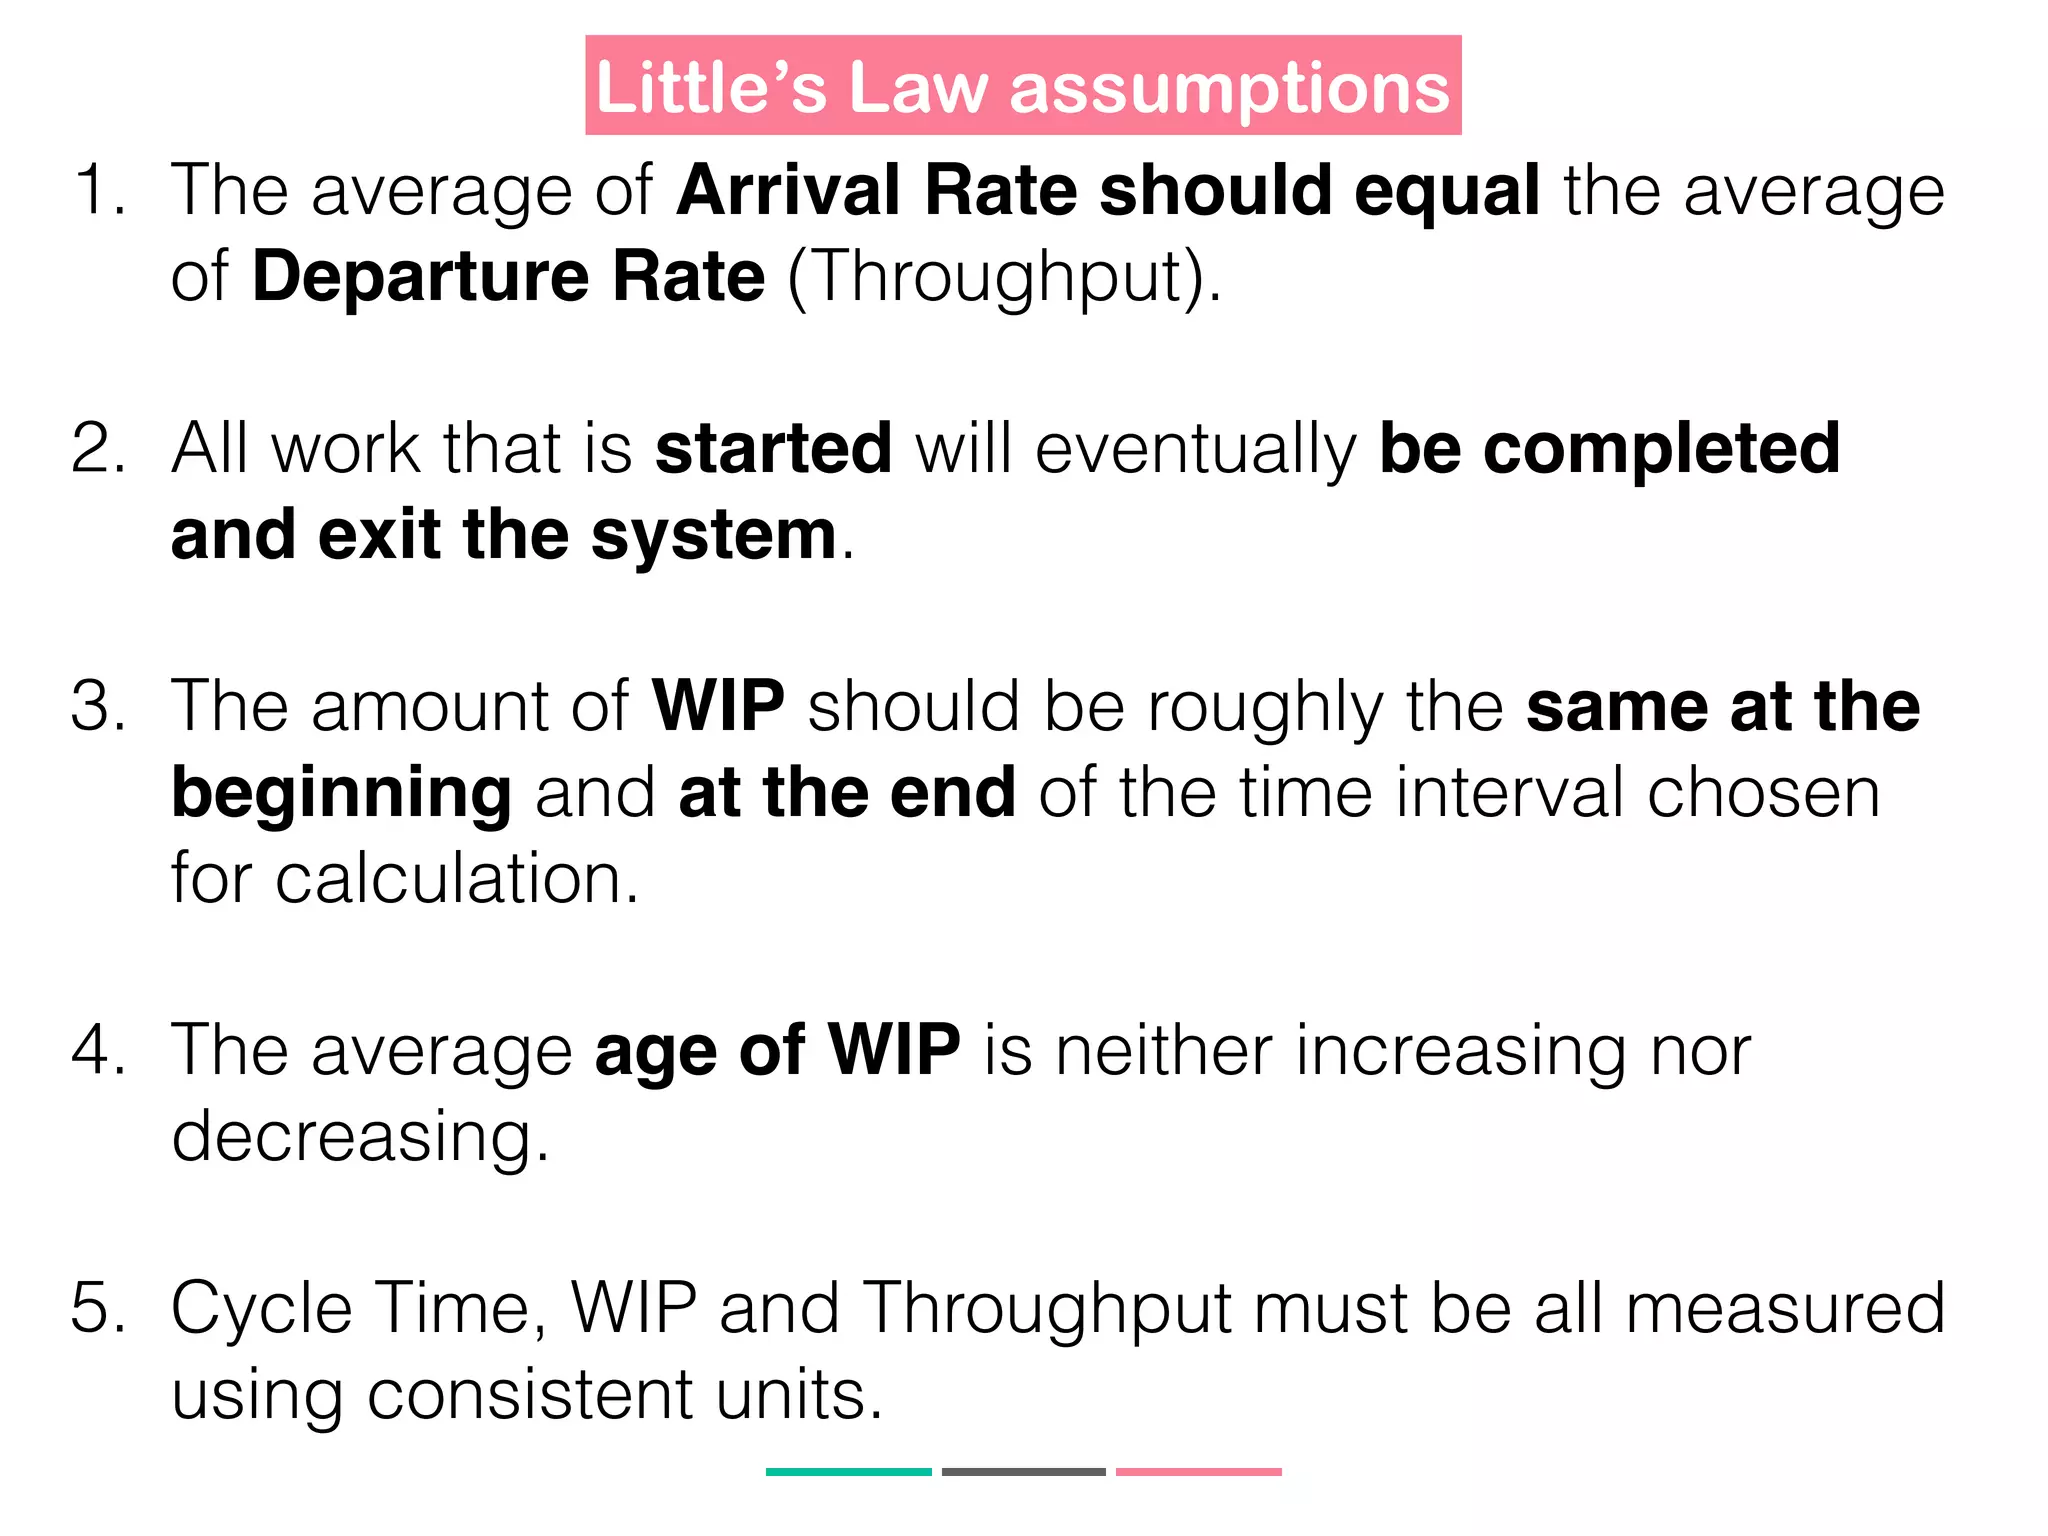
Download as PDF, PPTX


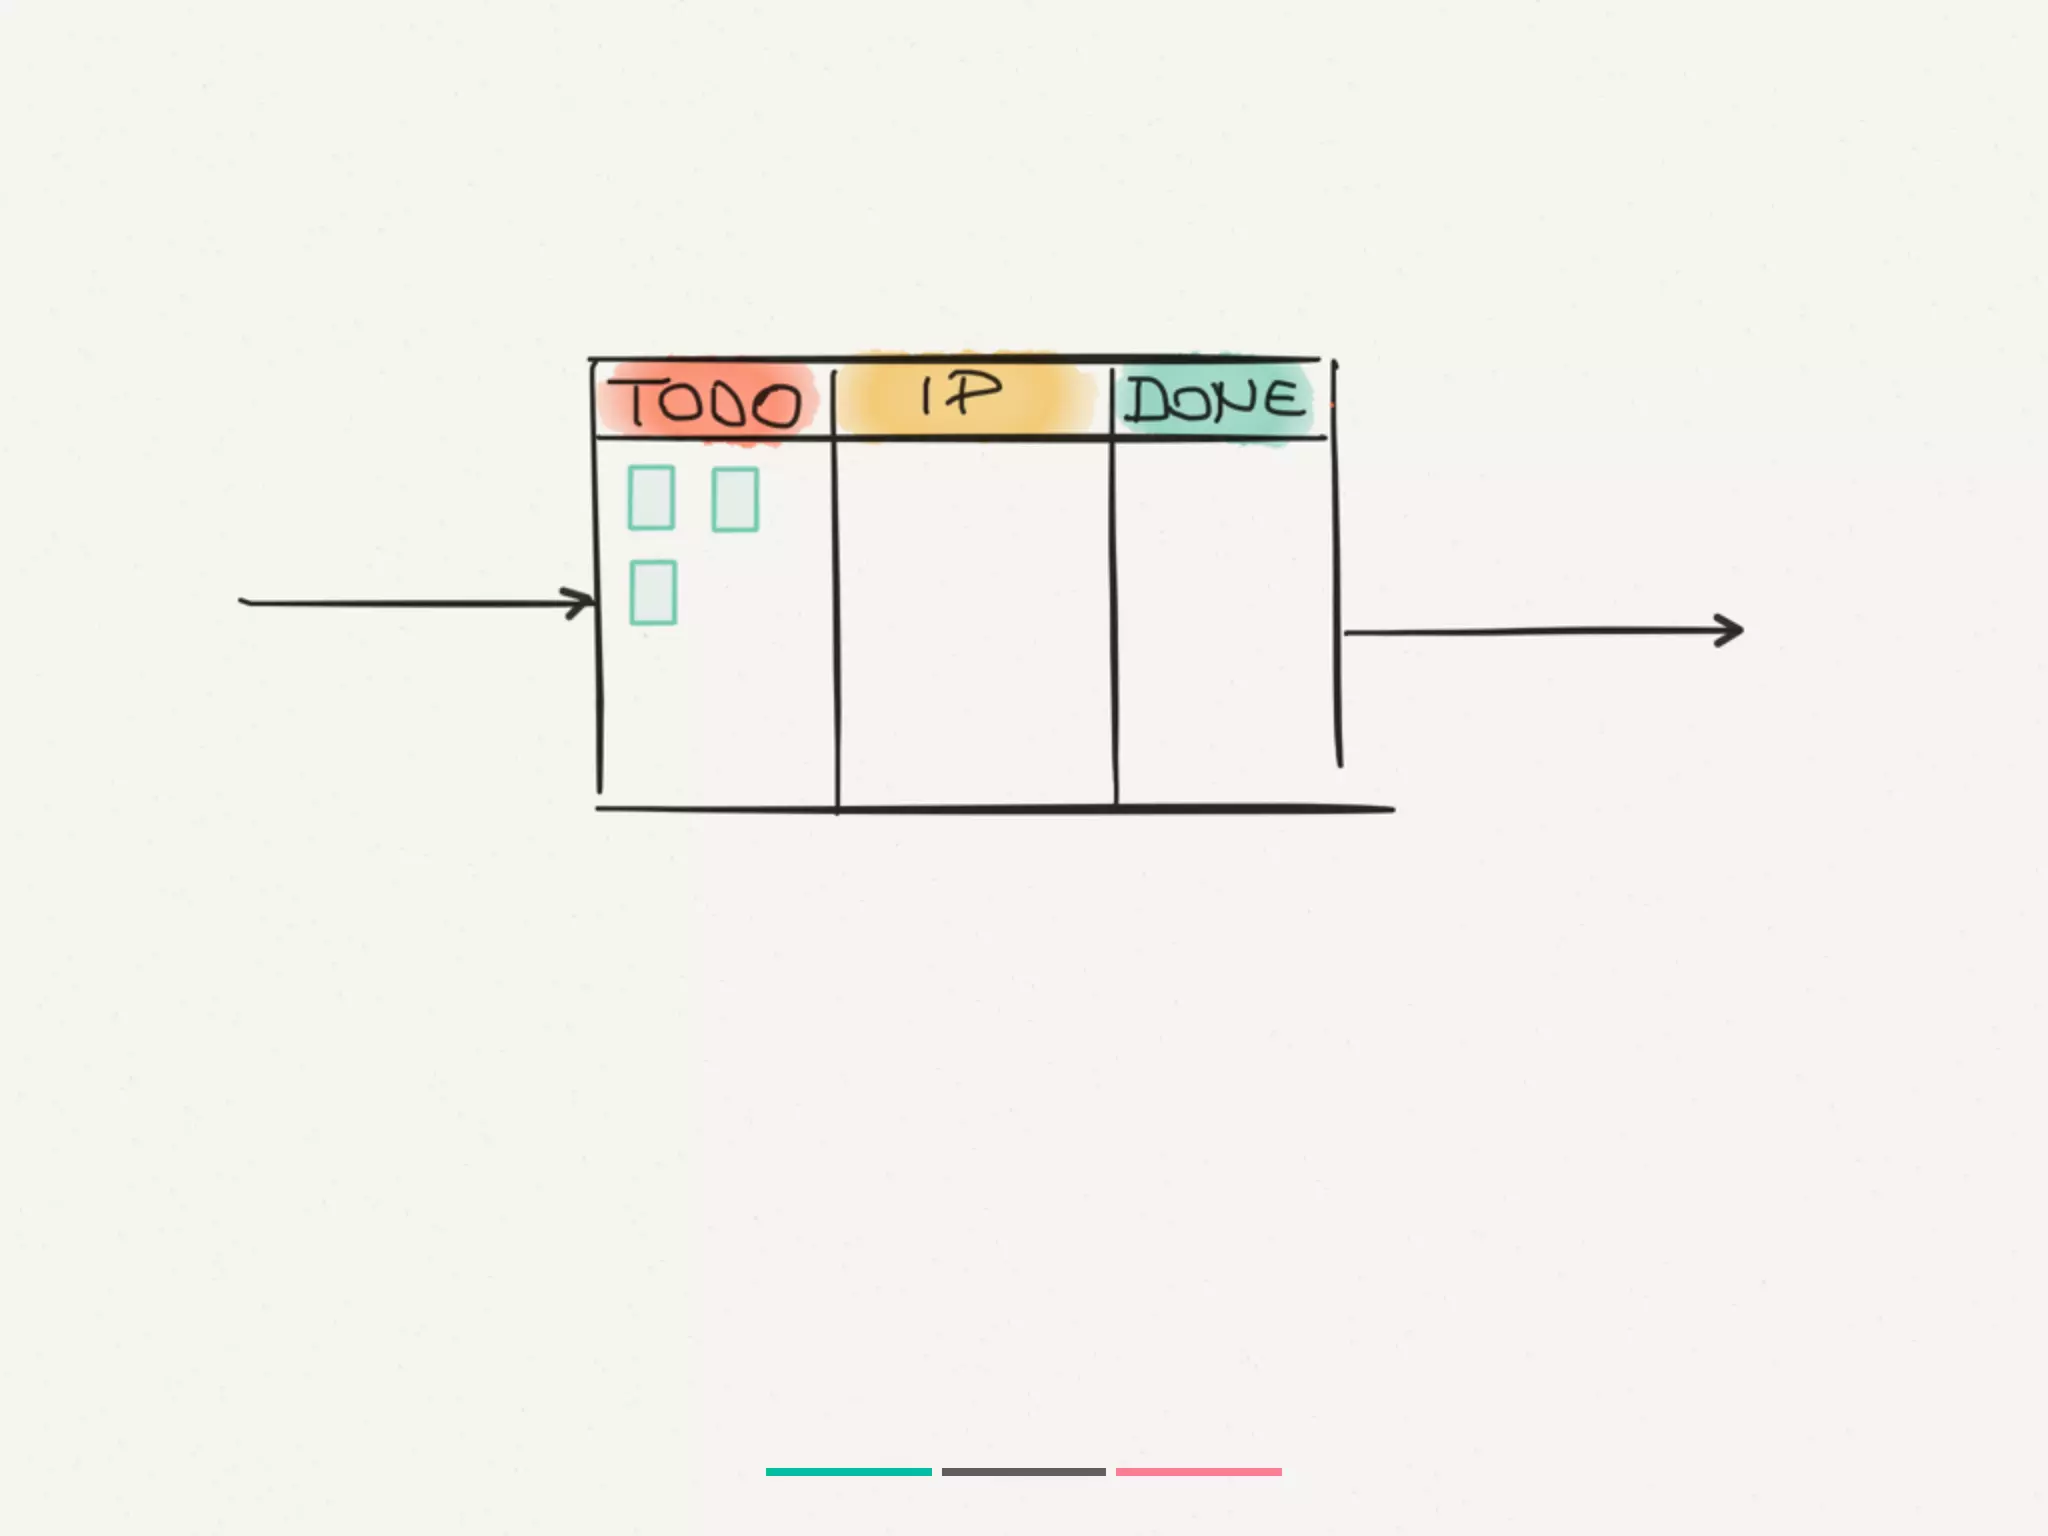
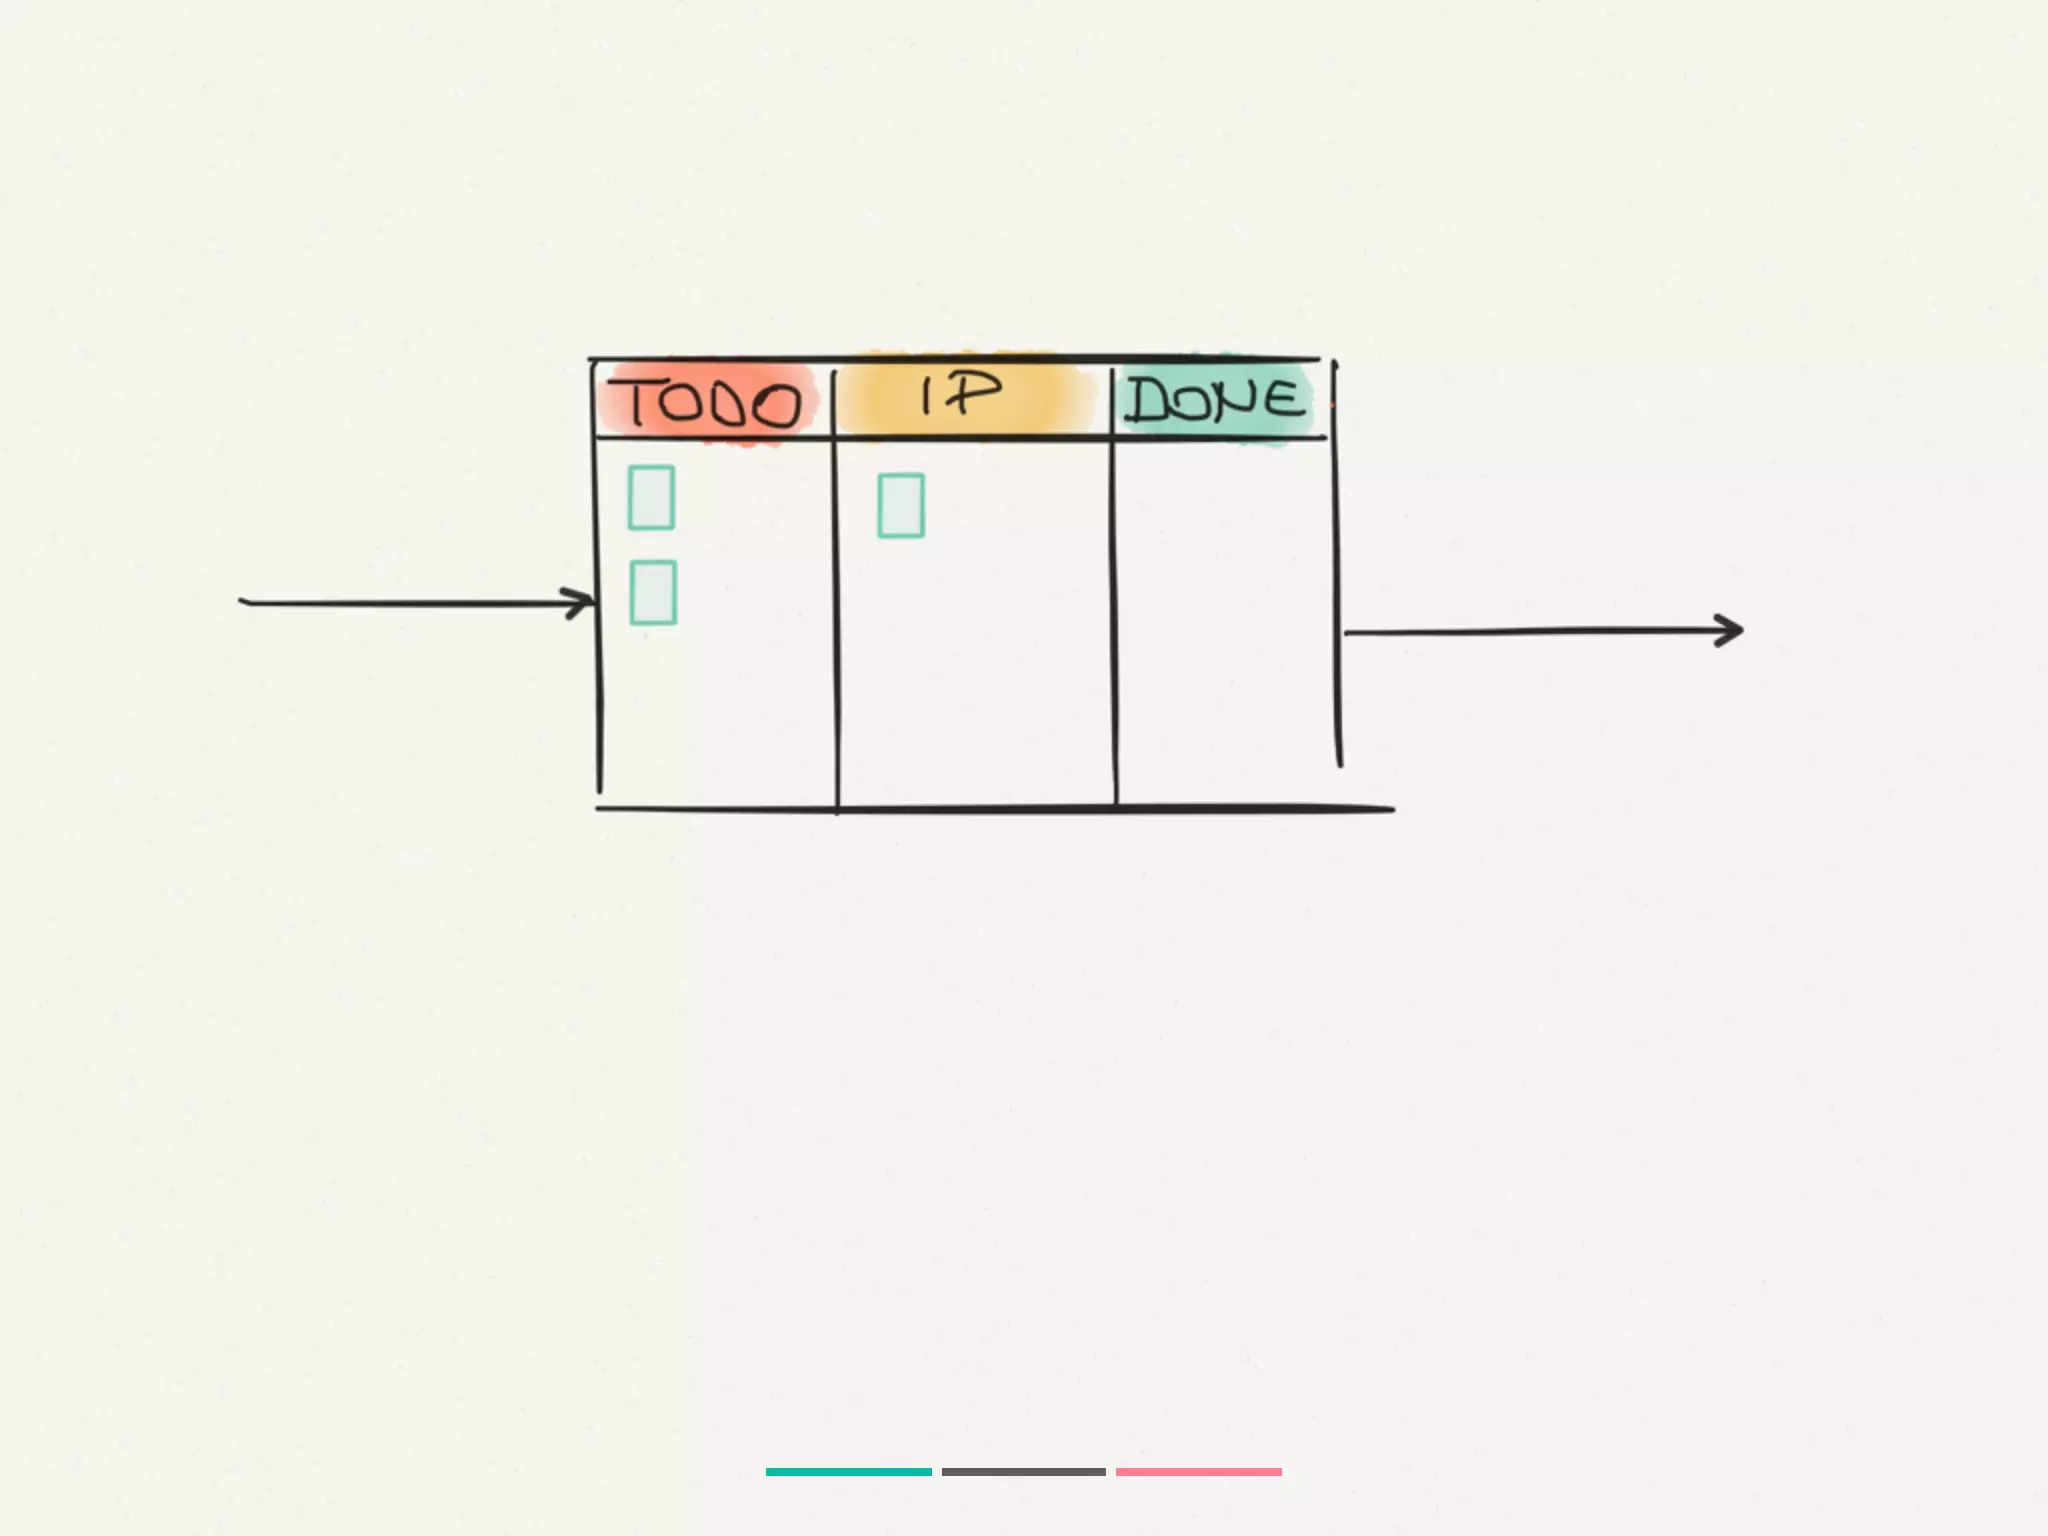
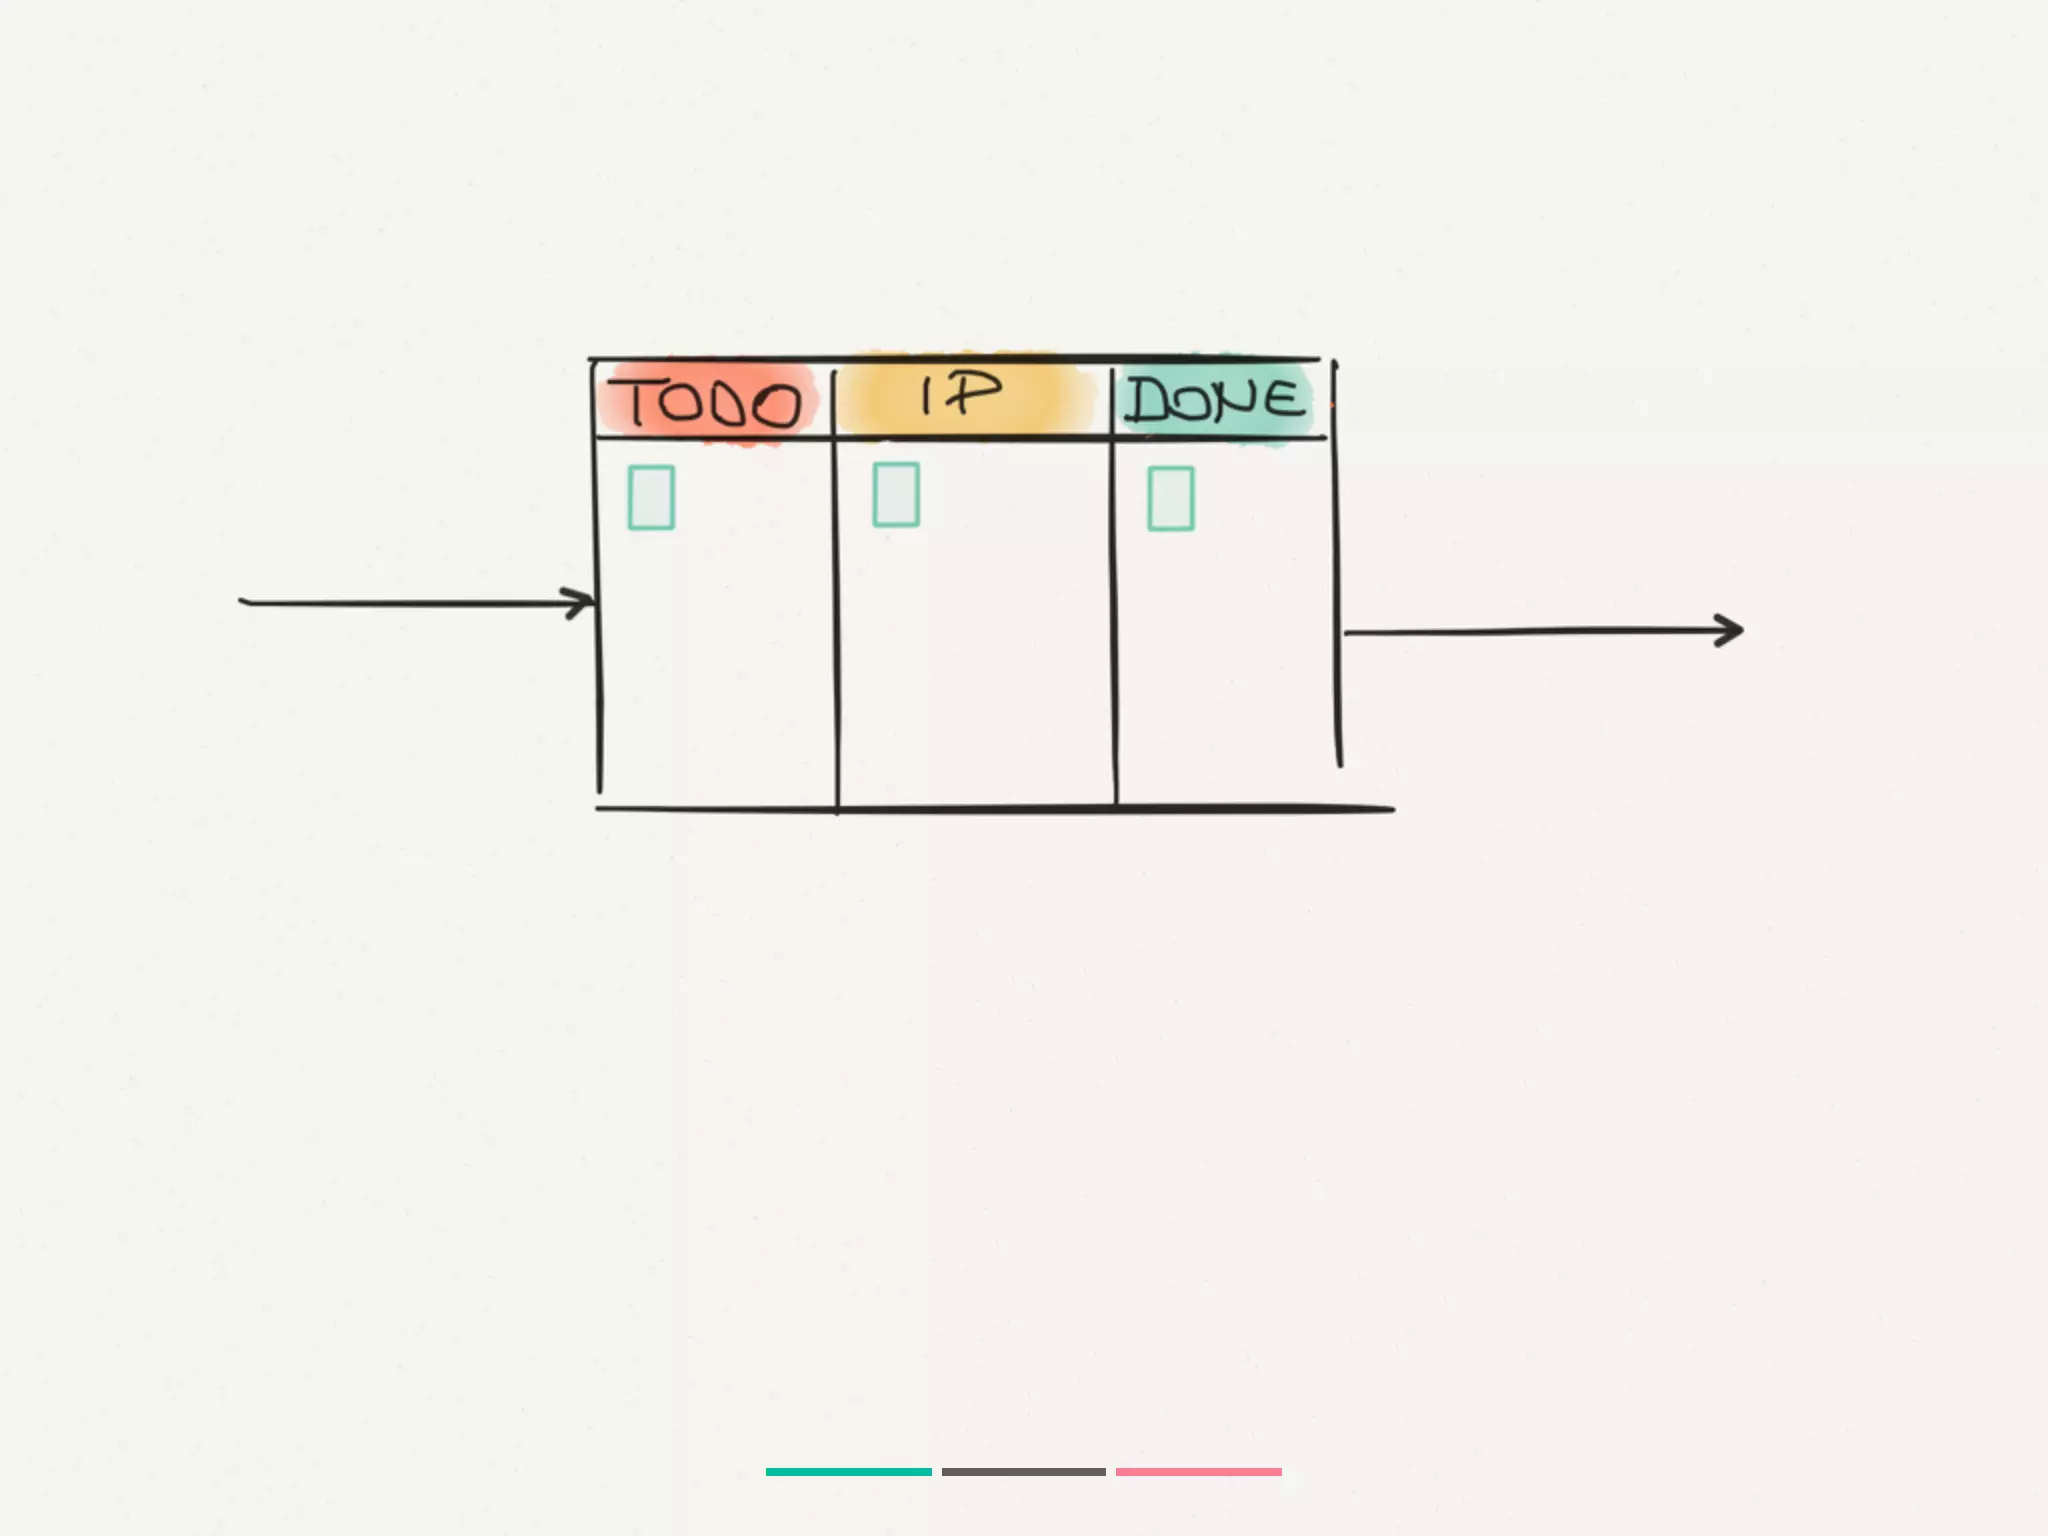
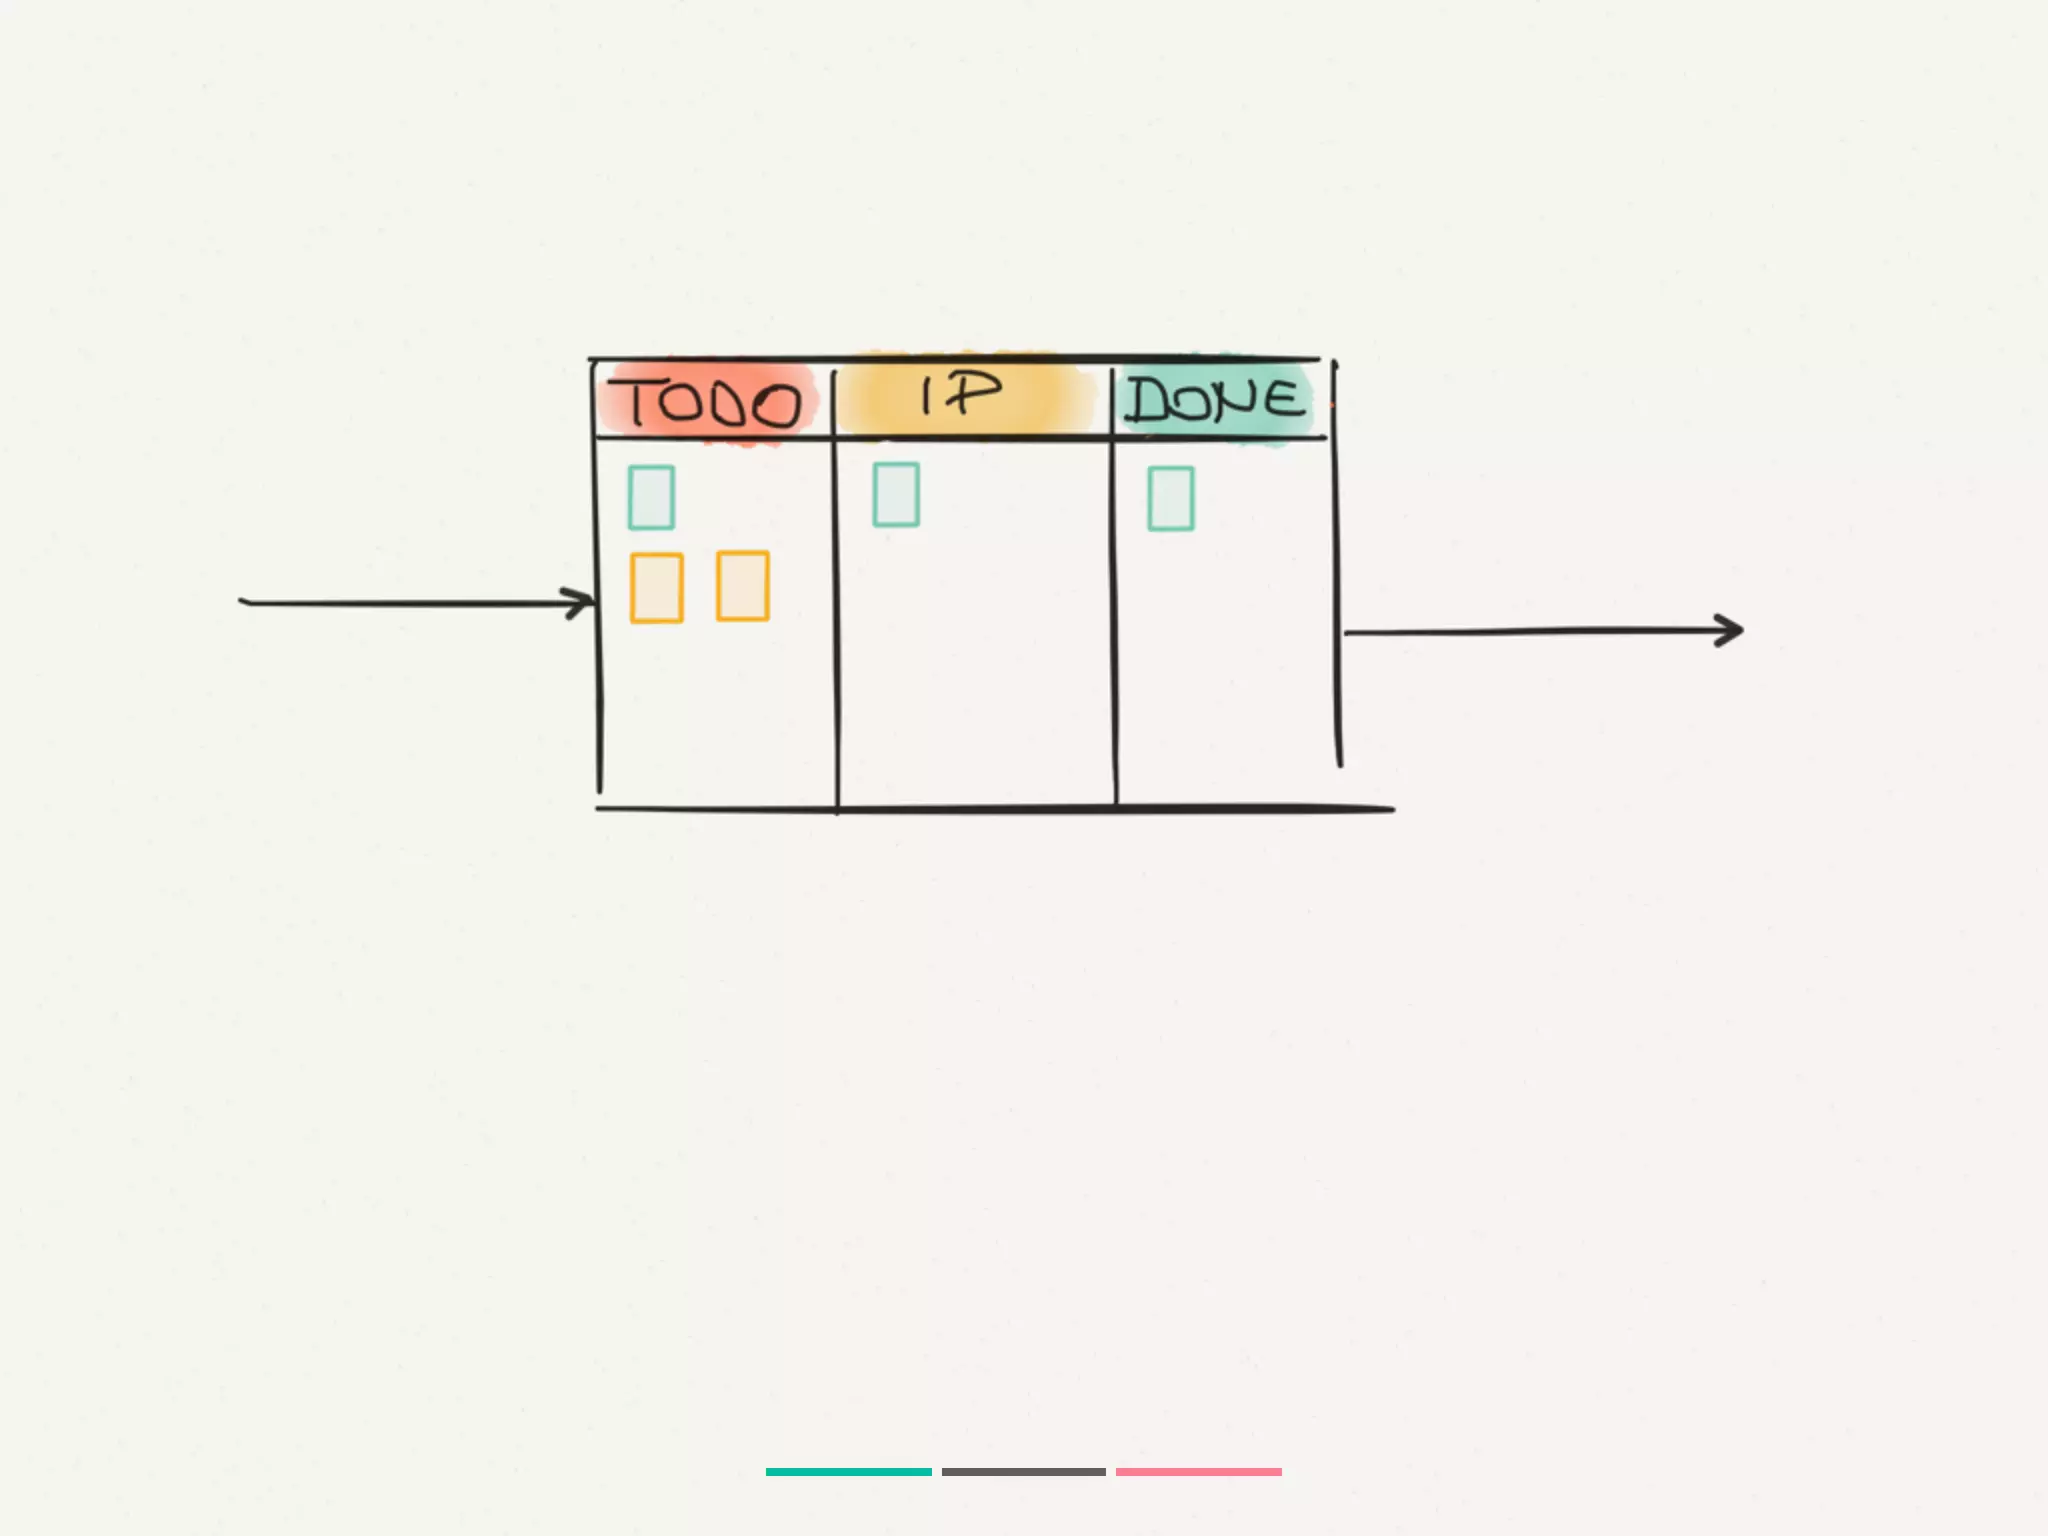


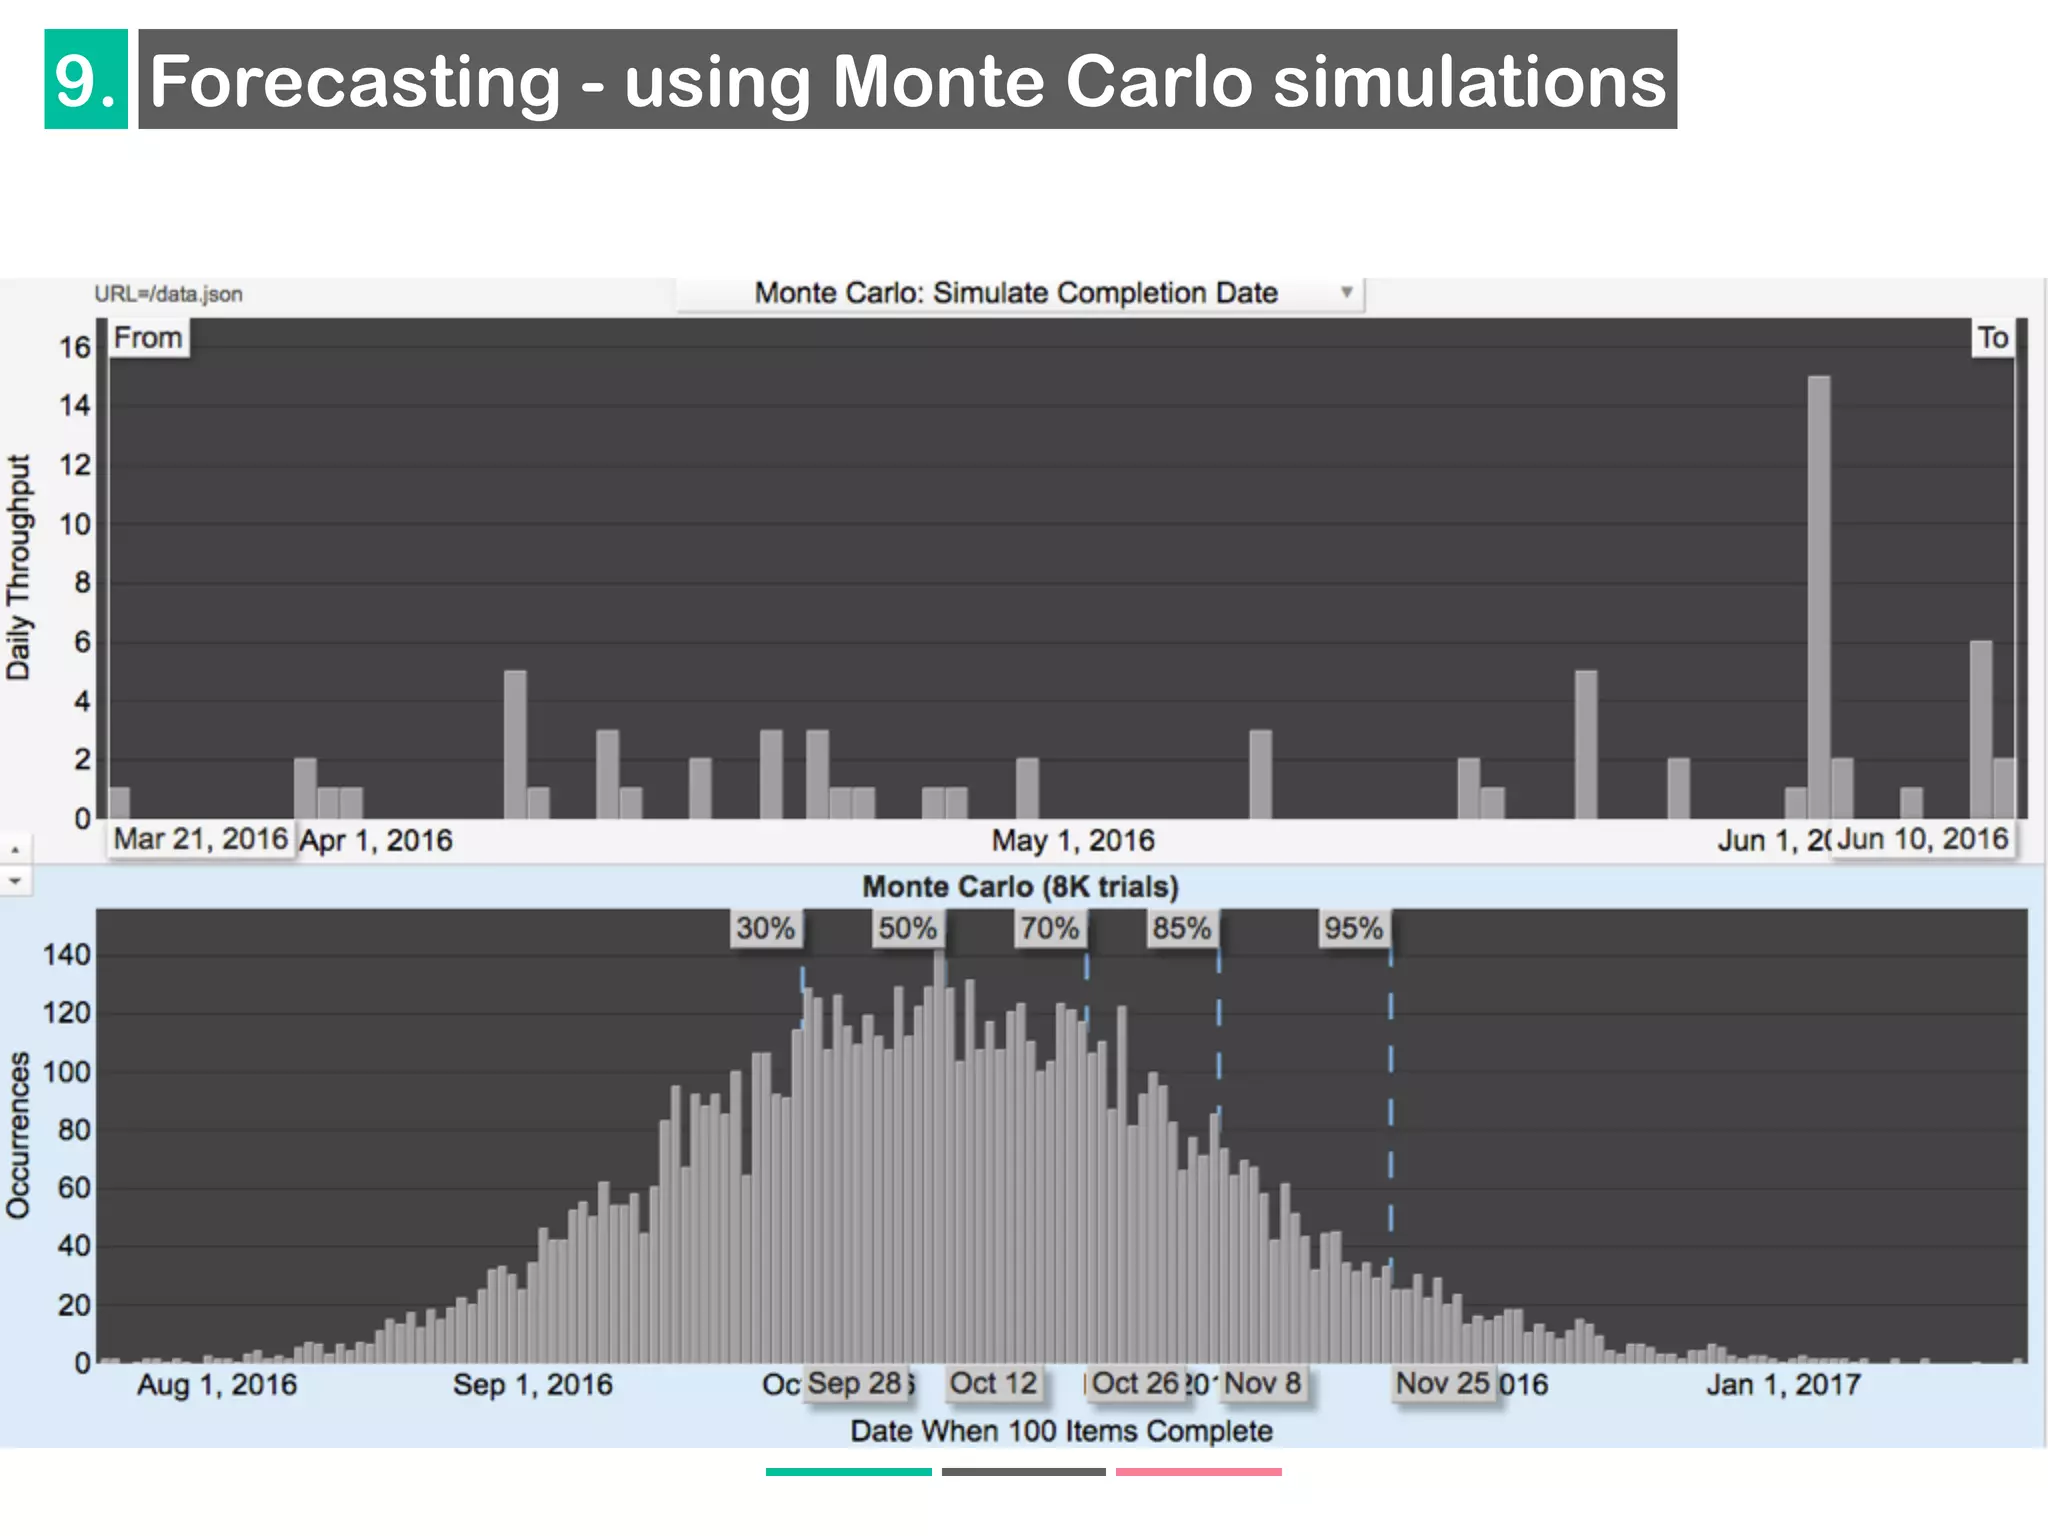
![MC Simulation
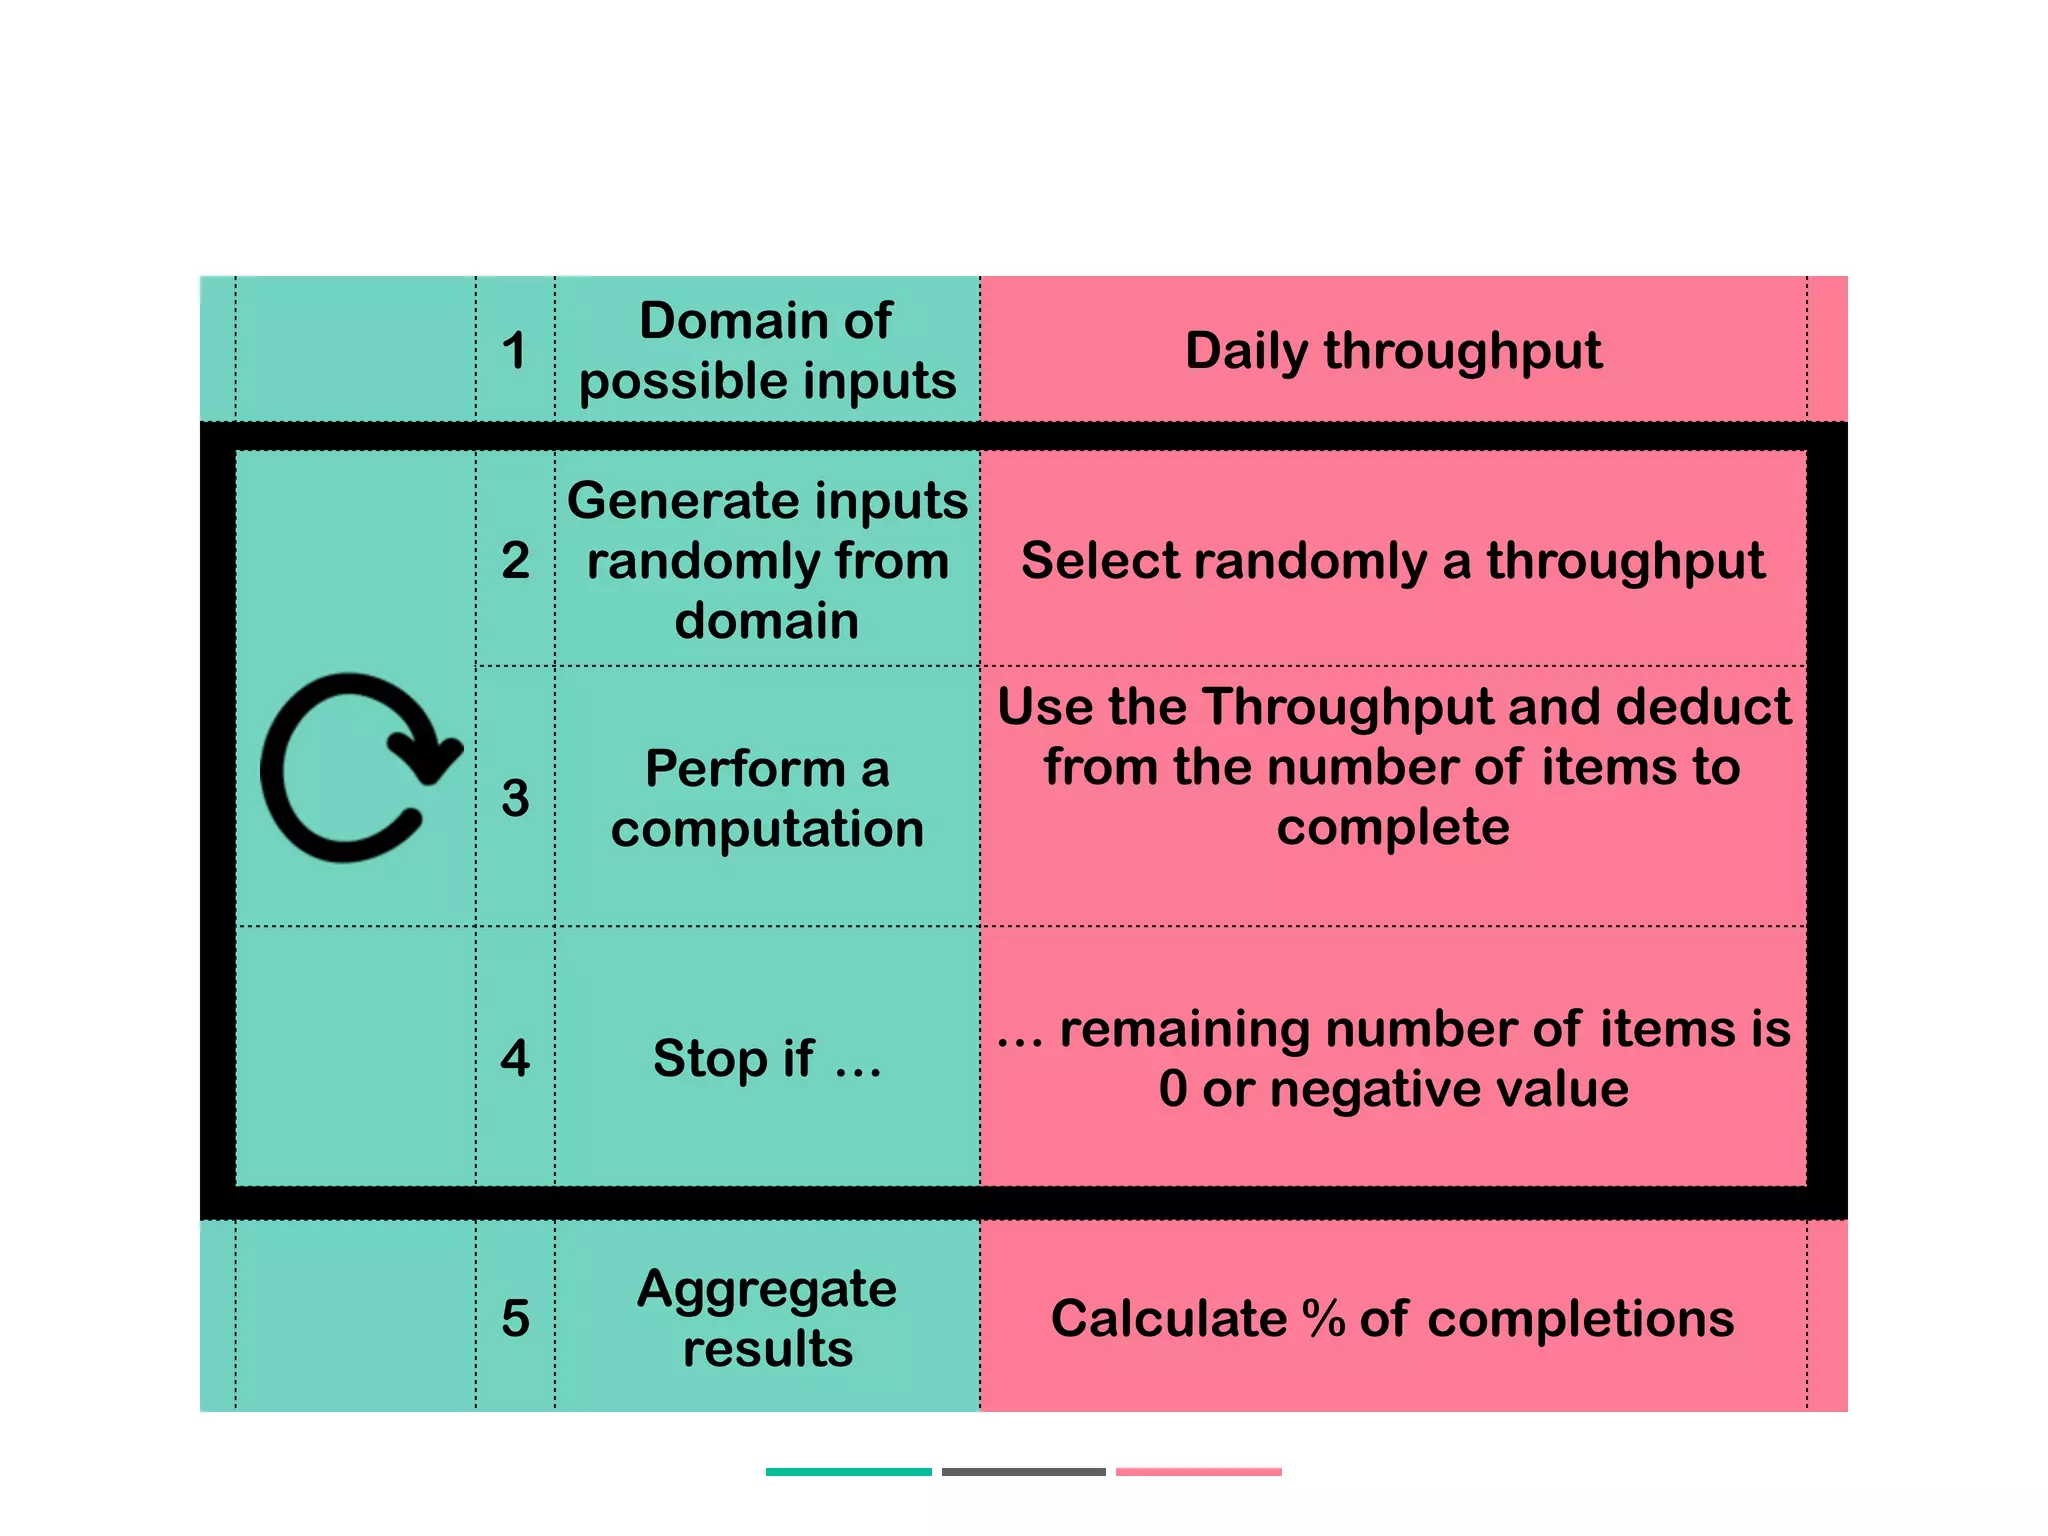
- Define domain of possible inputs
- Generate inputs randomly from domain
- Perform a computation
- Aggregate result
[source: Wikipedia]
Statistical sampling based simulation](https://image.slidesharecdn.com/actionable-metrics-v6-manchester-conf-compact-170512071104/75/From-Scrum-to-flow-using-actionable-agile-metrics-78-2048.jpg)
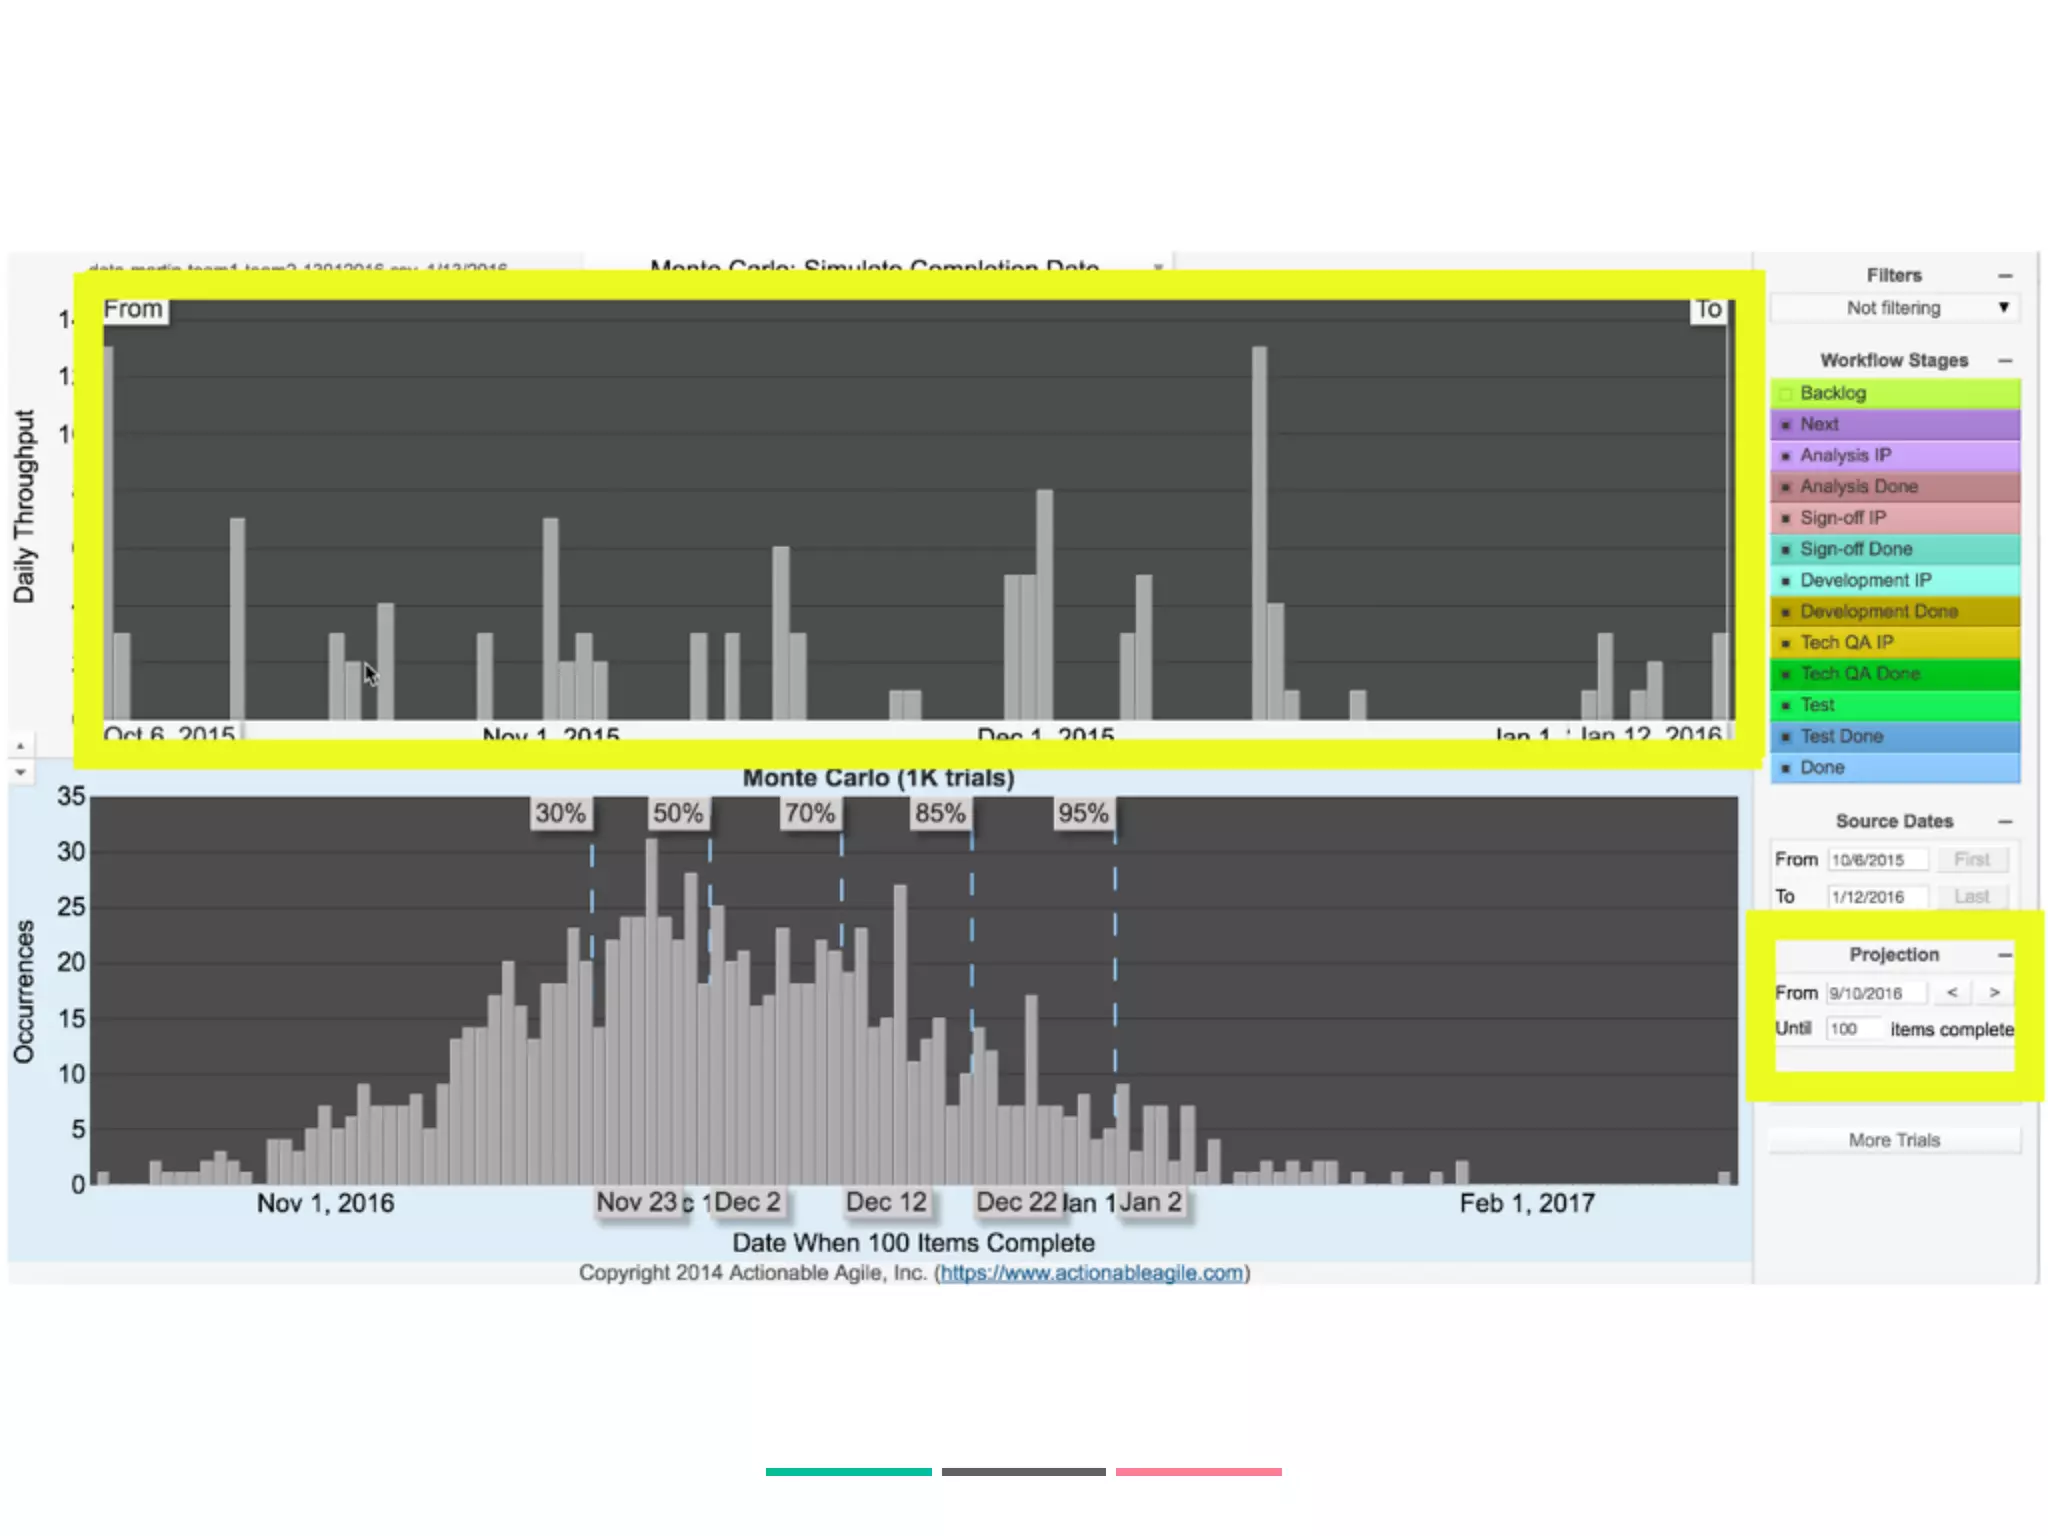
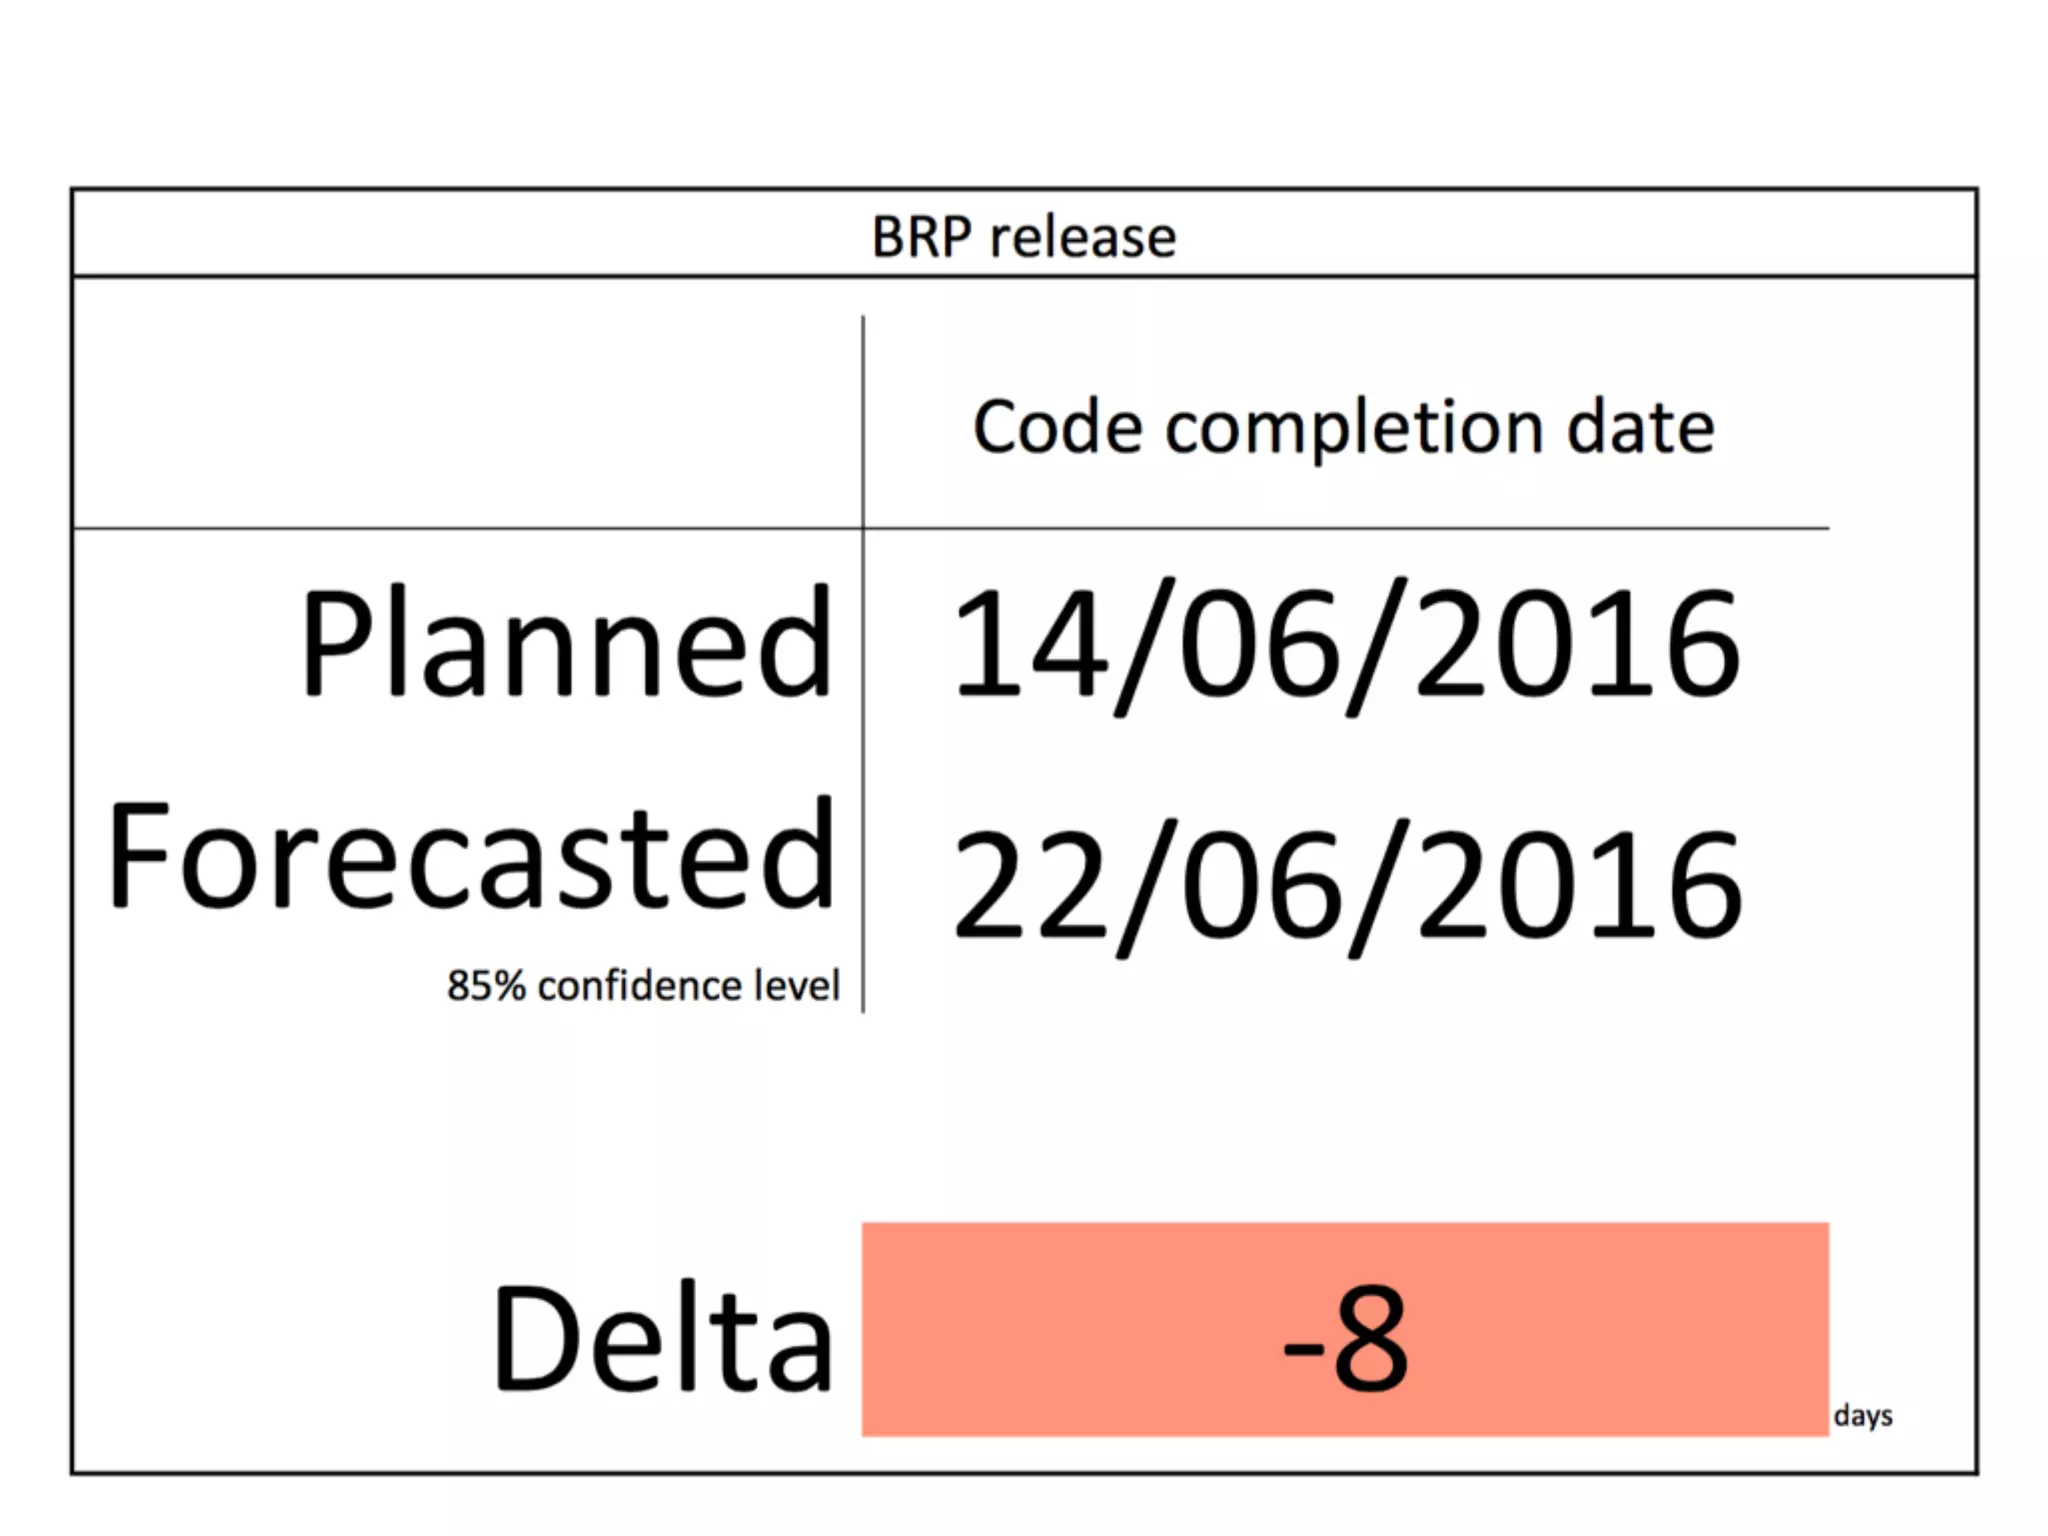

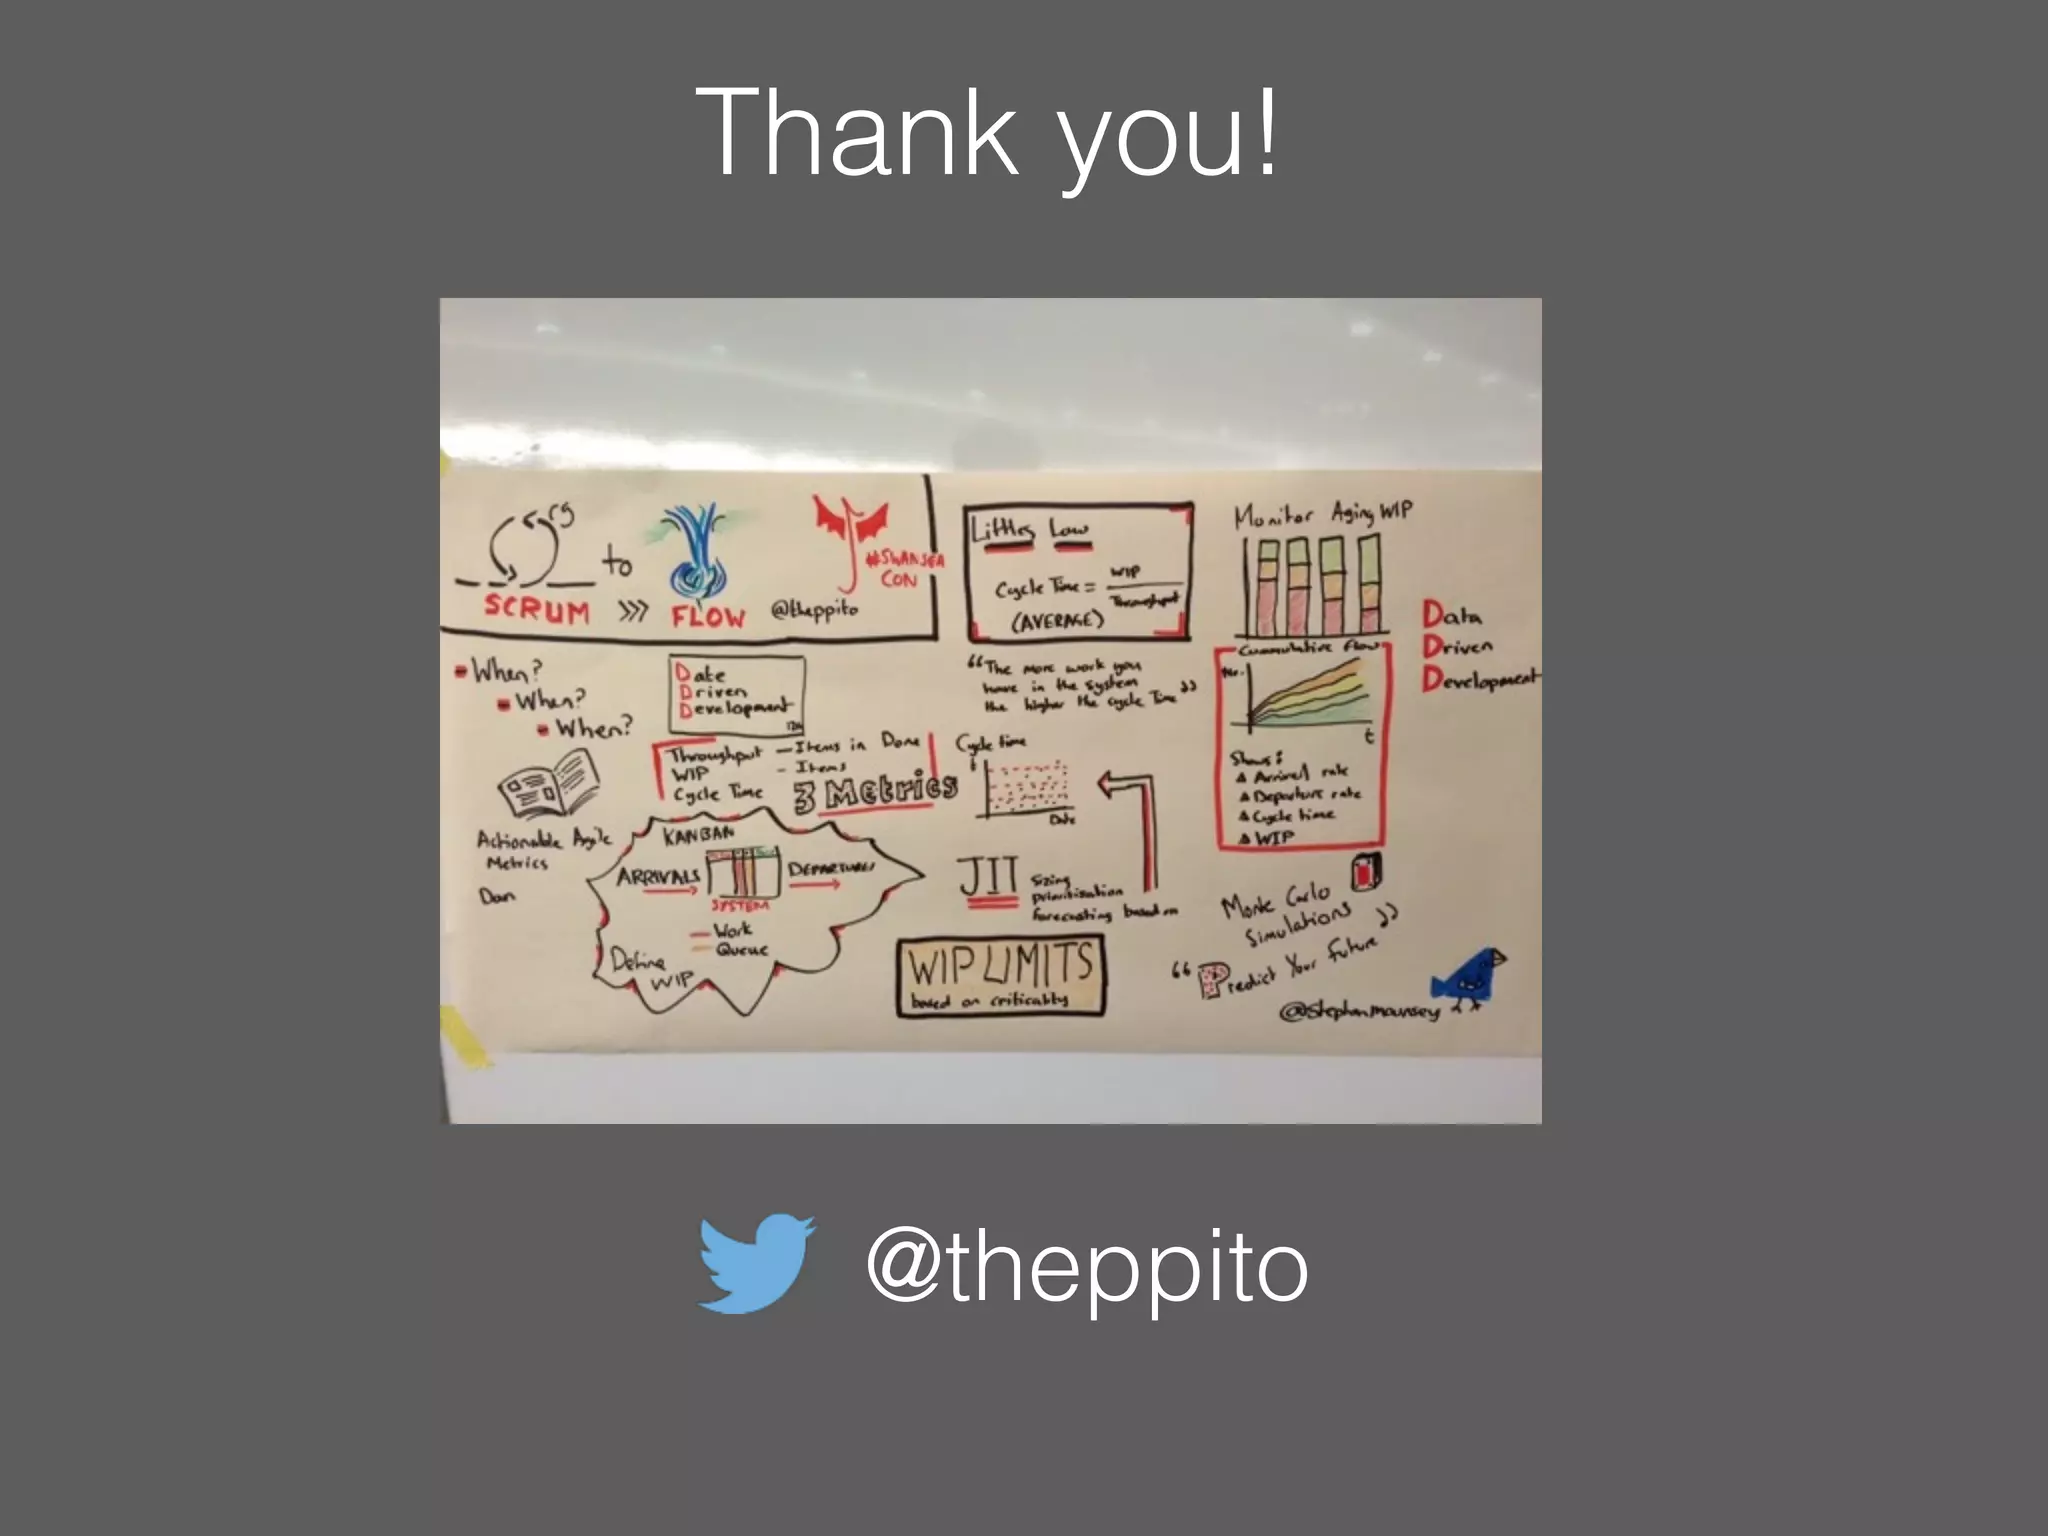

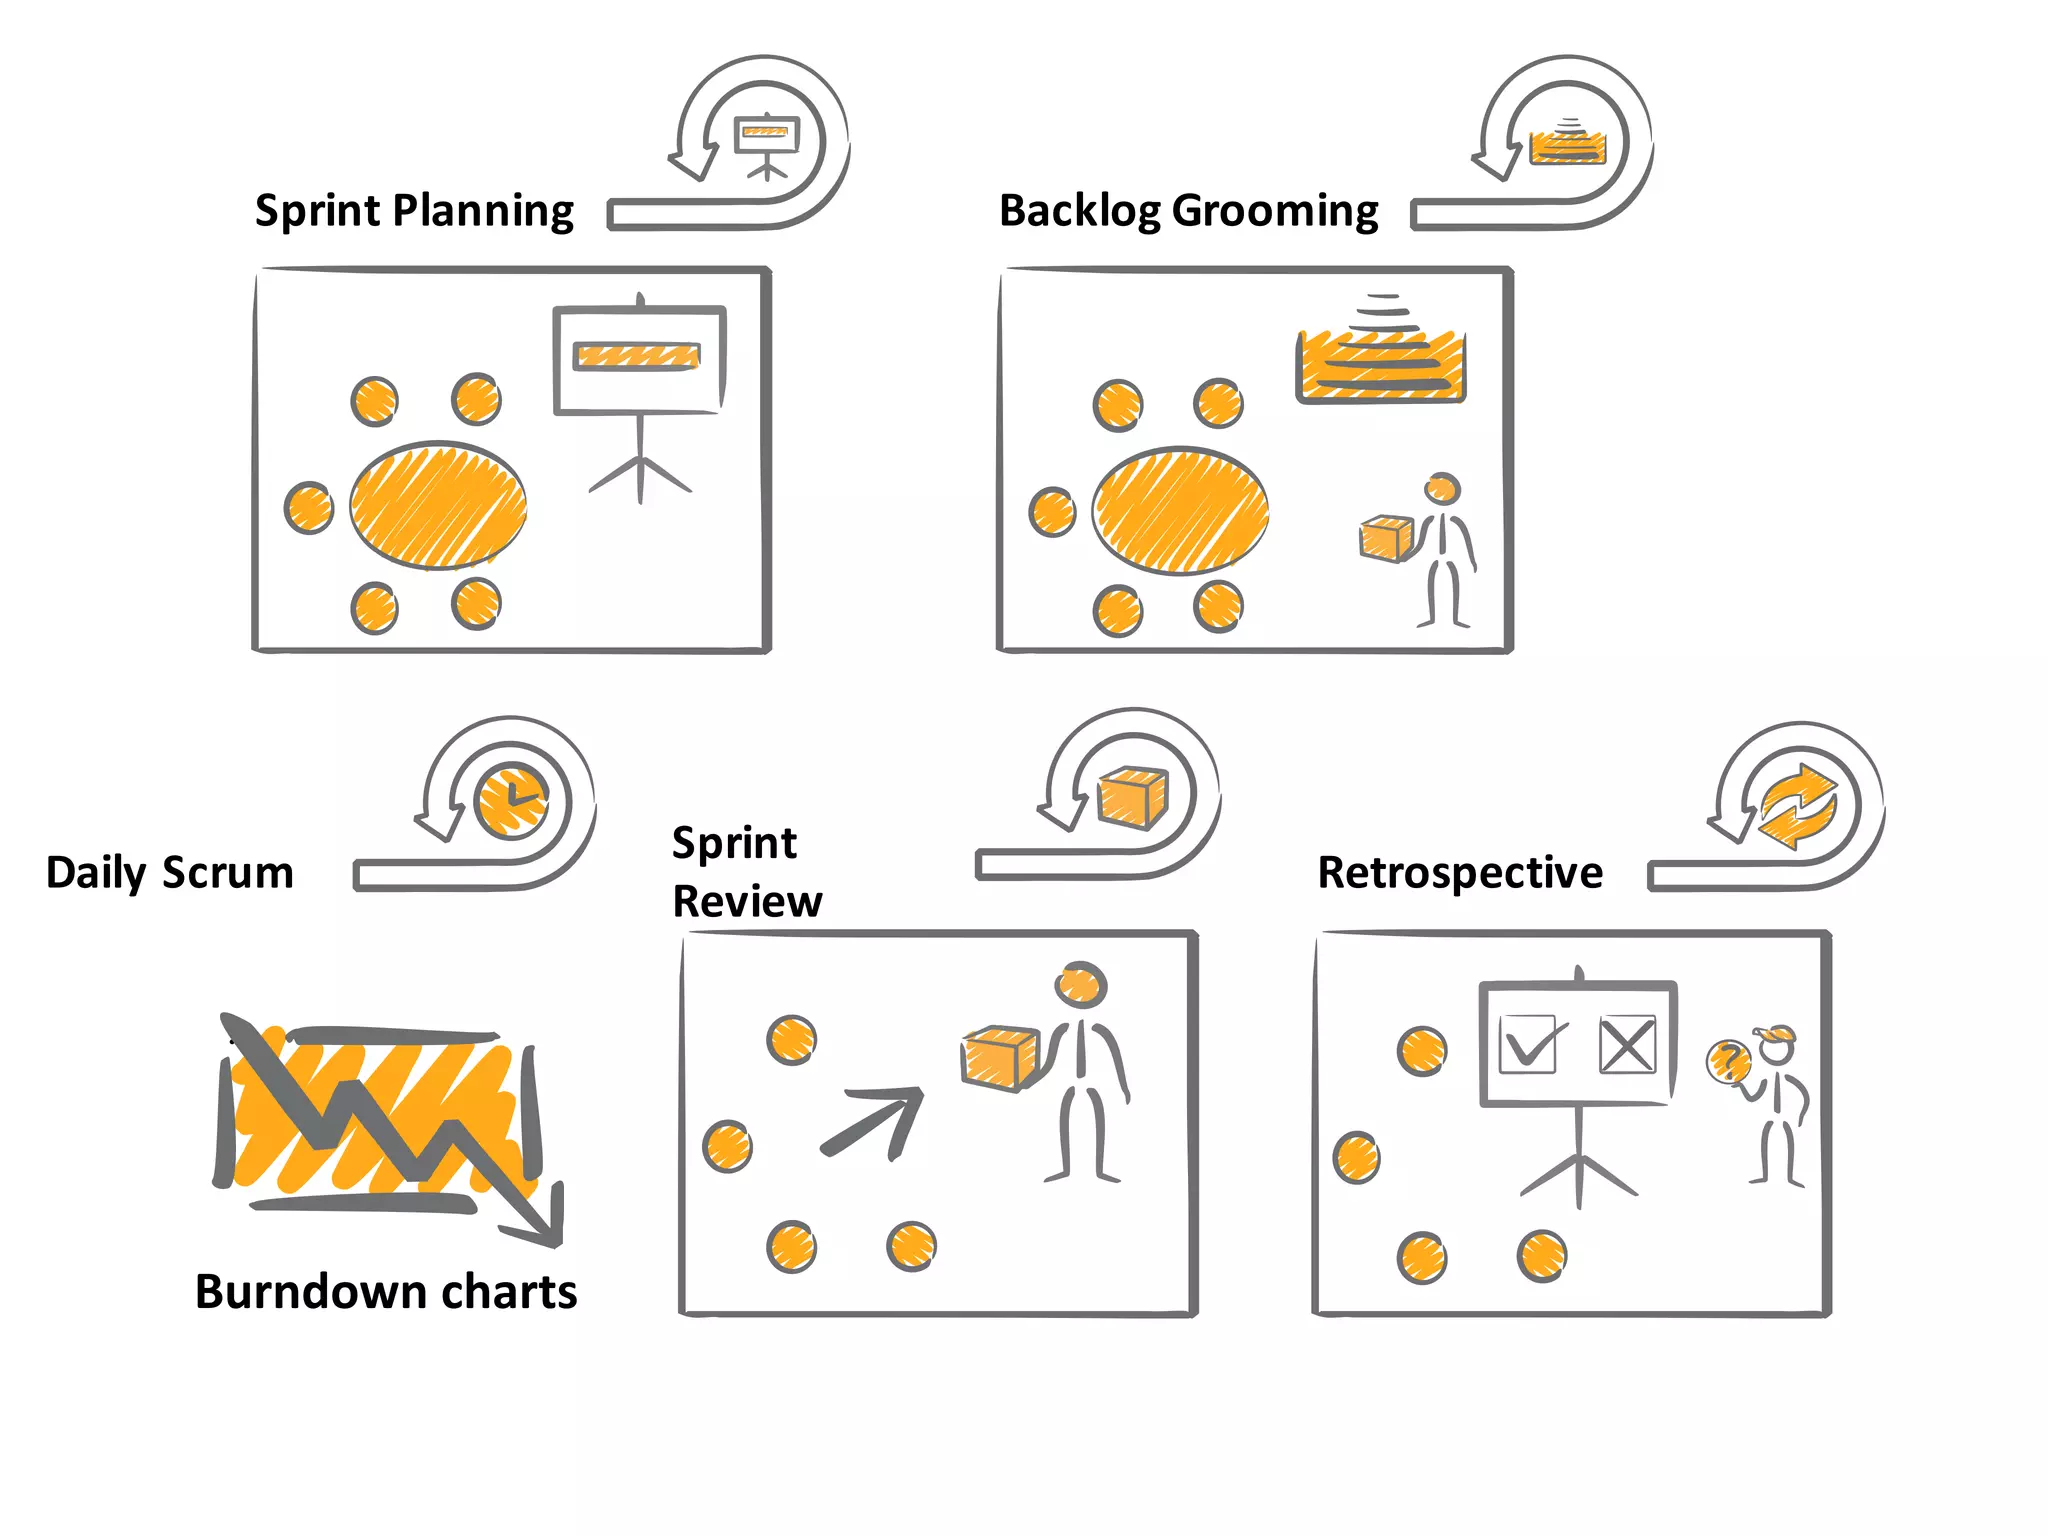
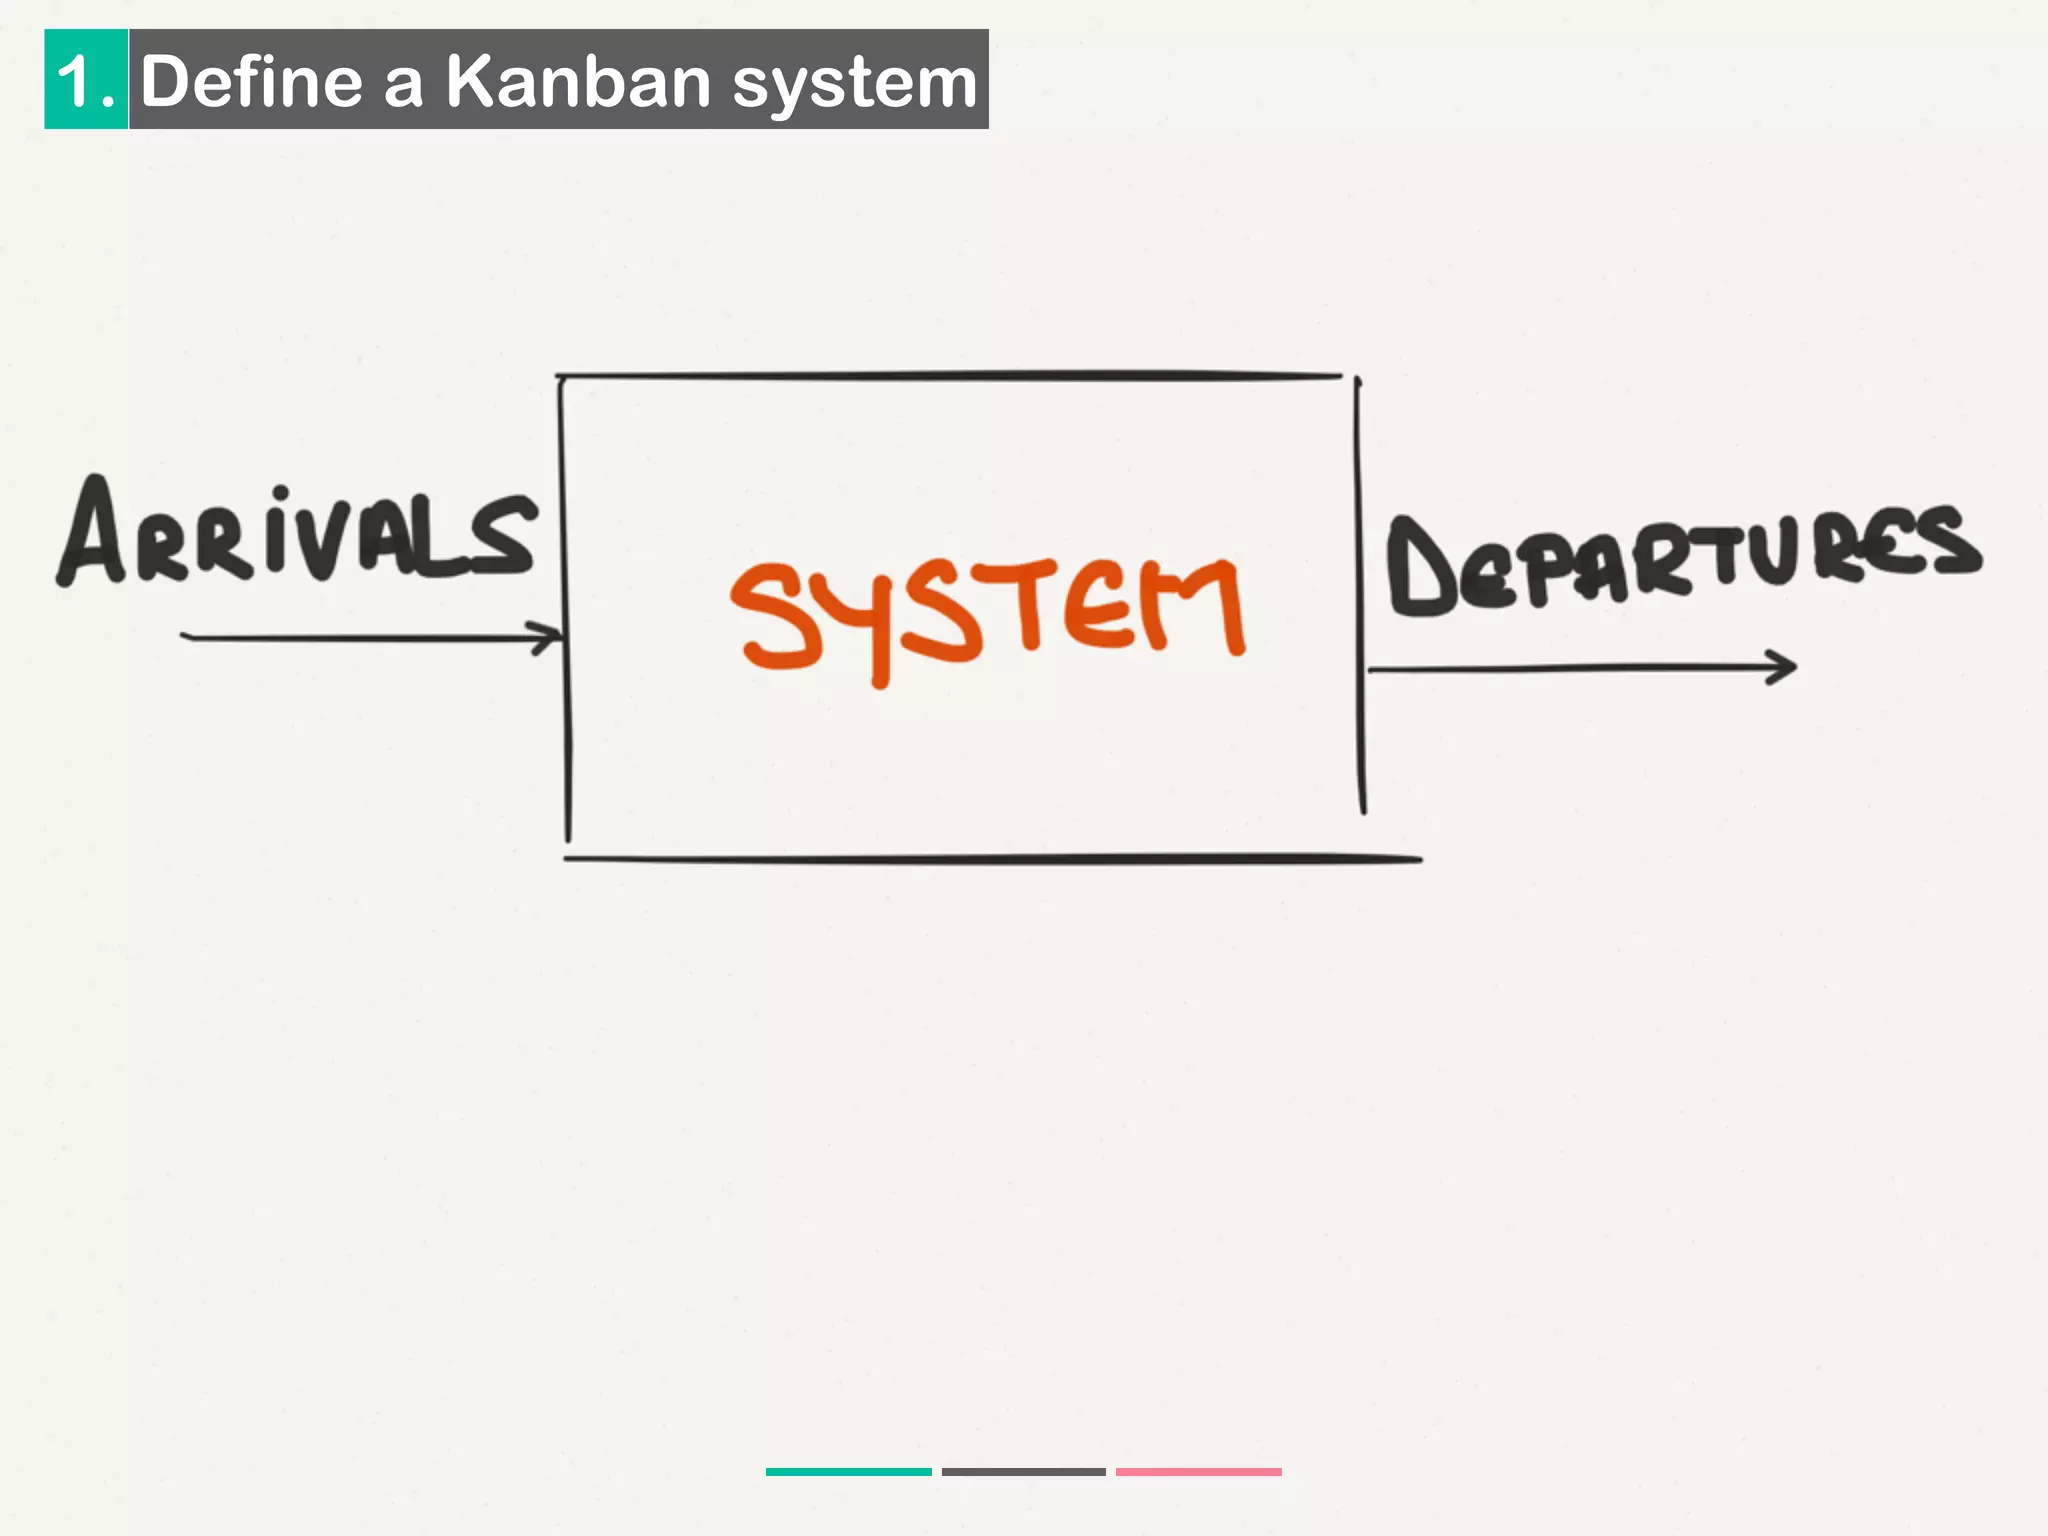
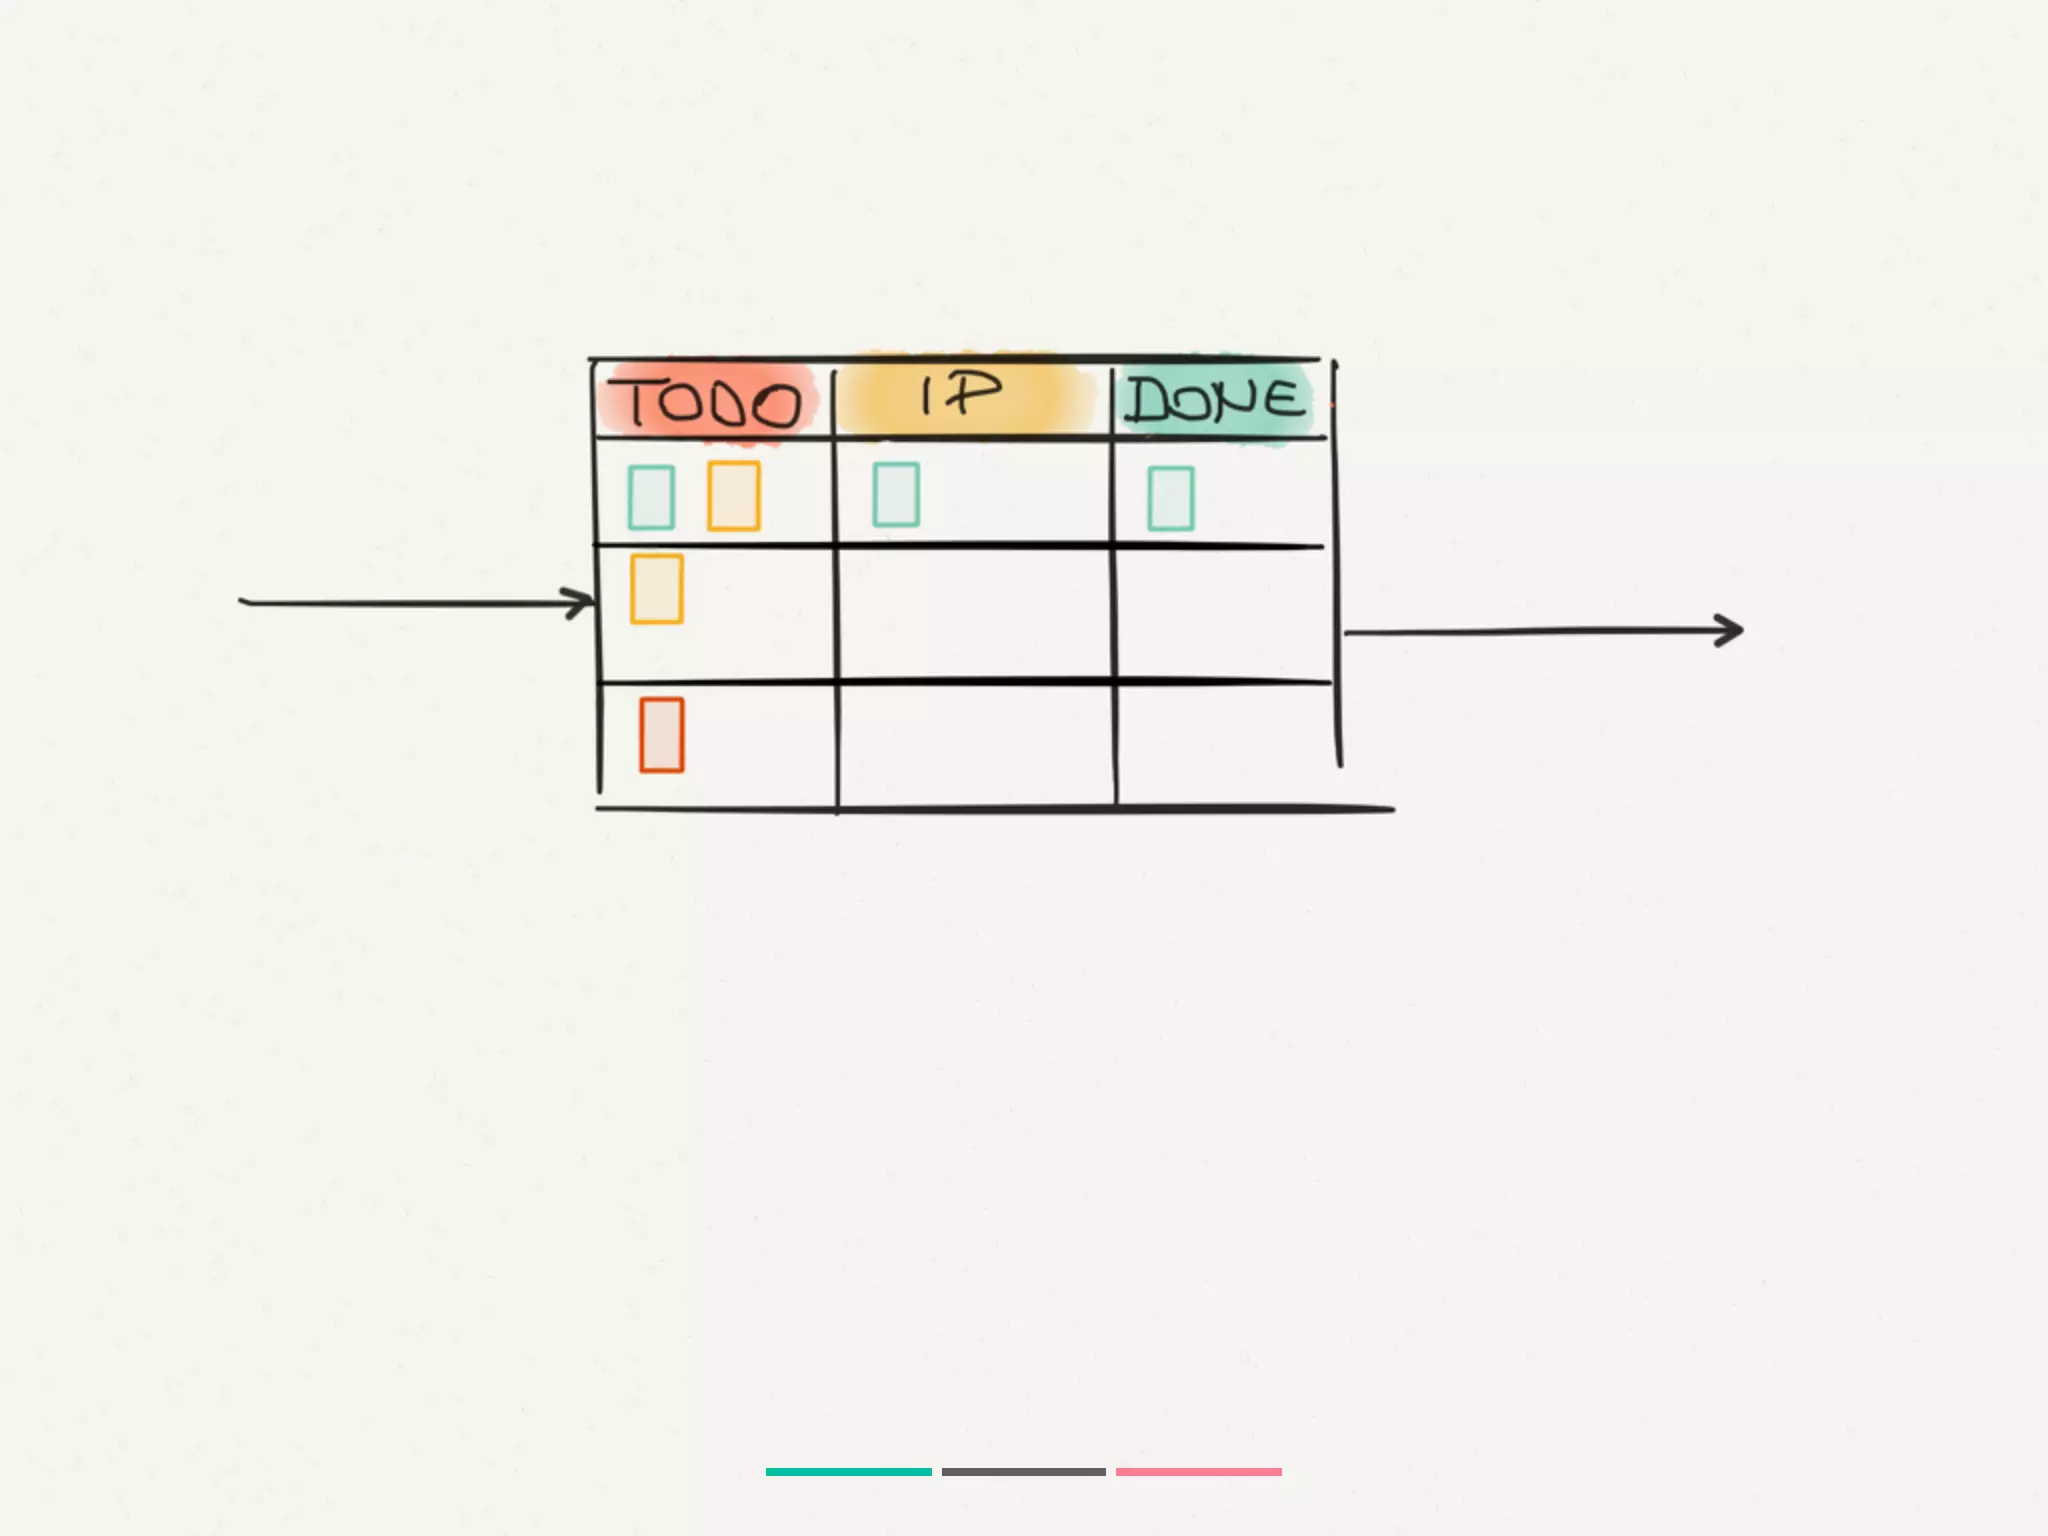
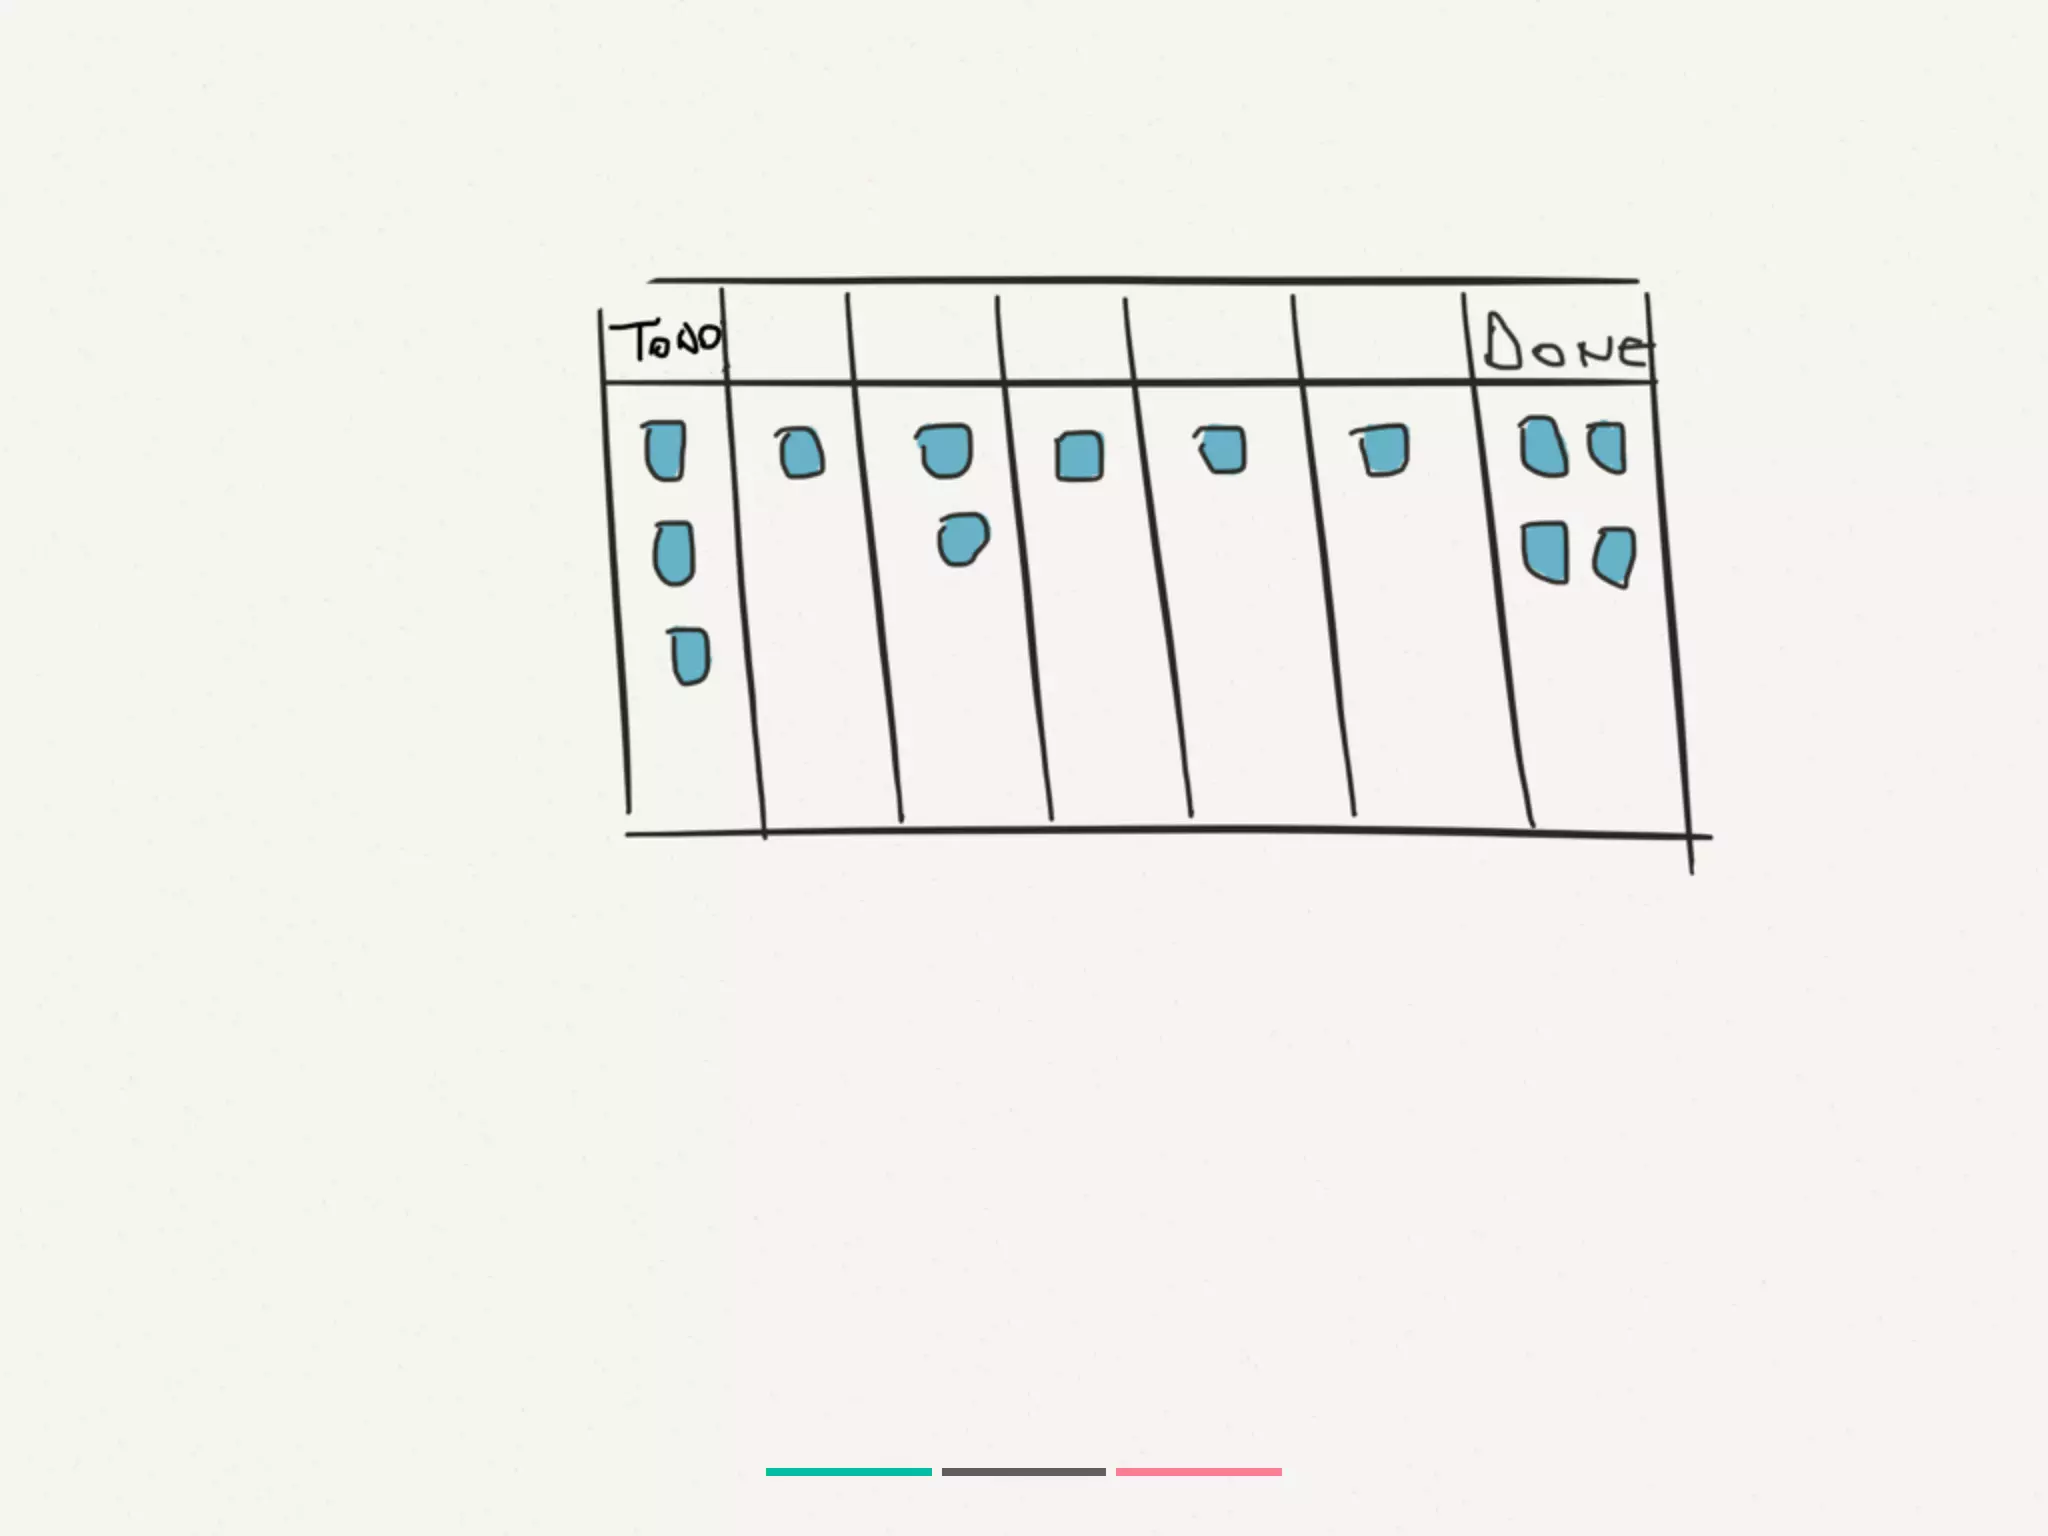
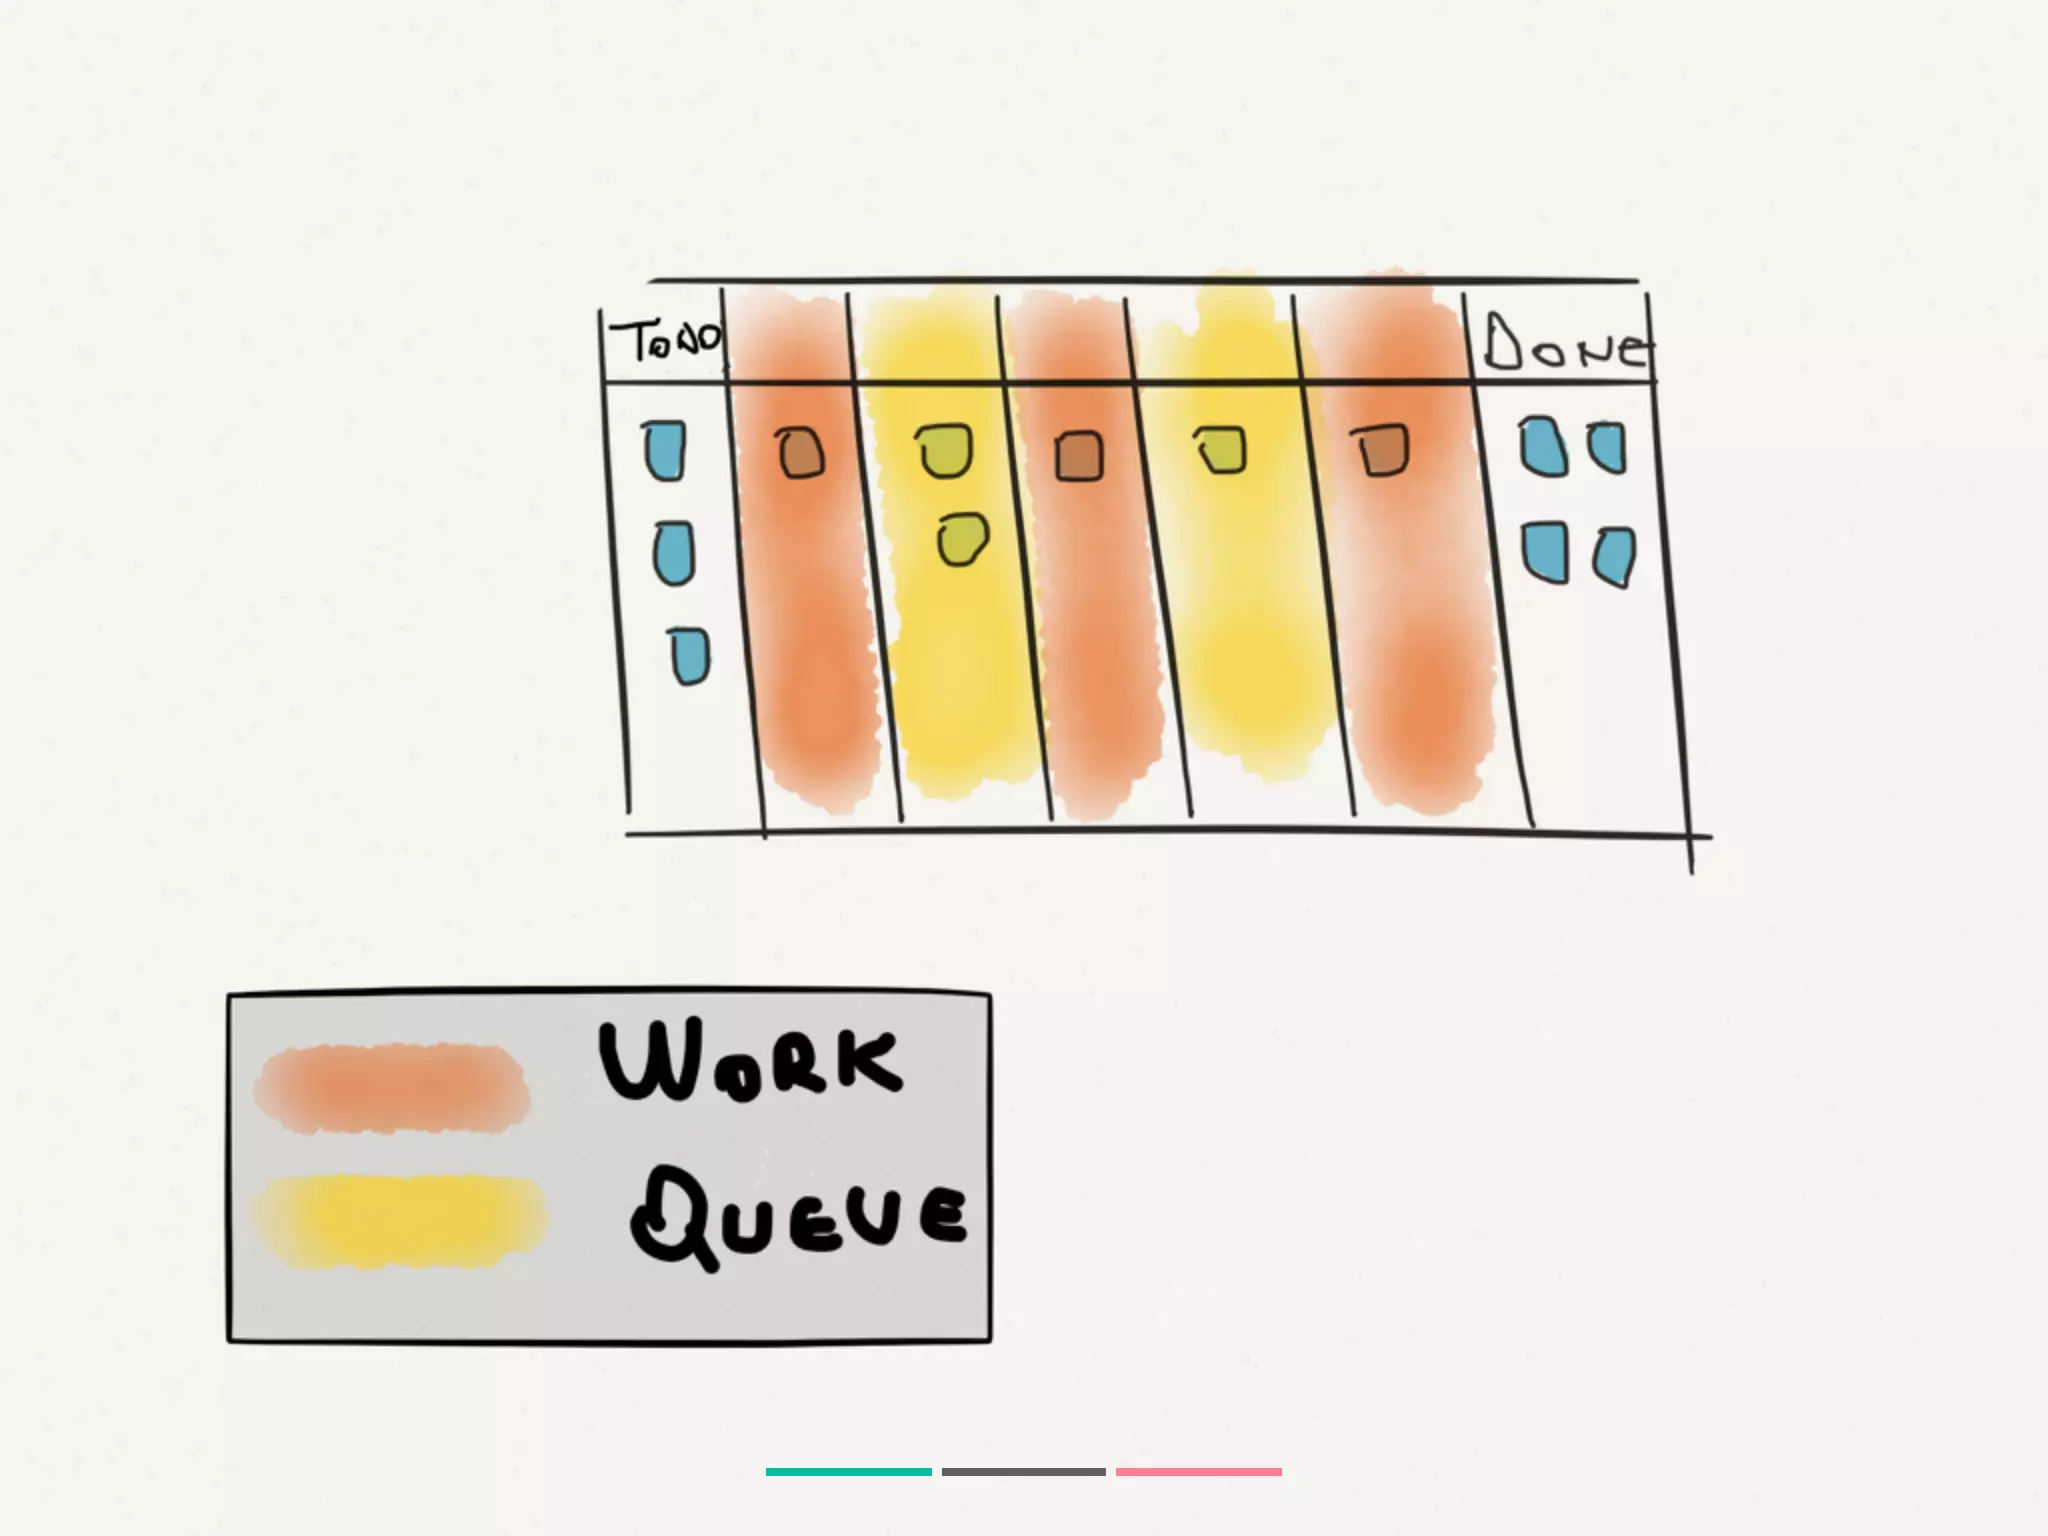
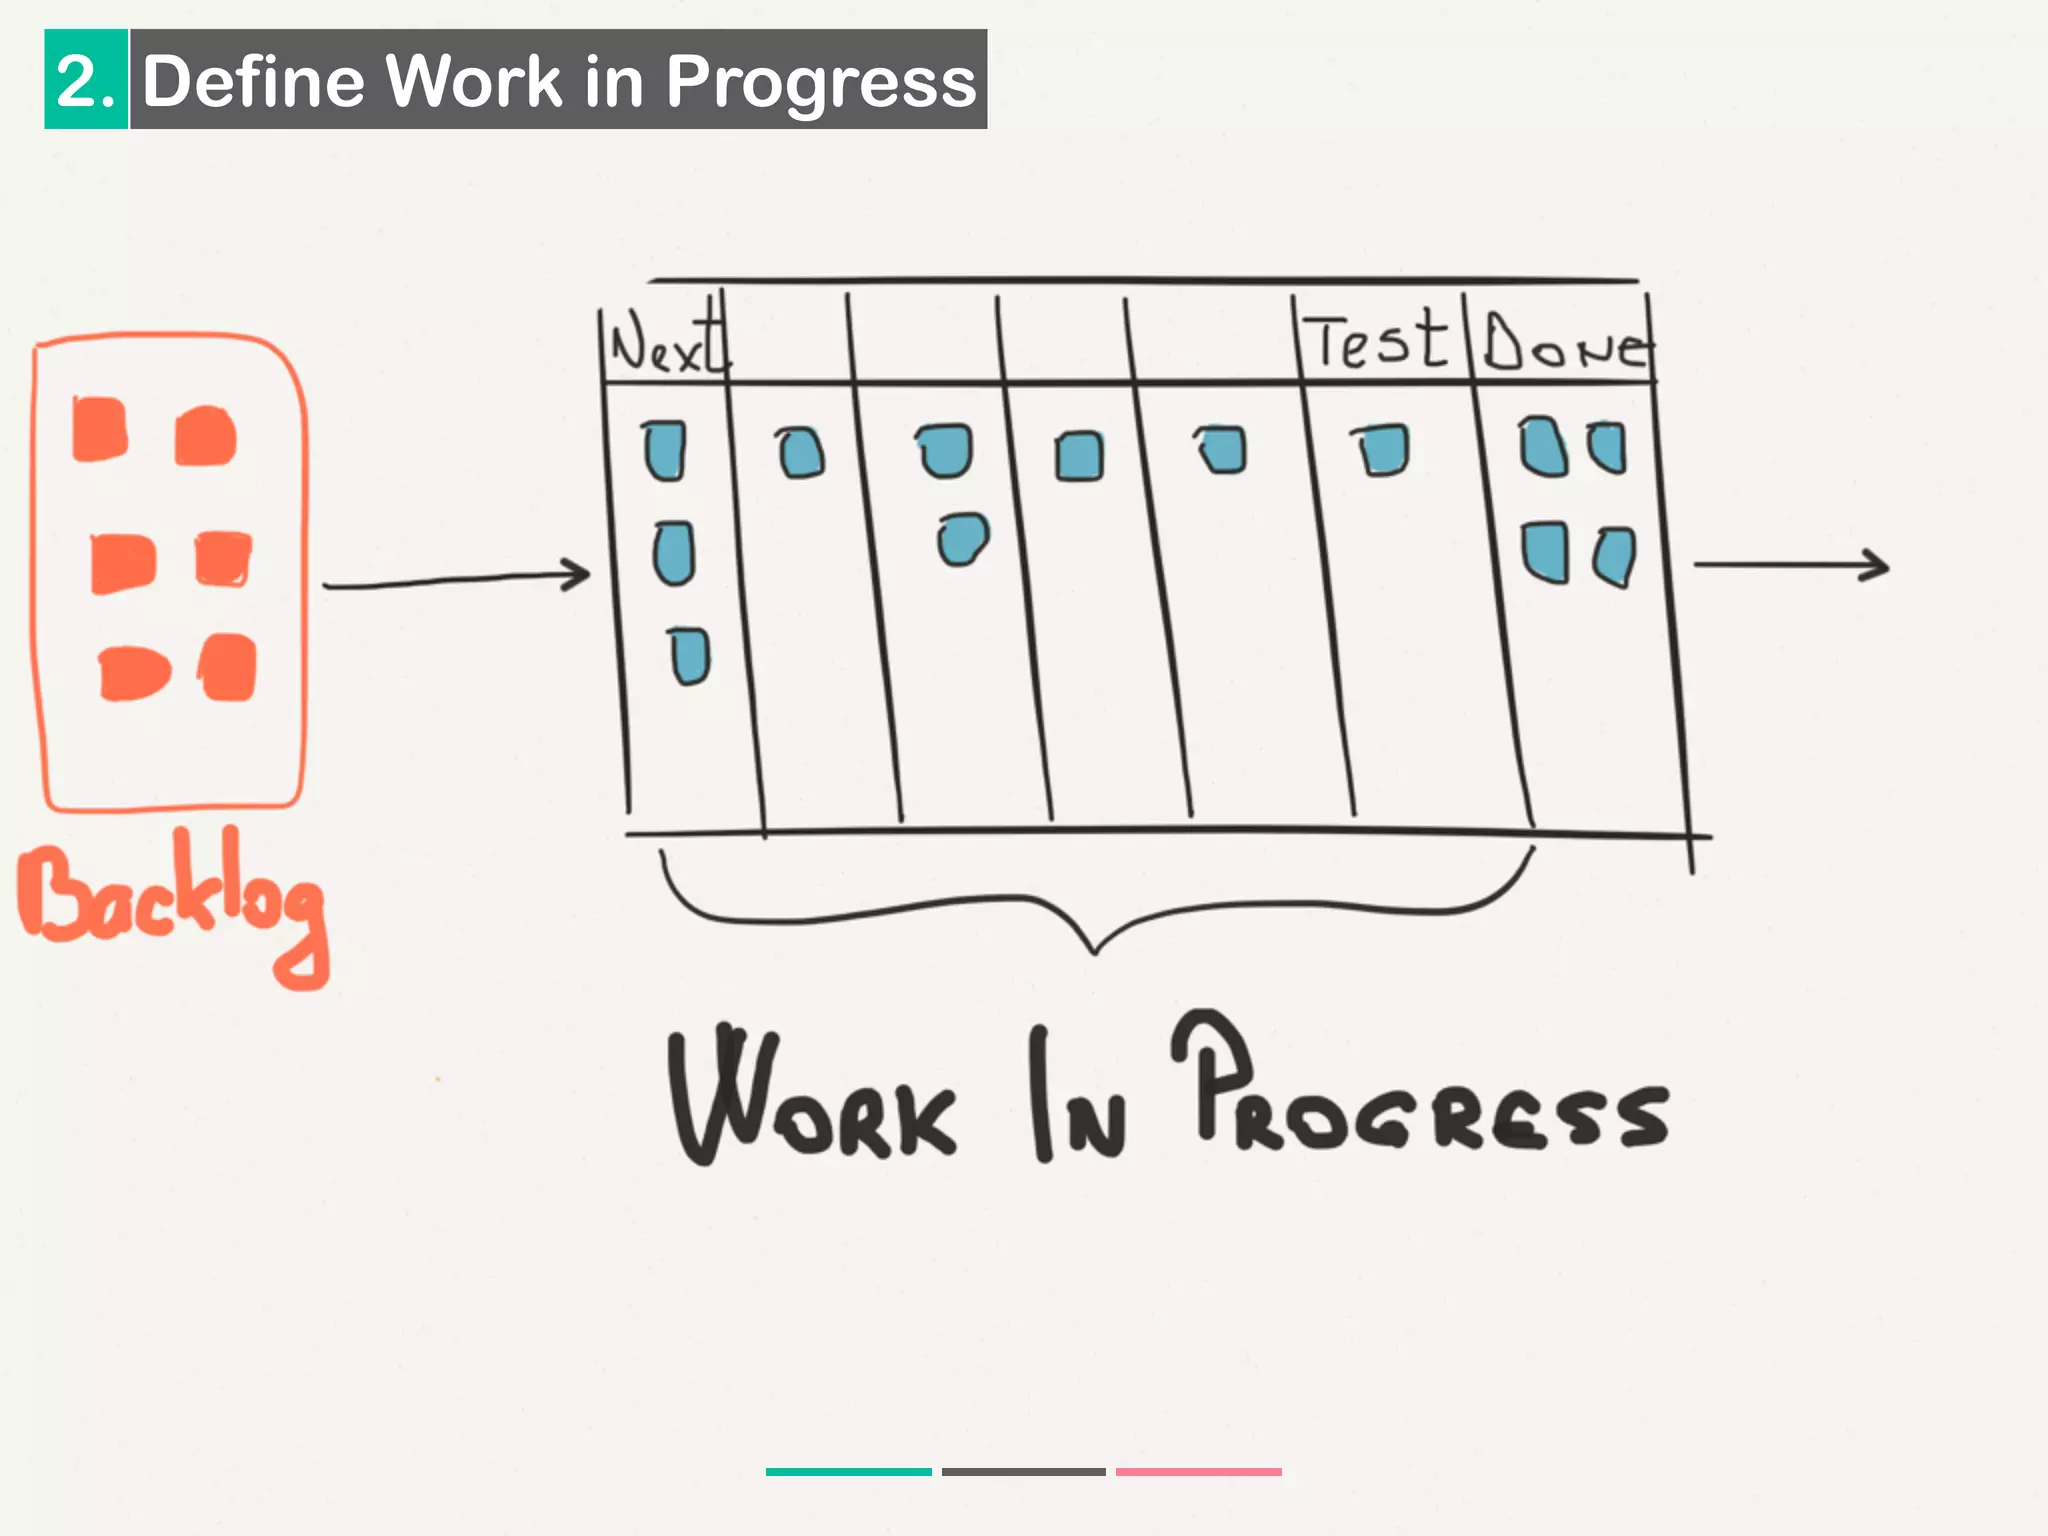
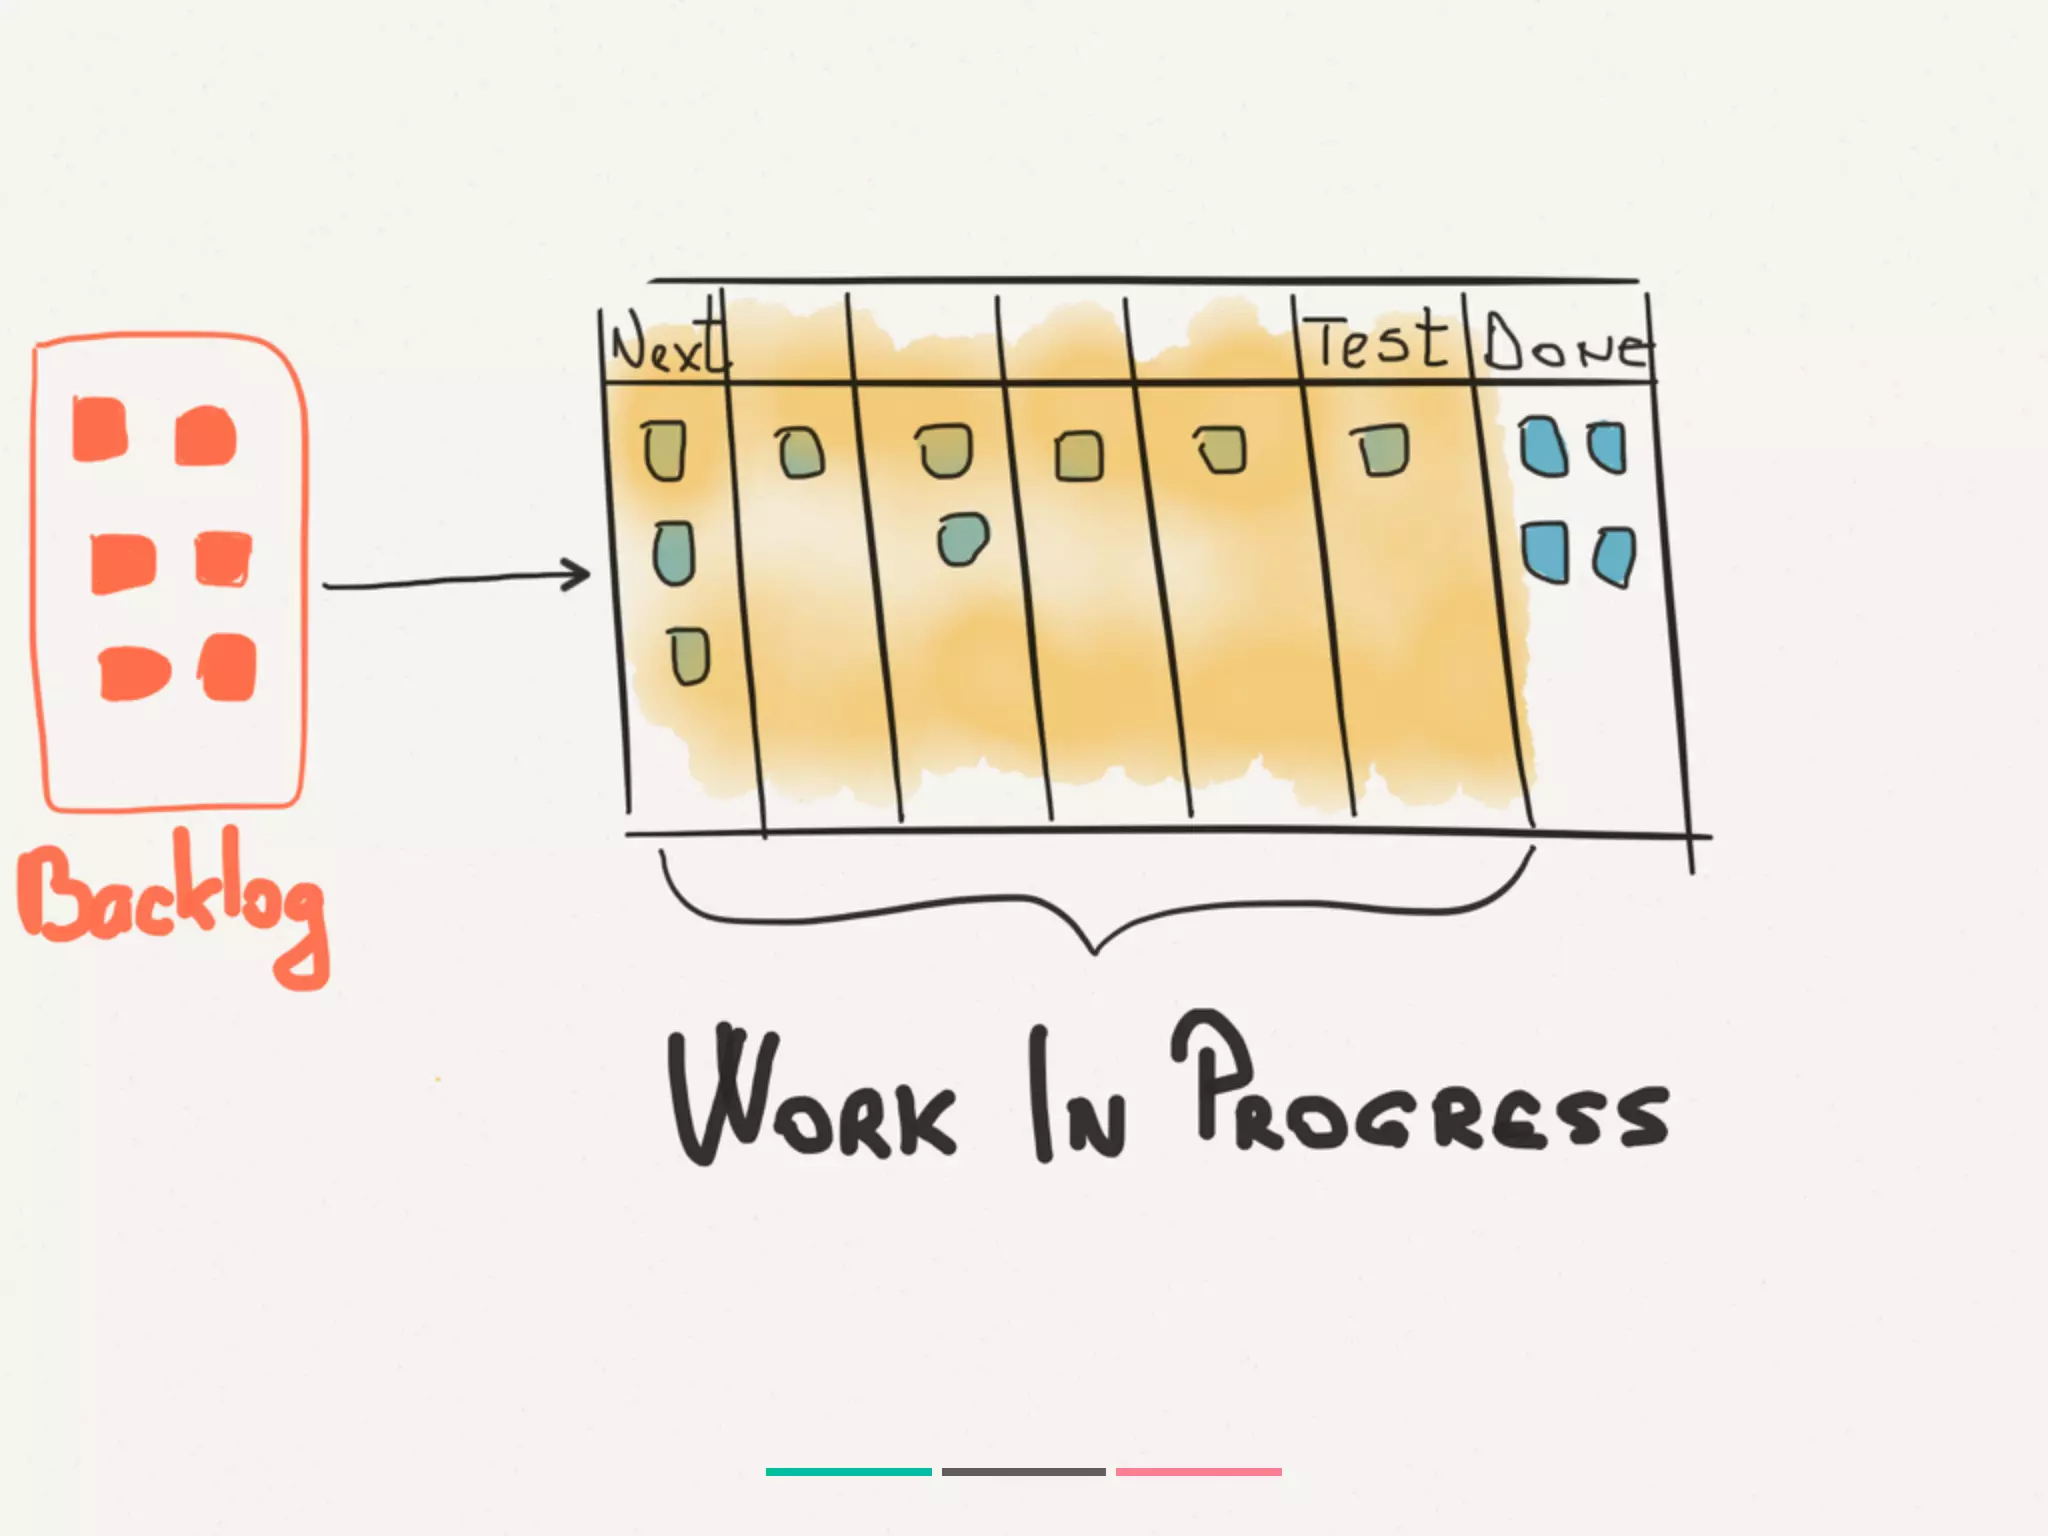
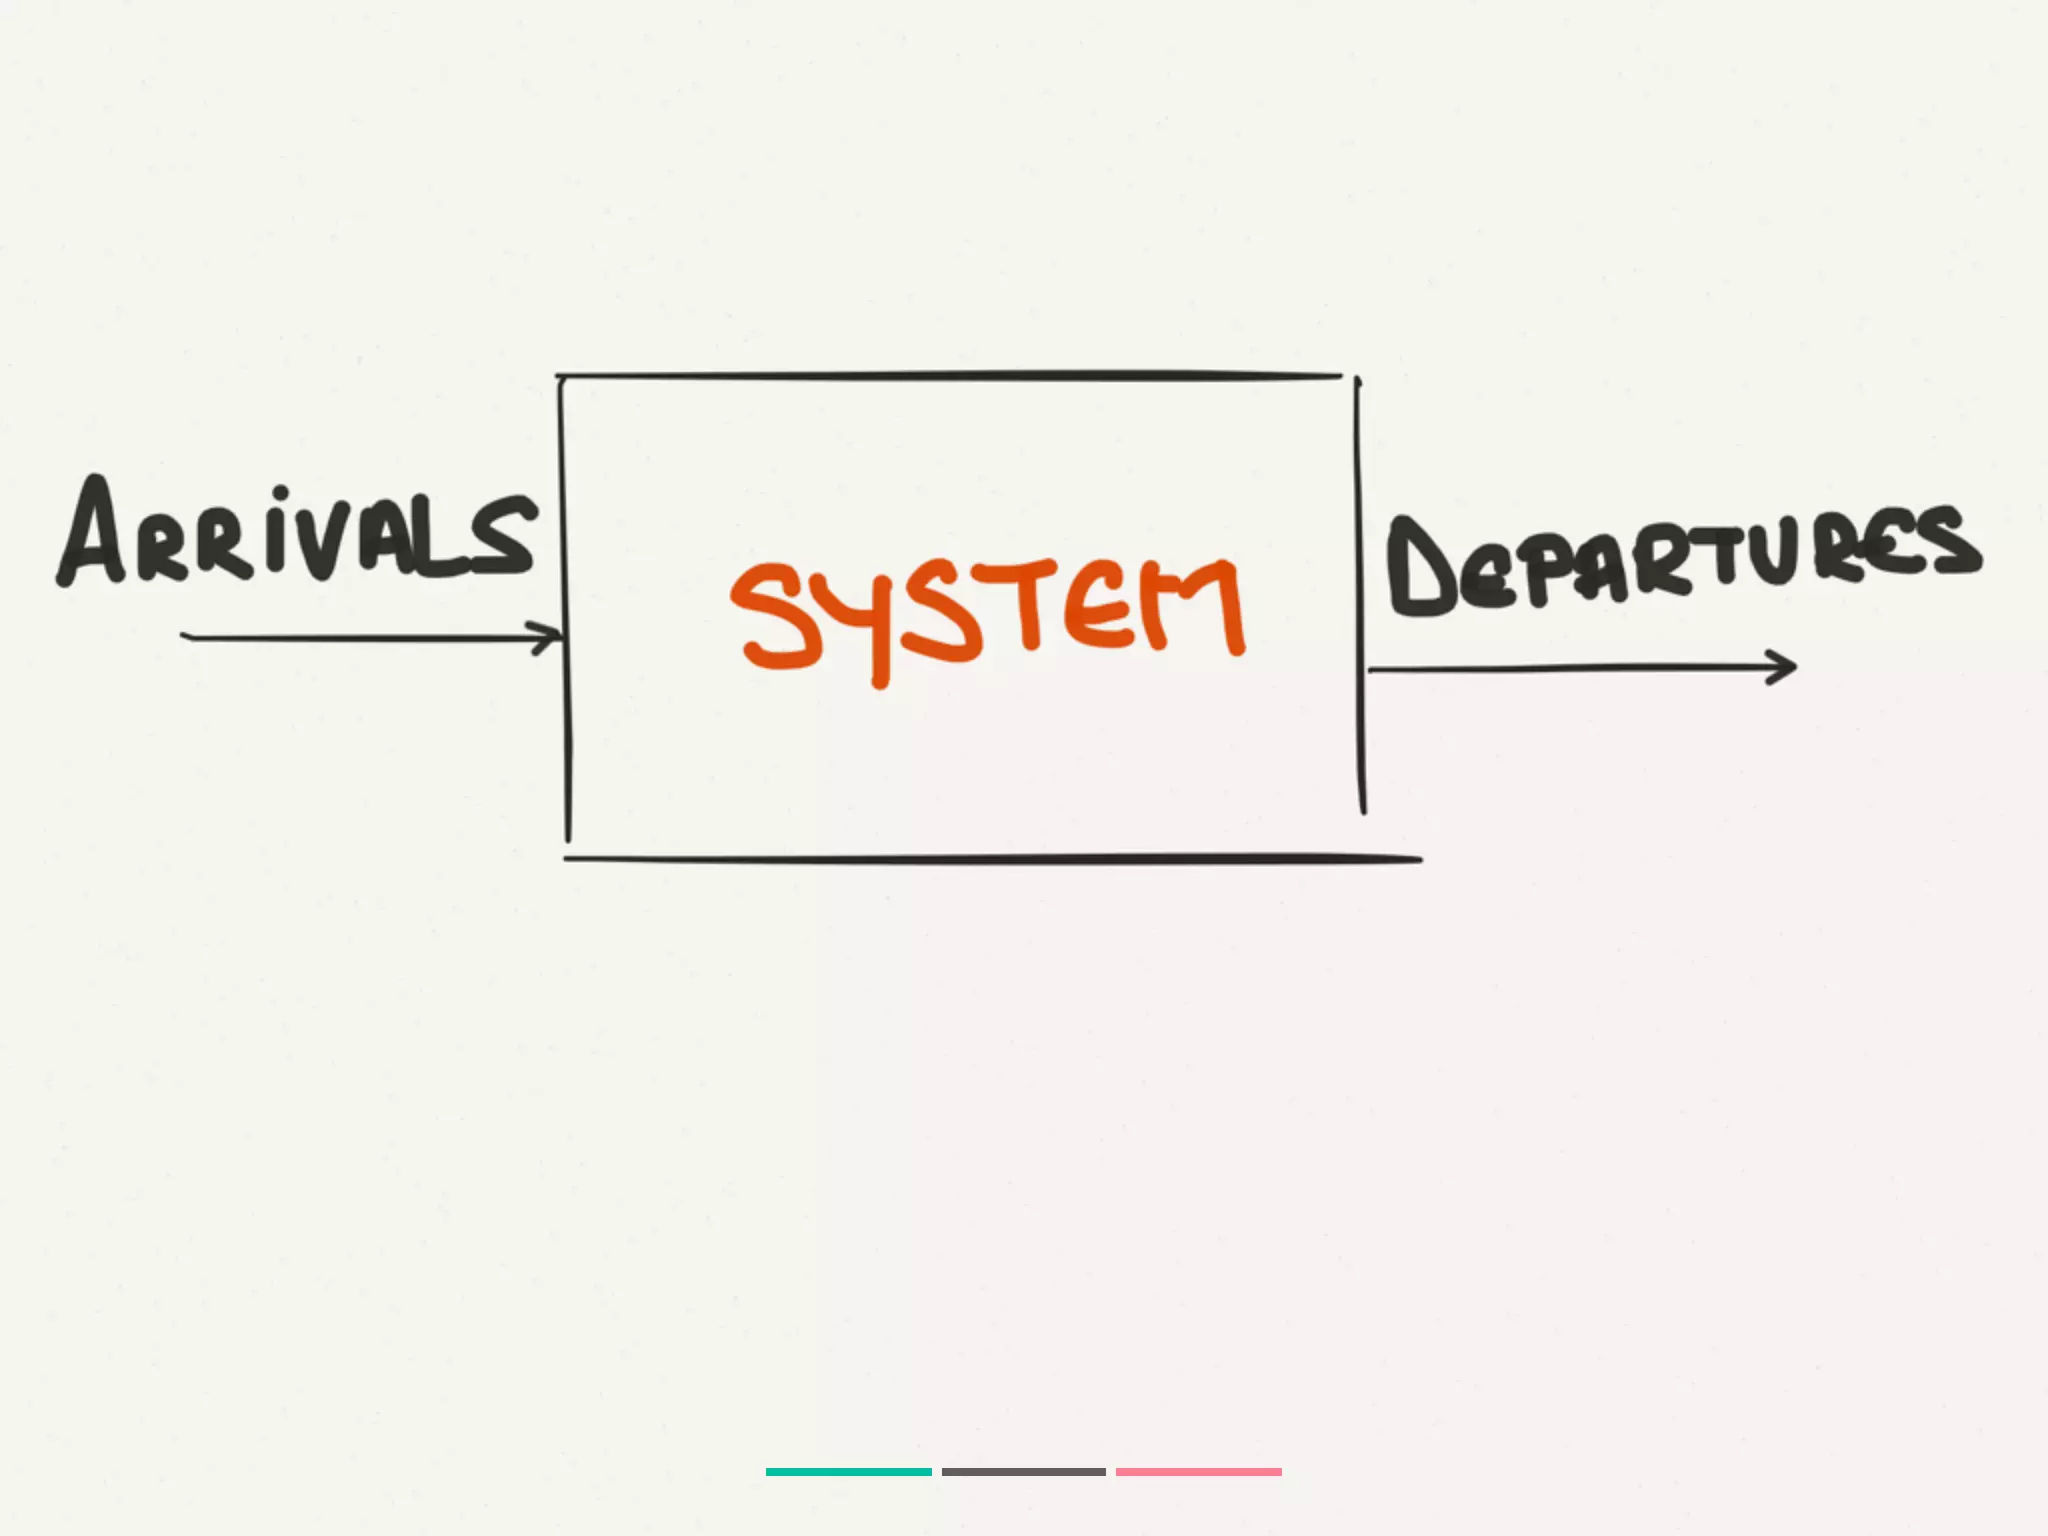
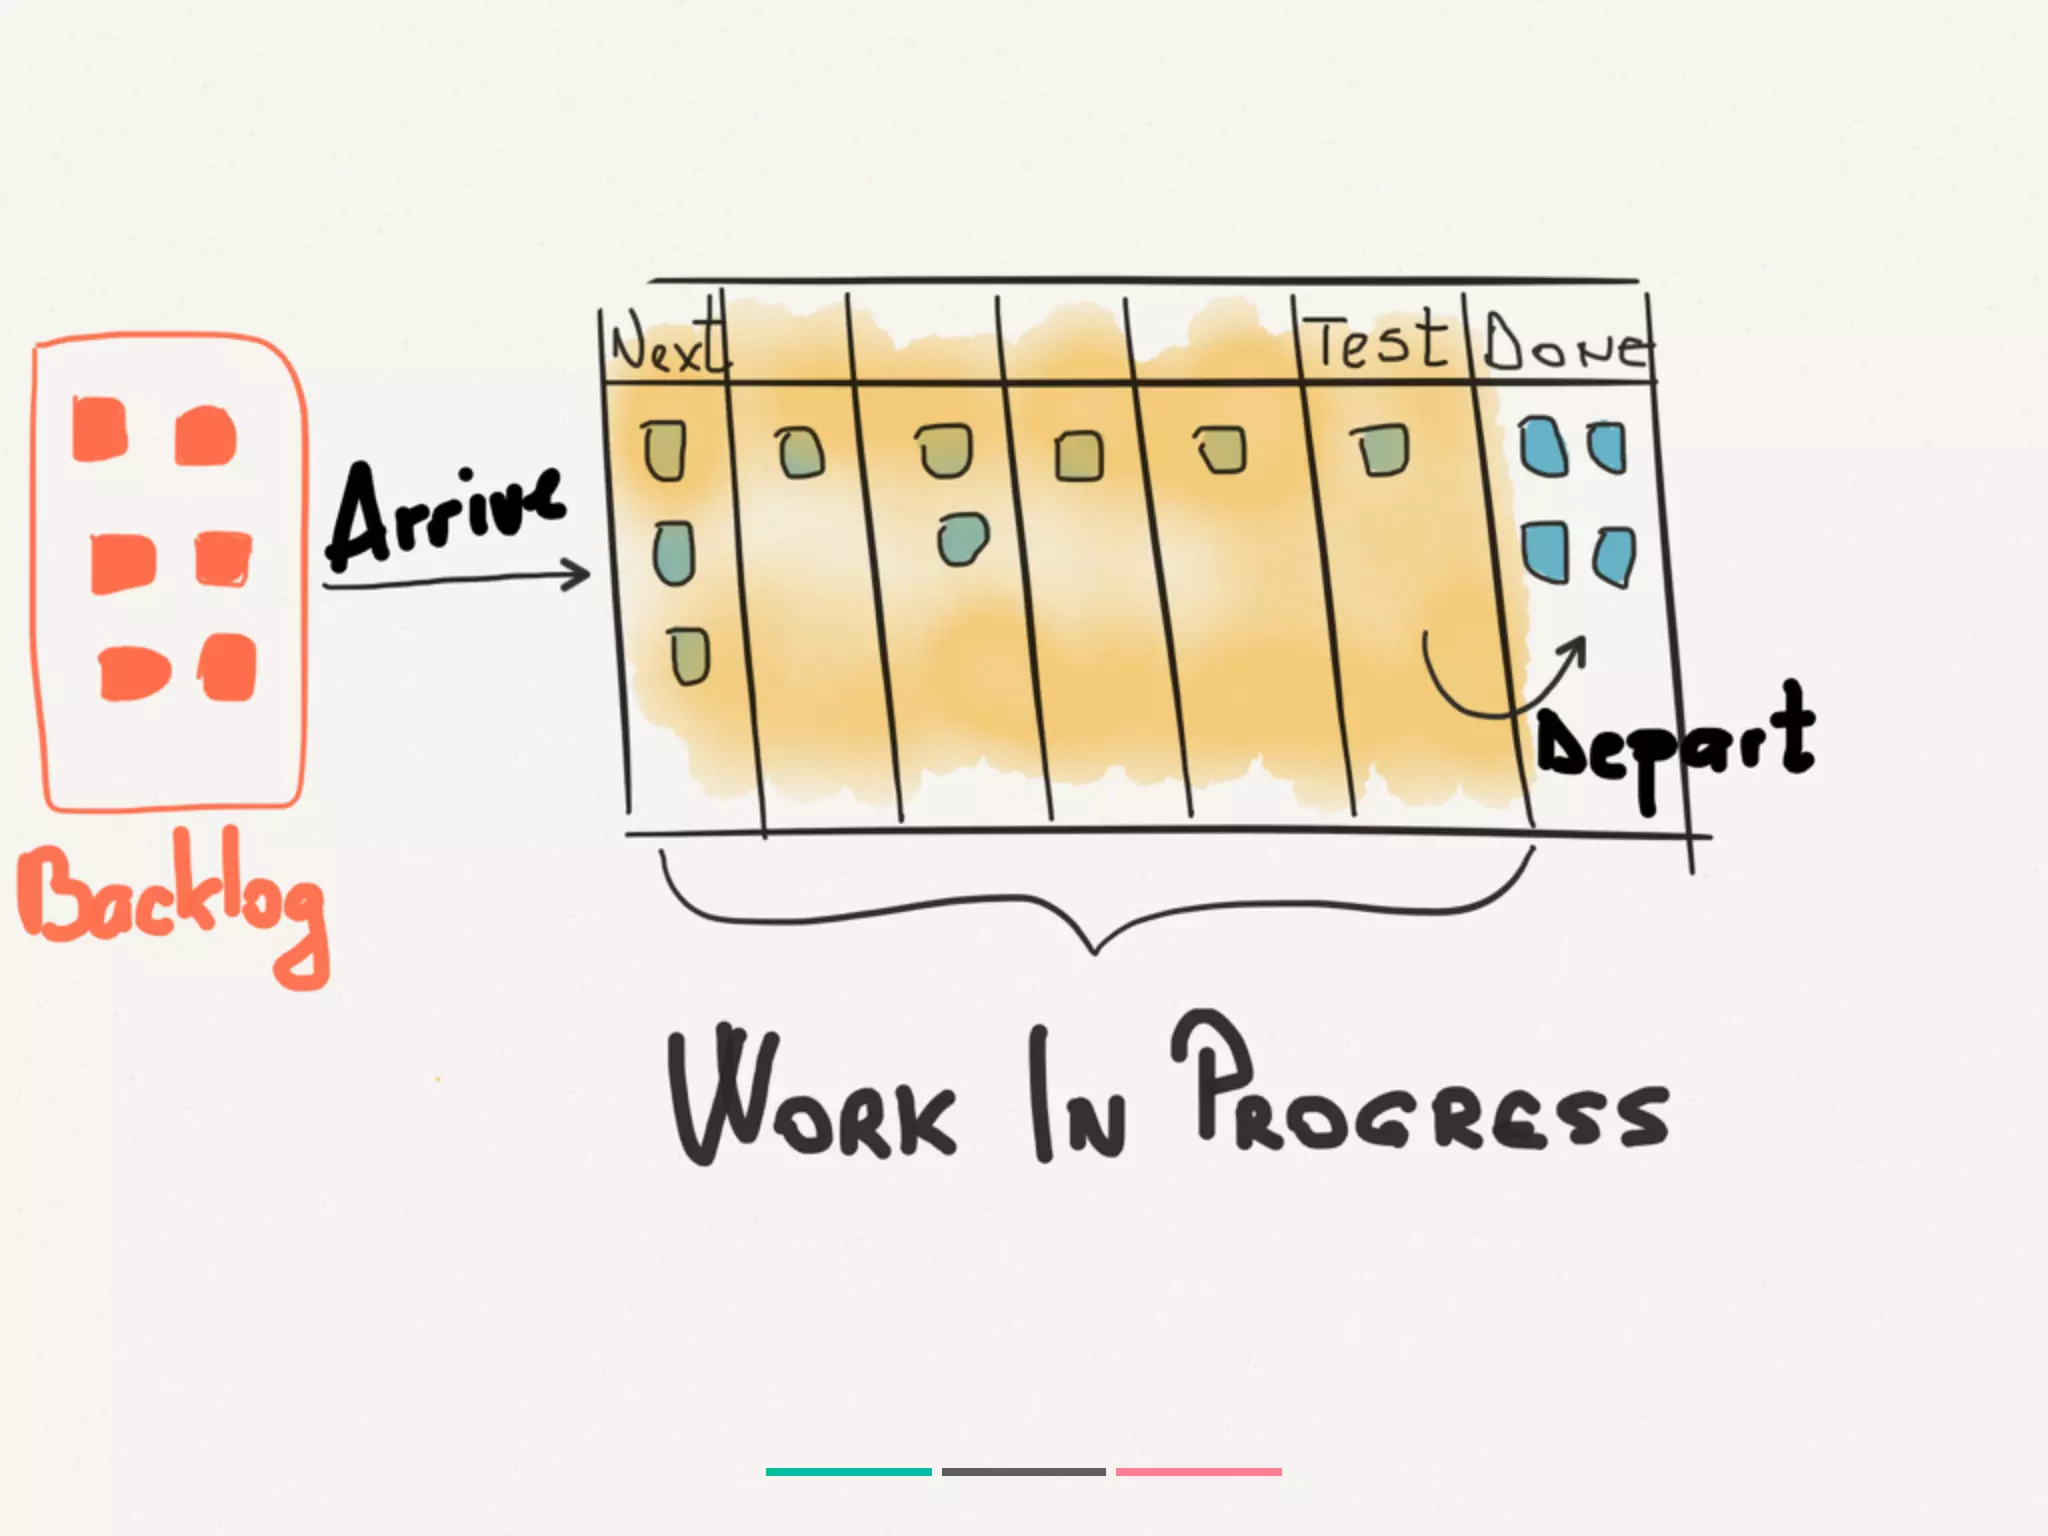
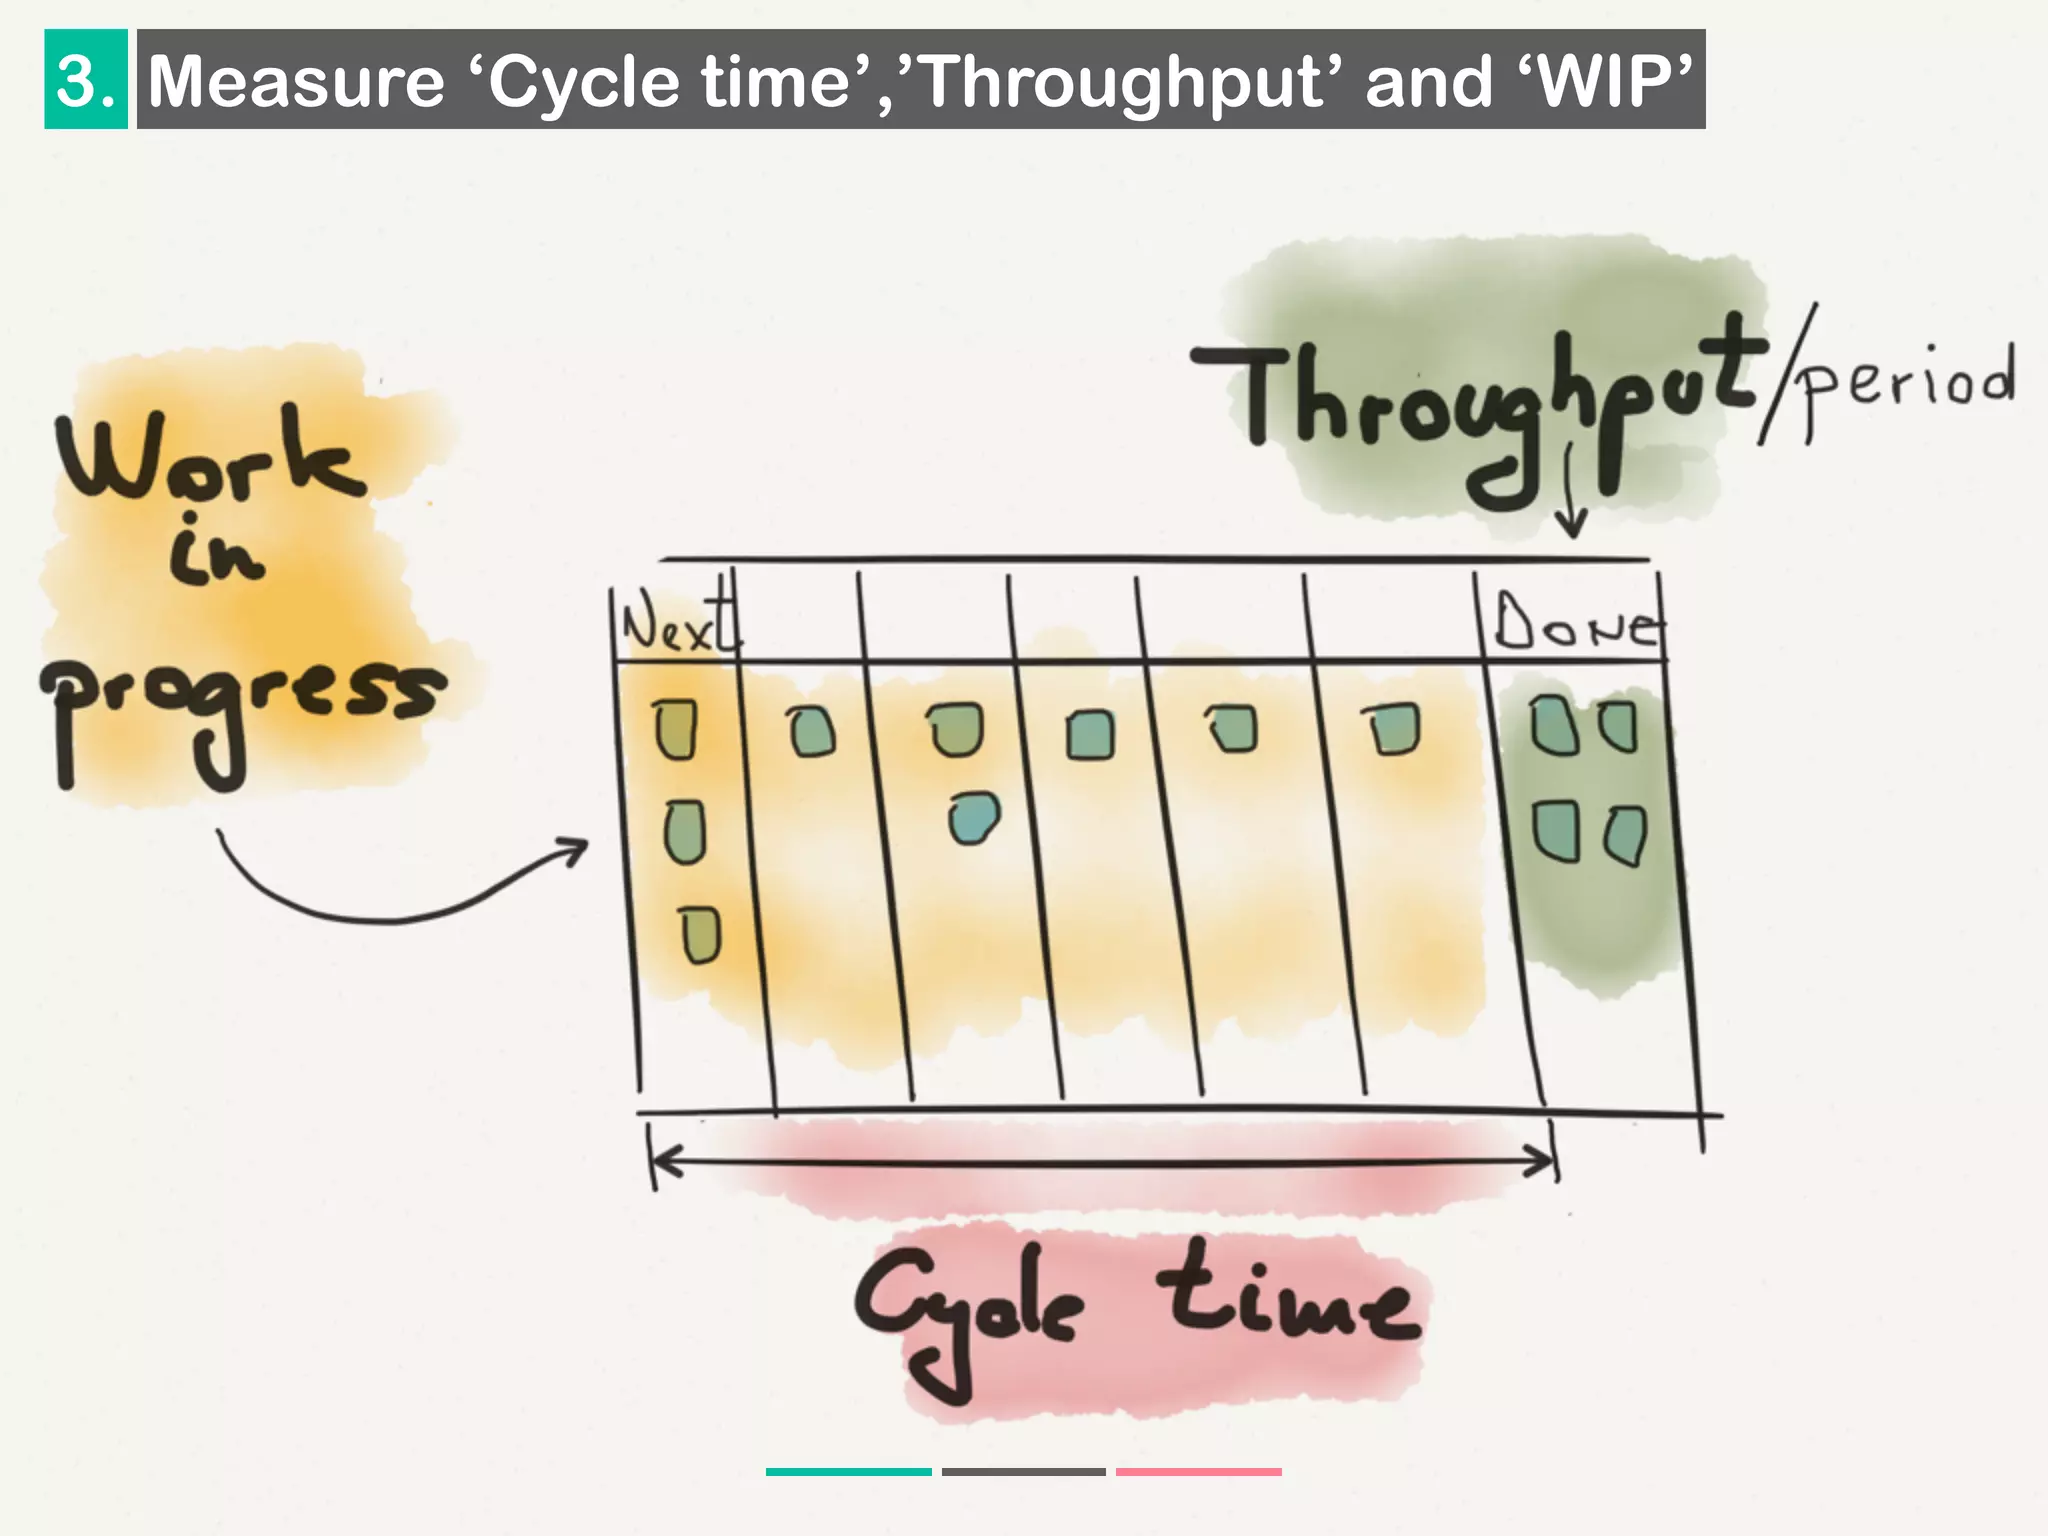
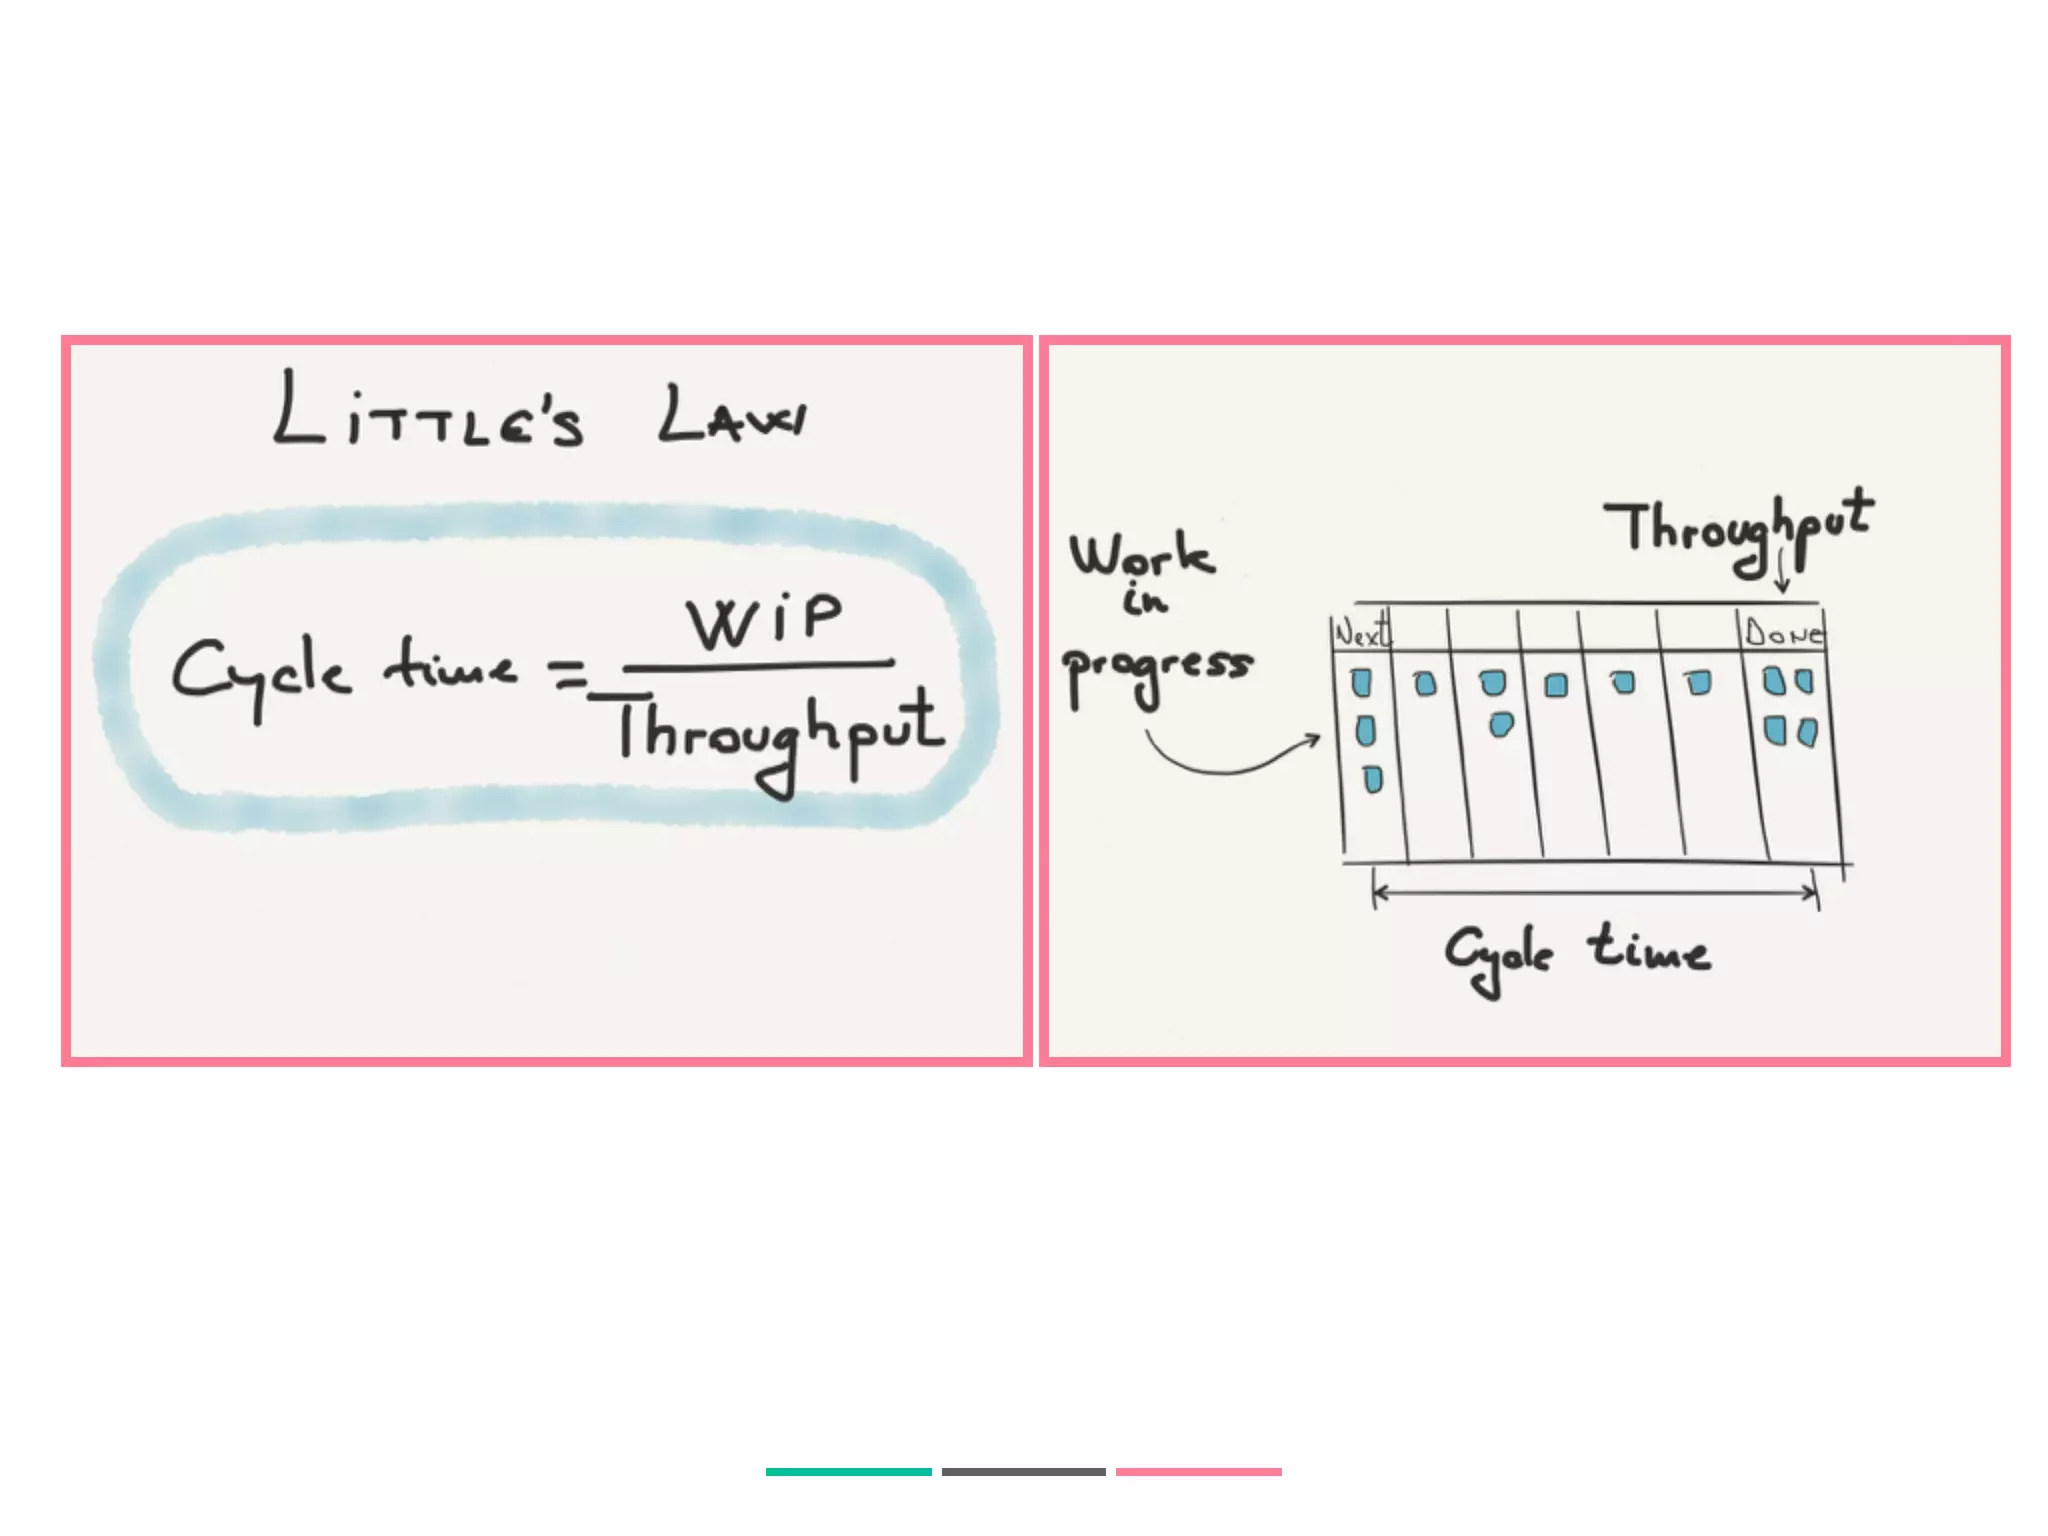
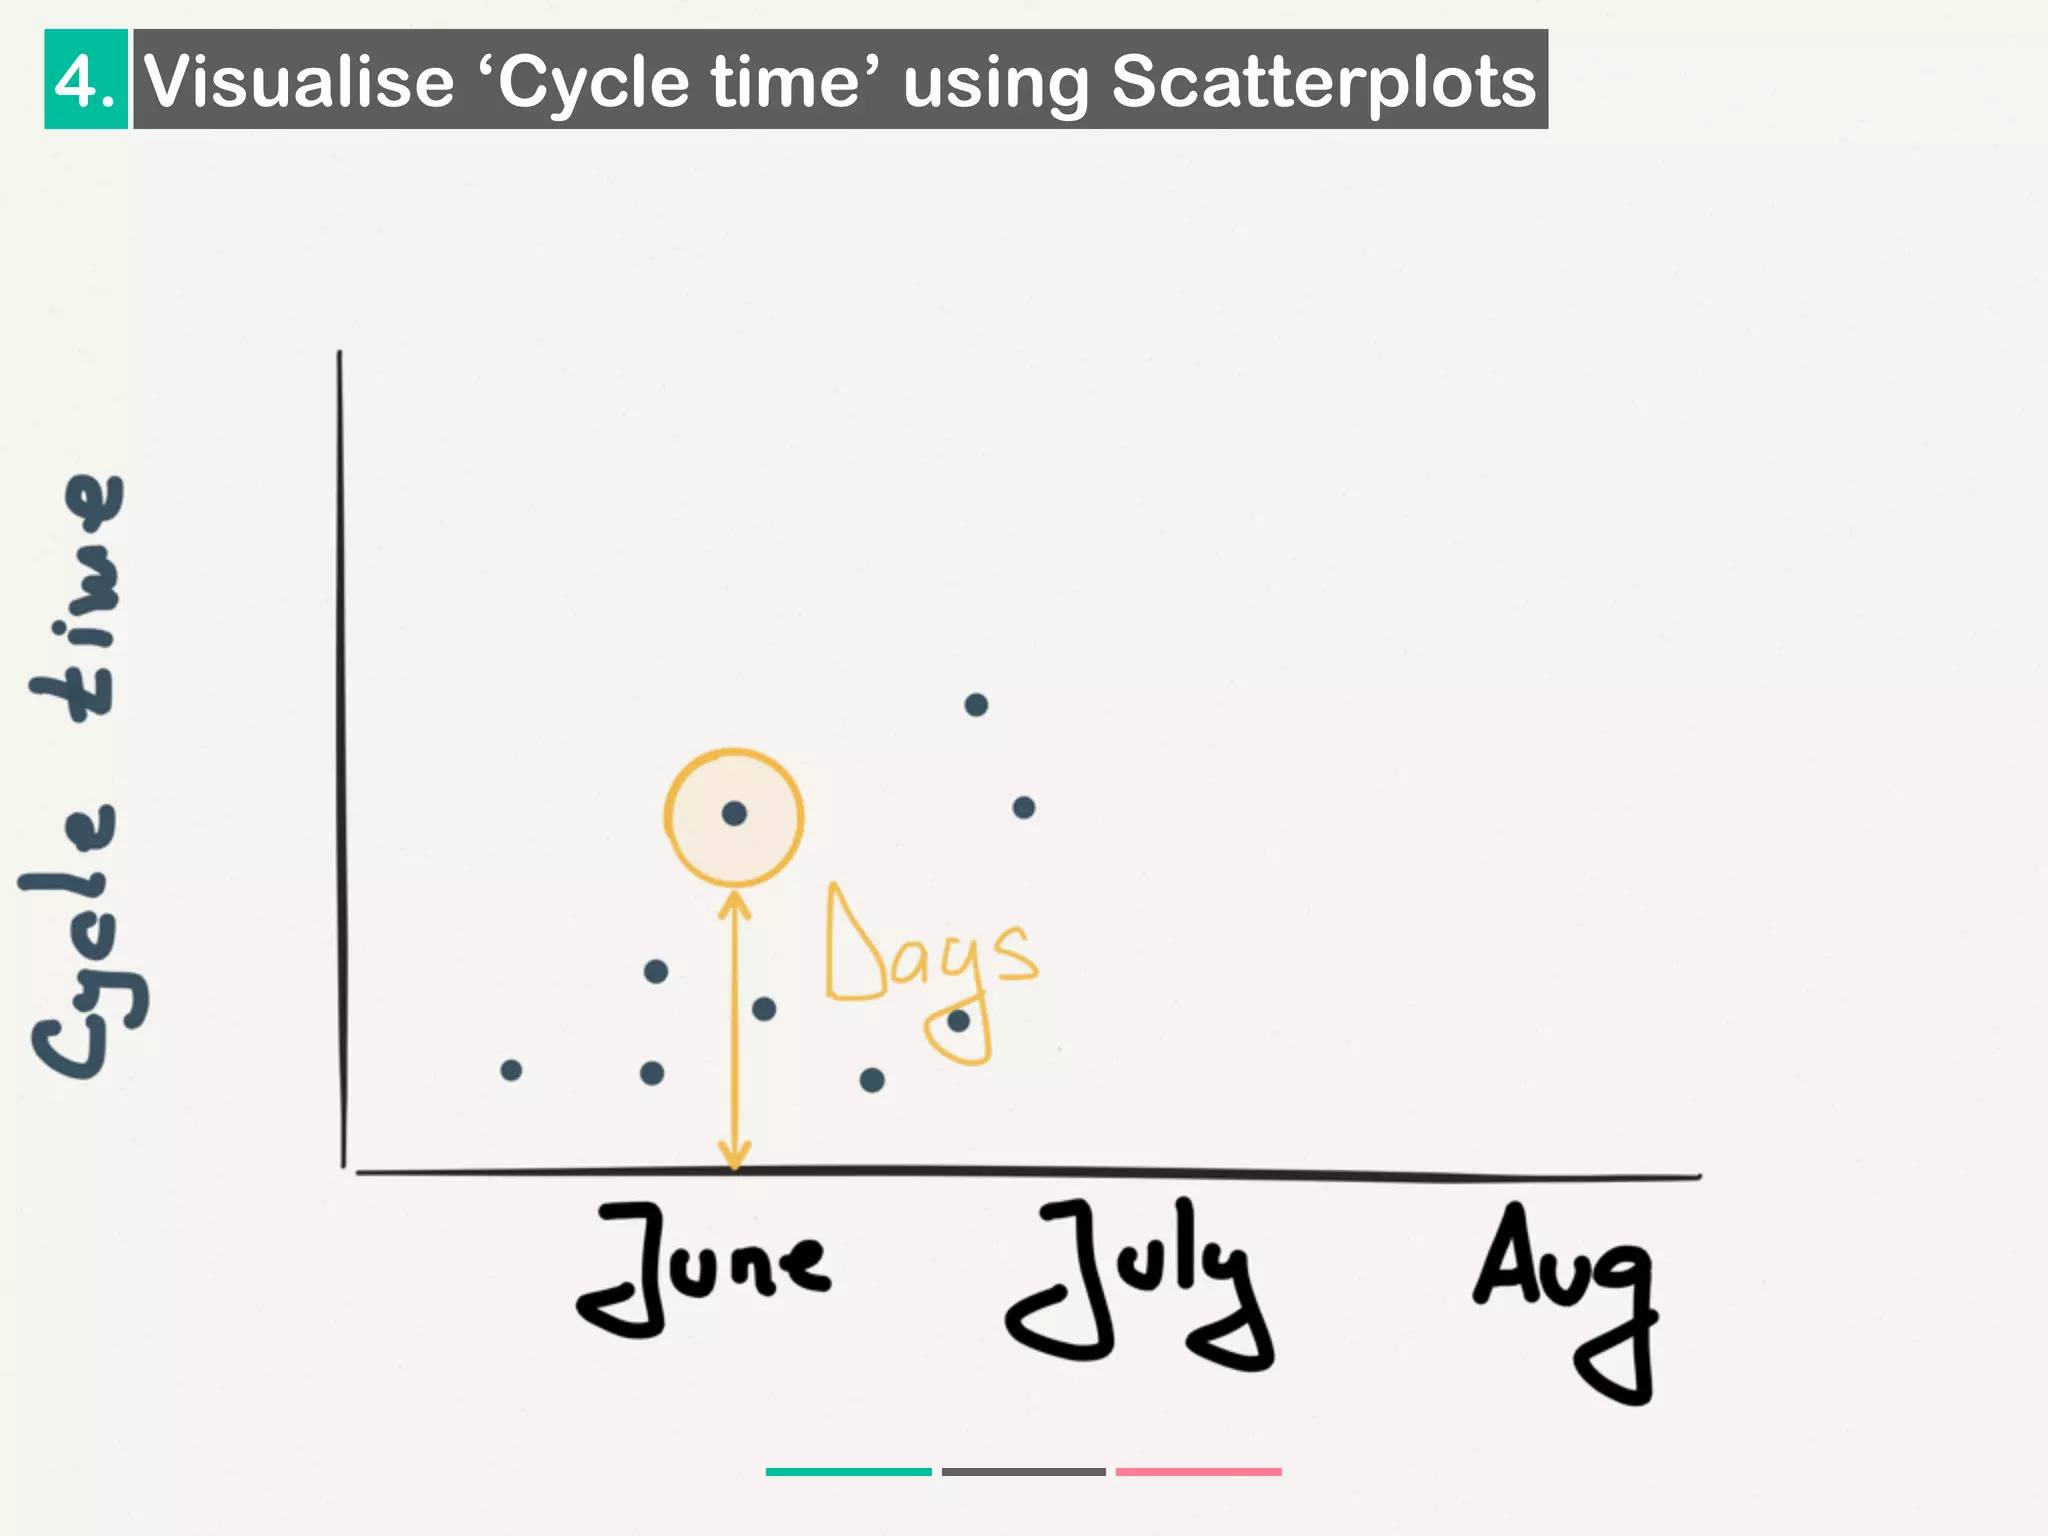
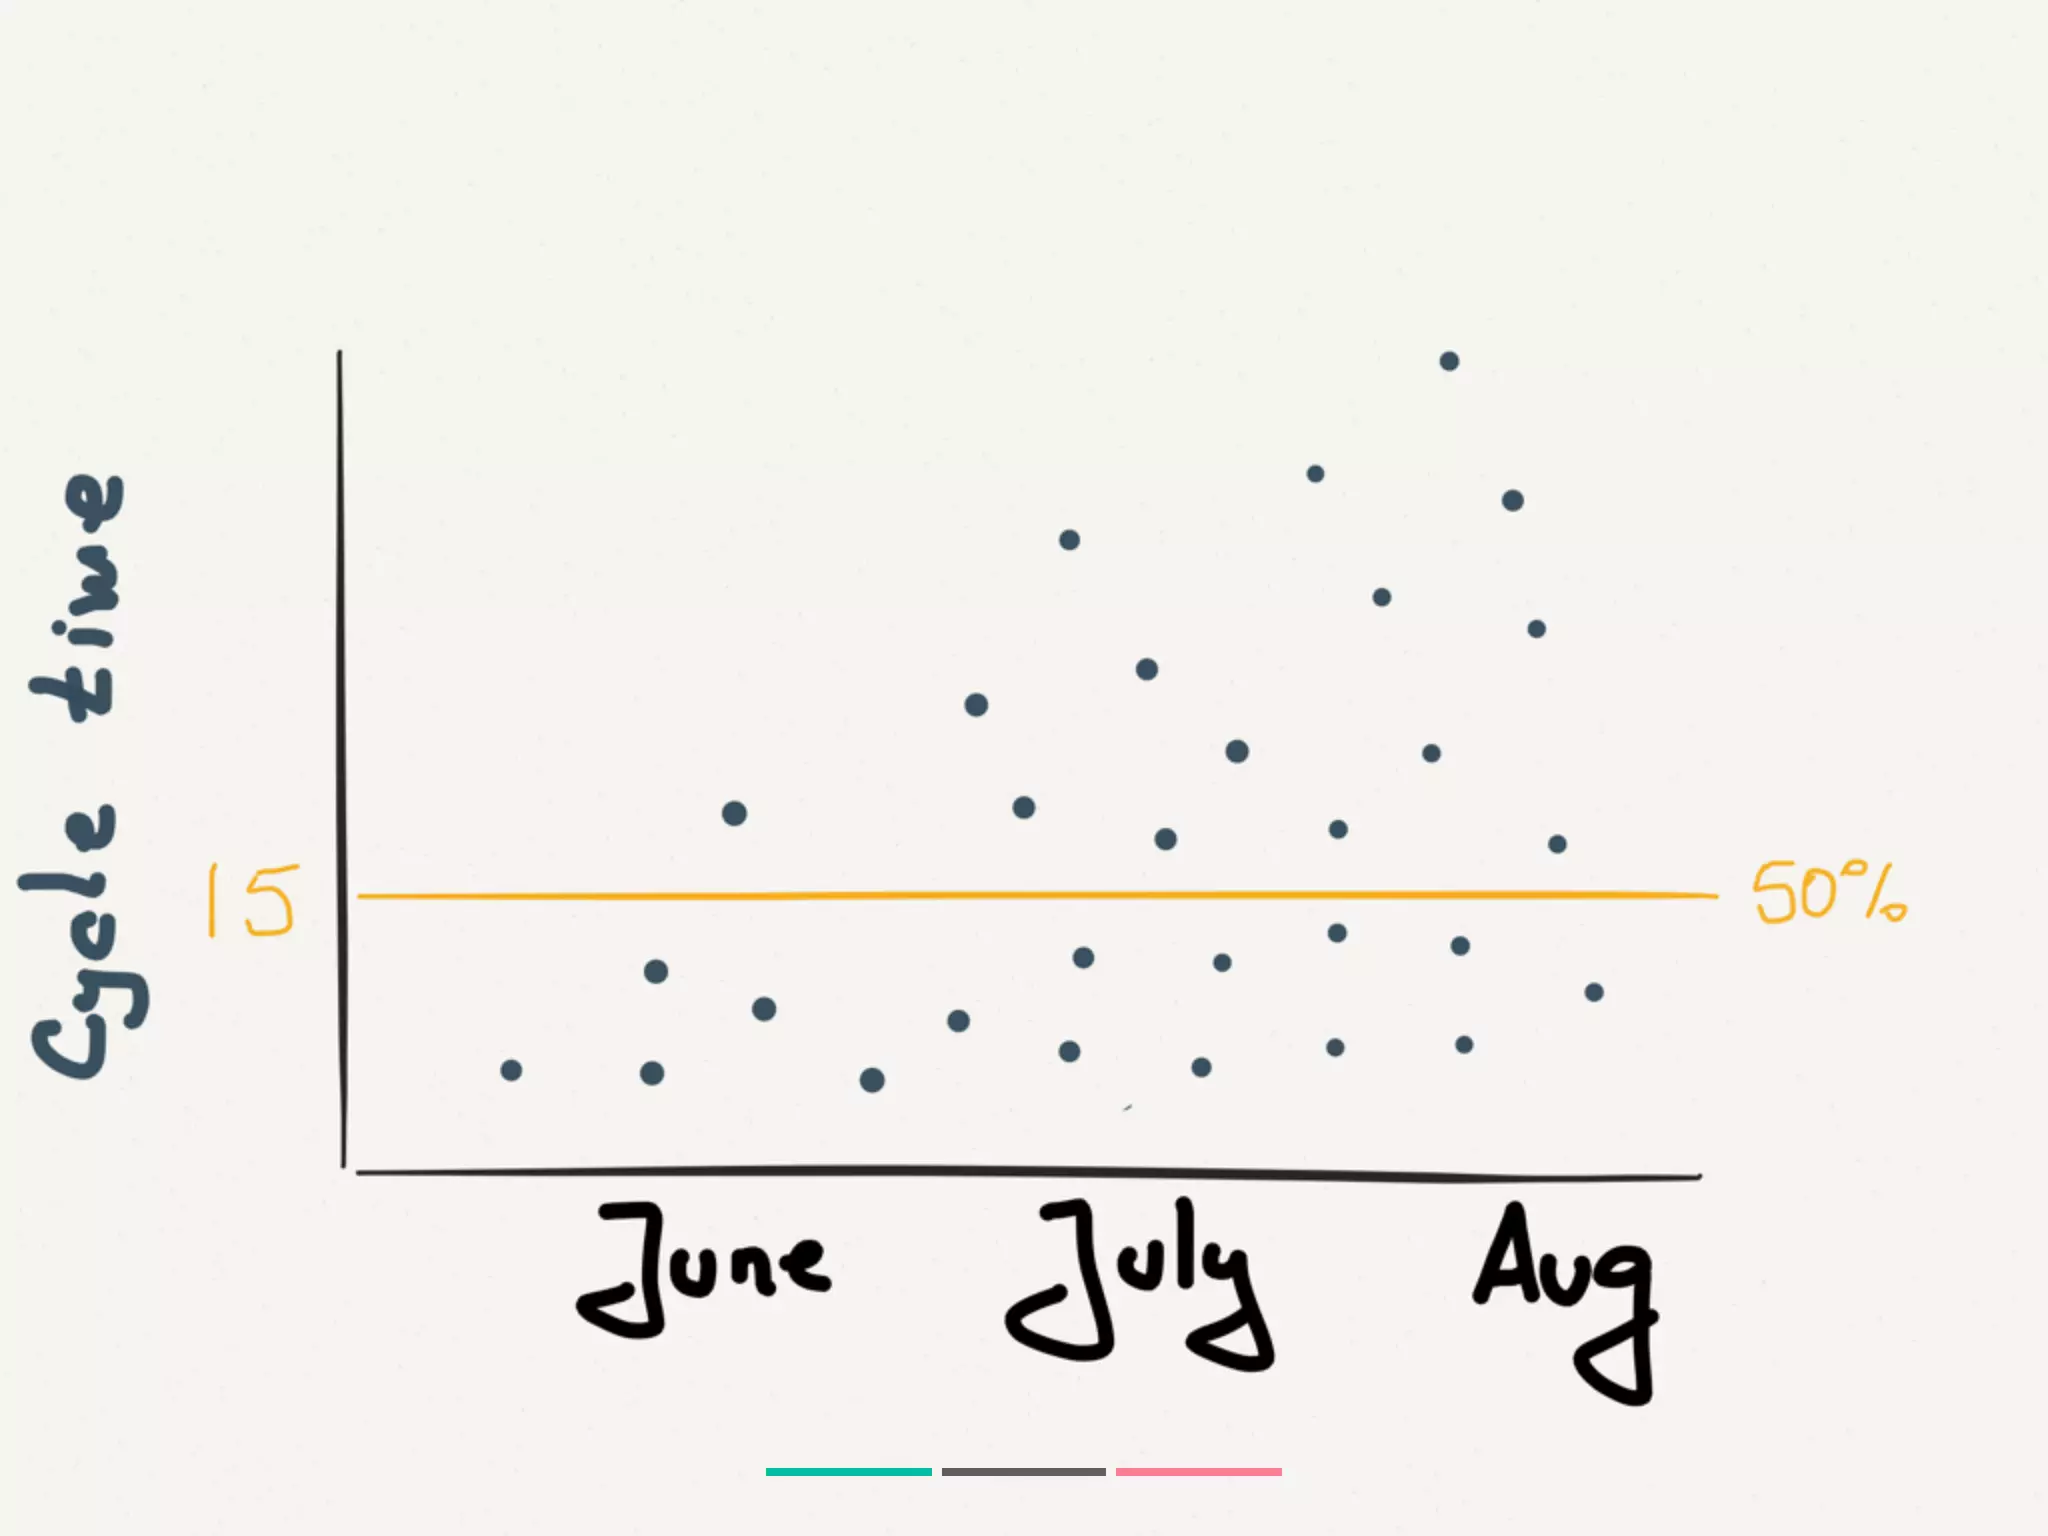
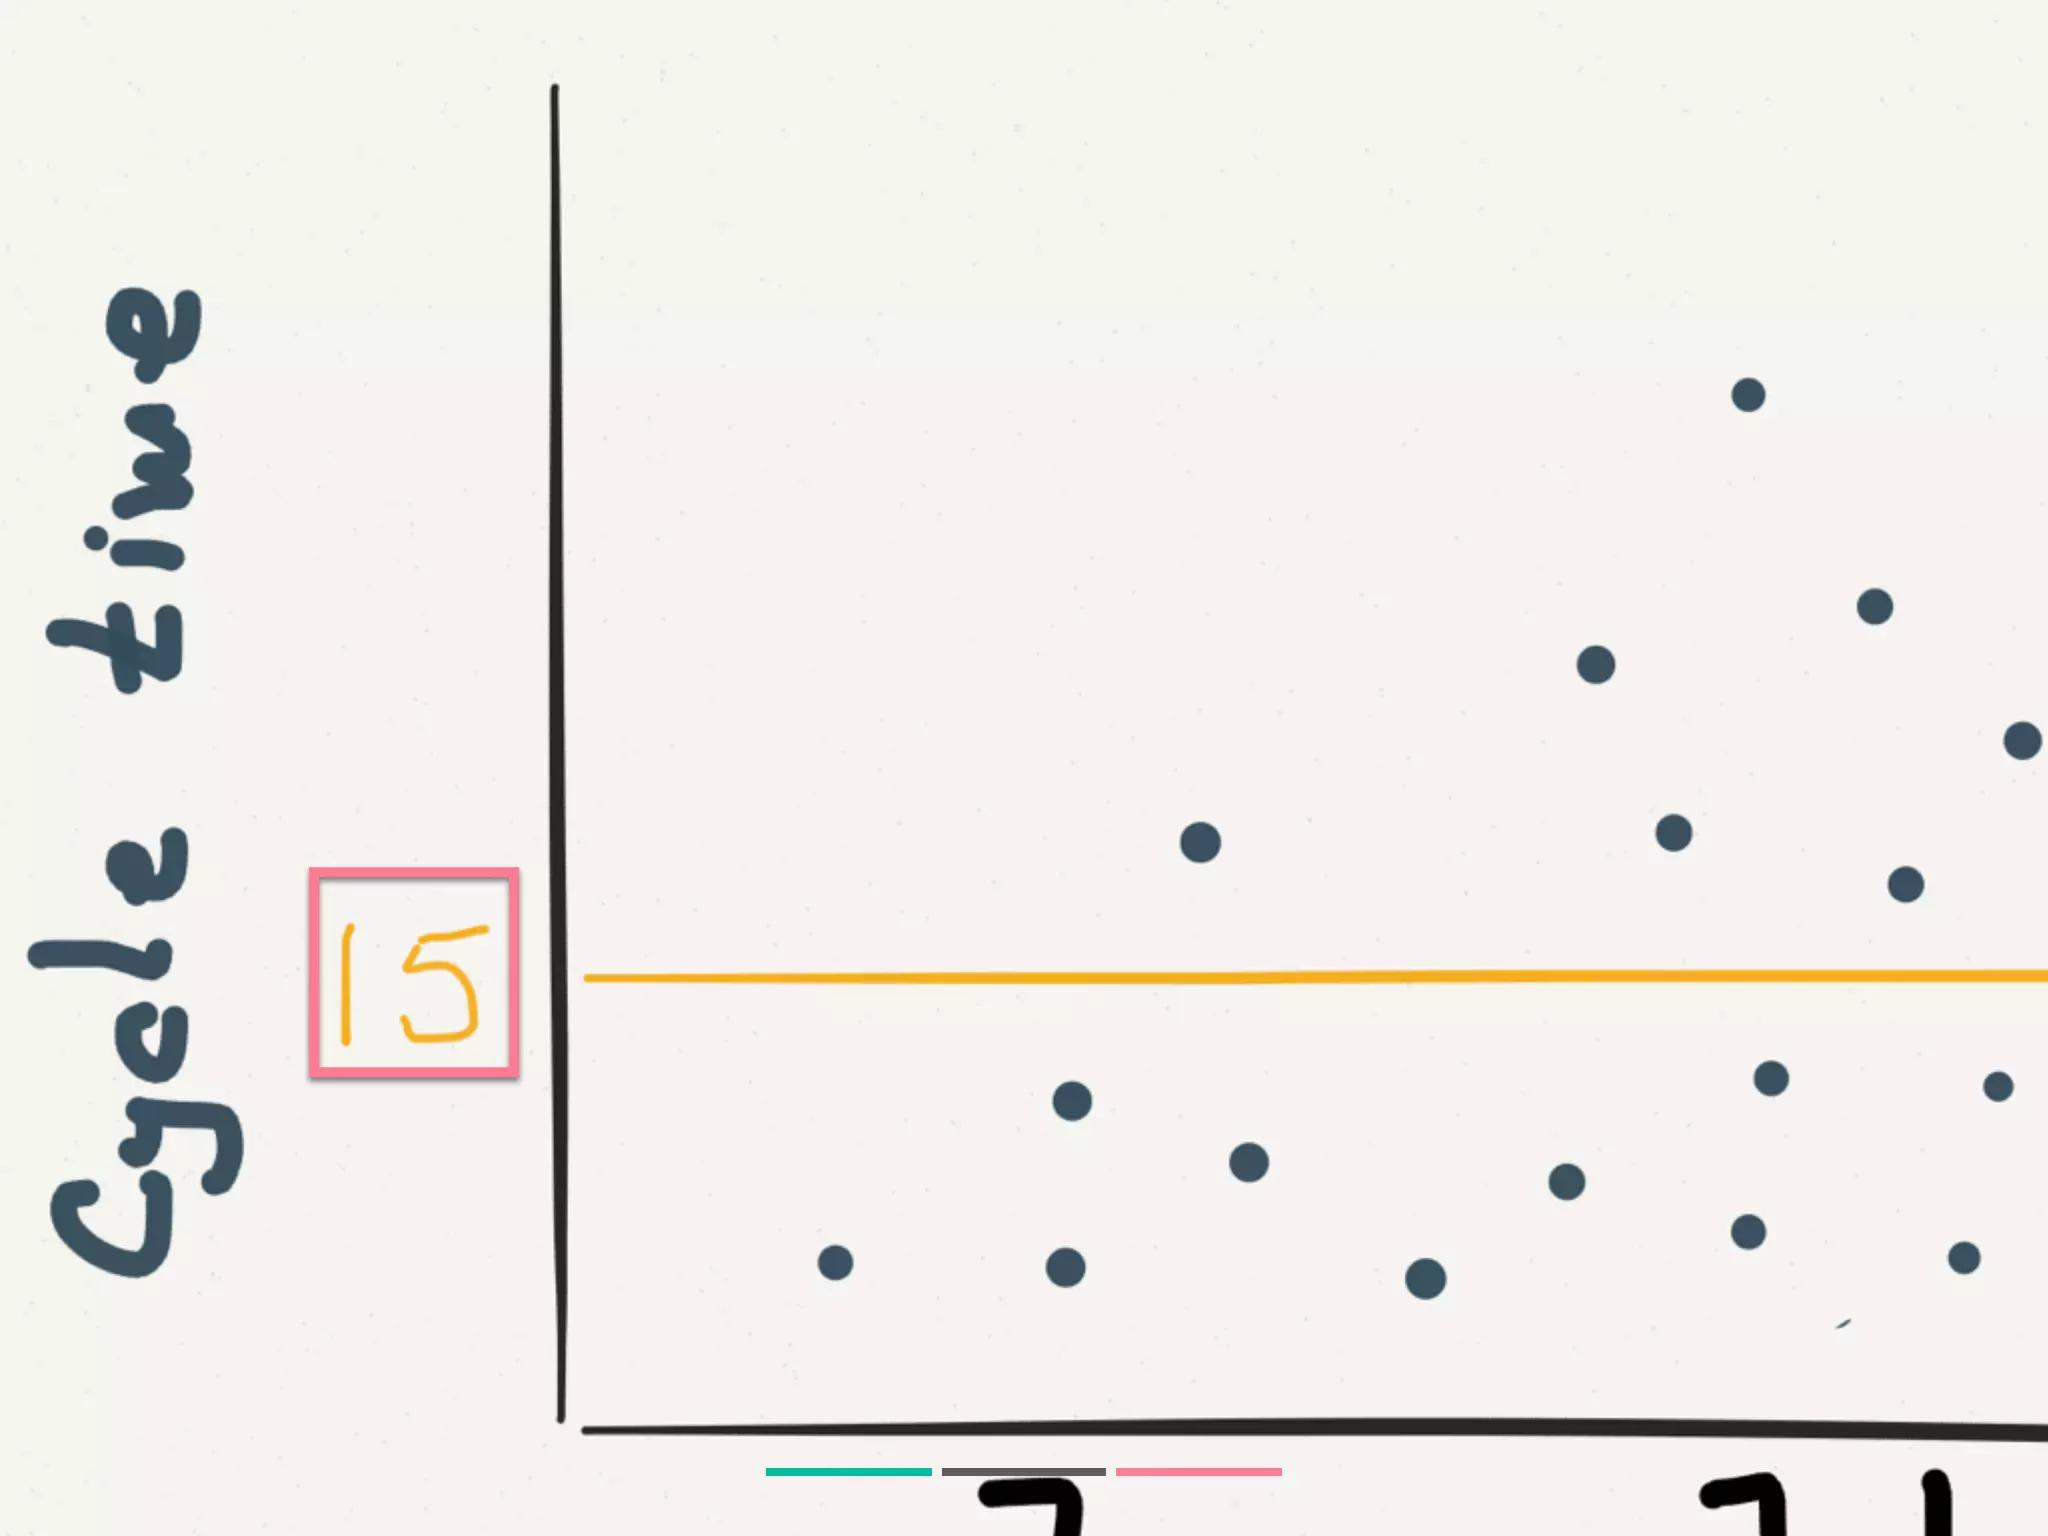
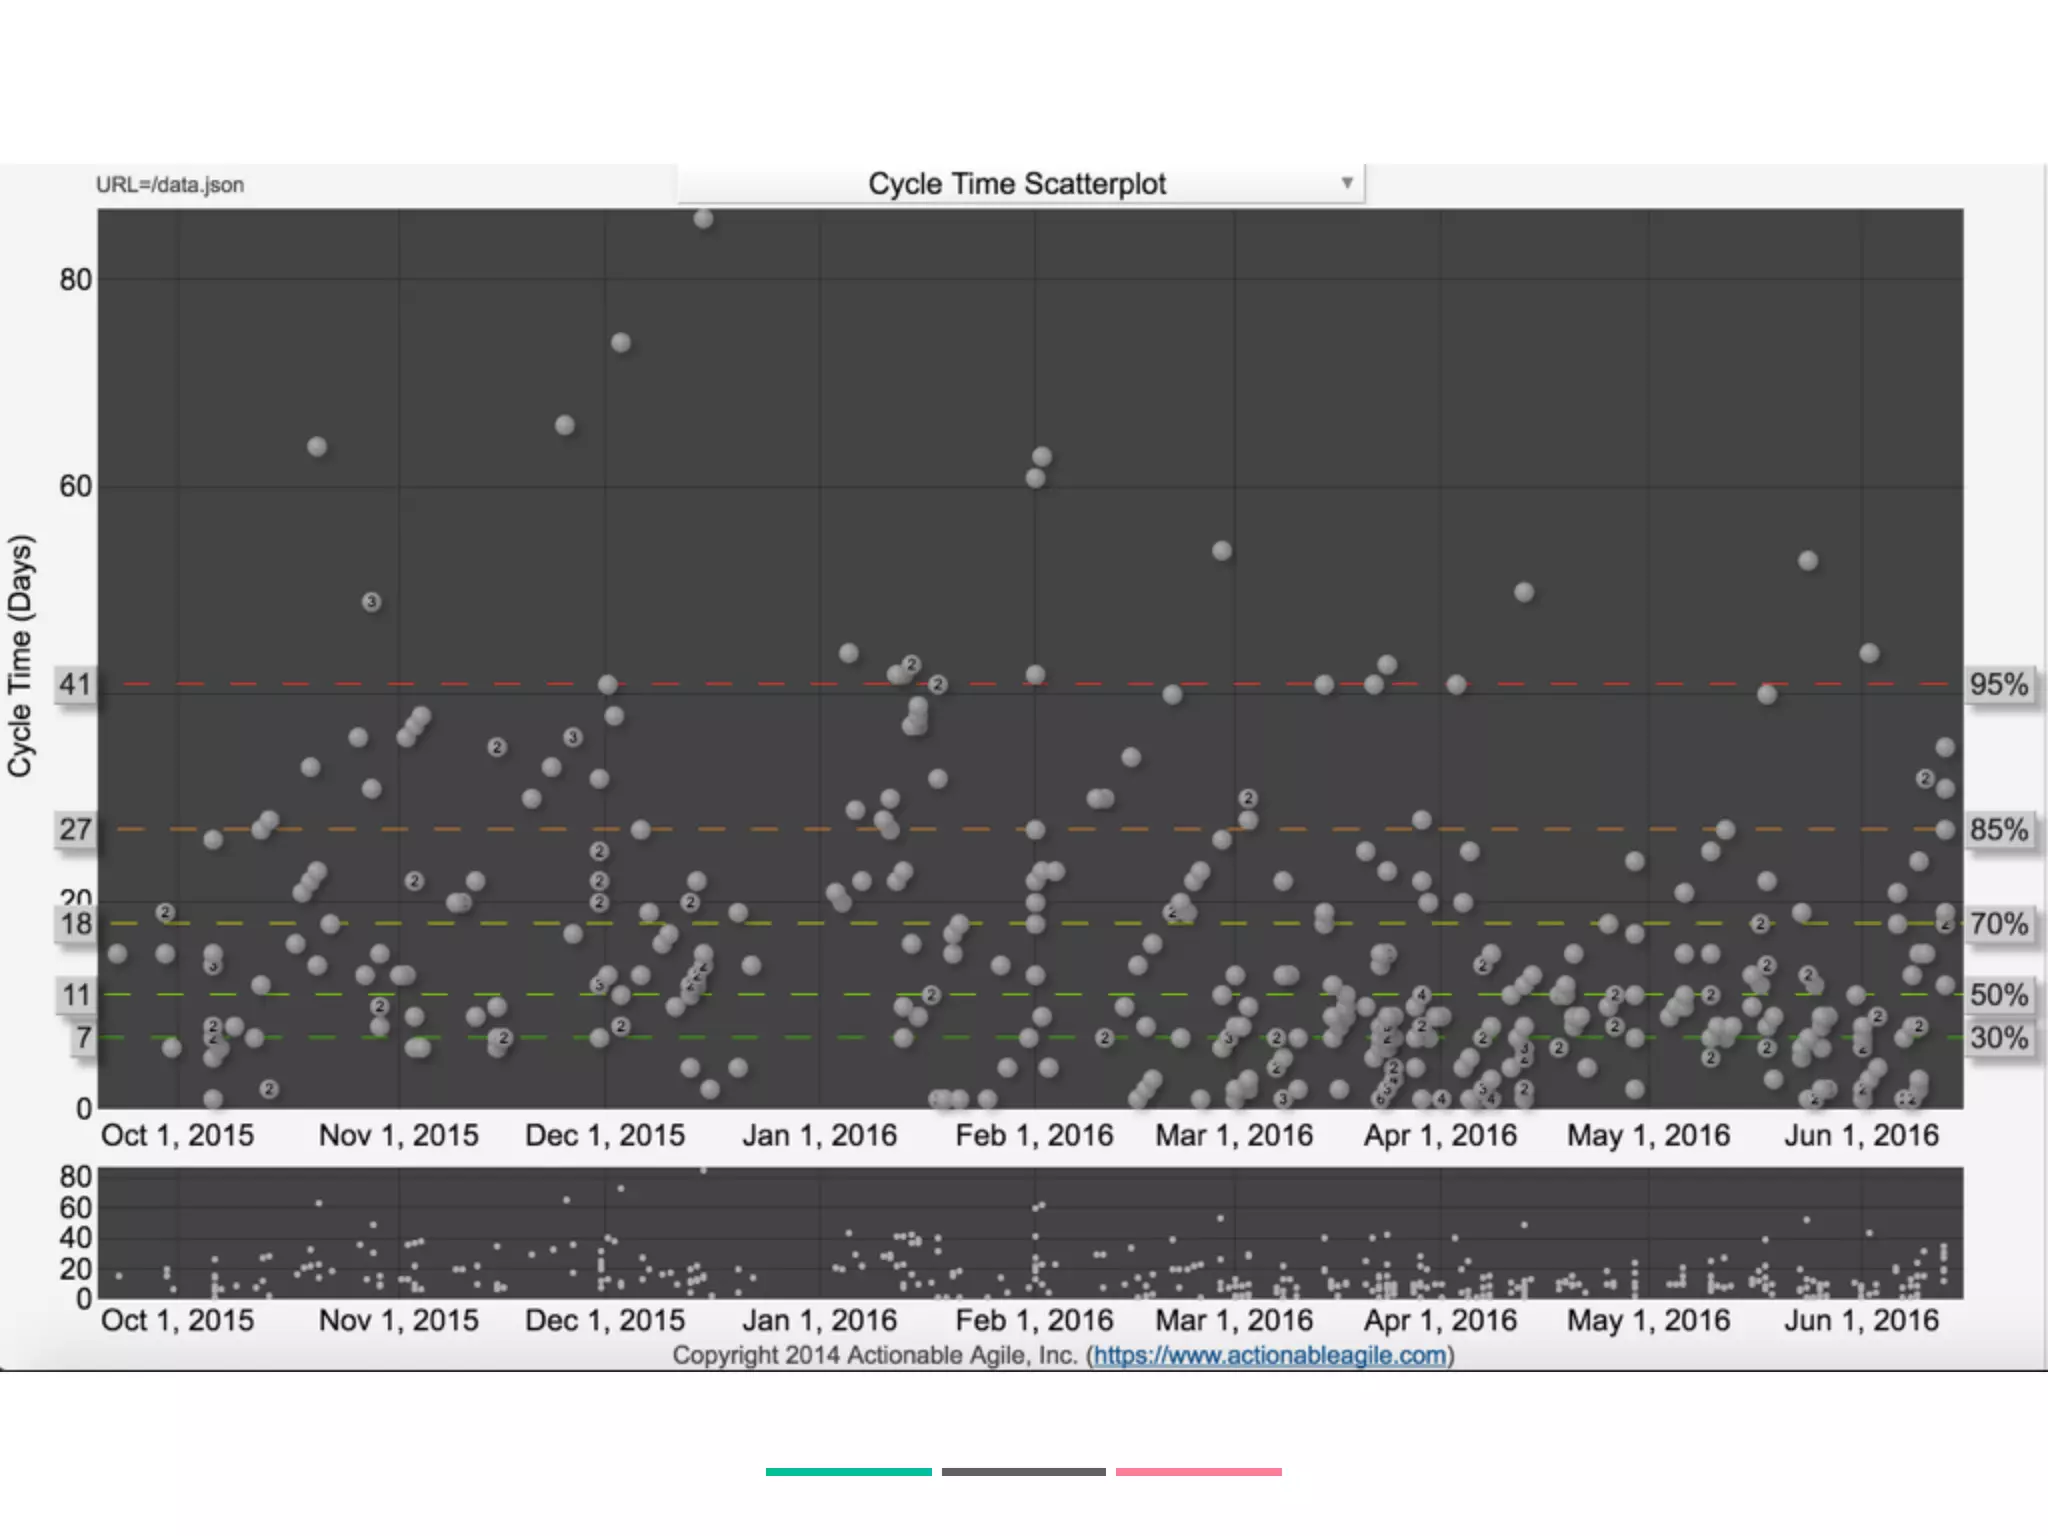
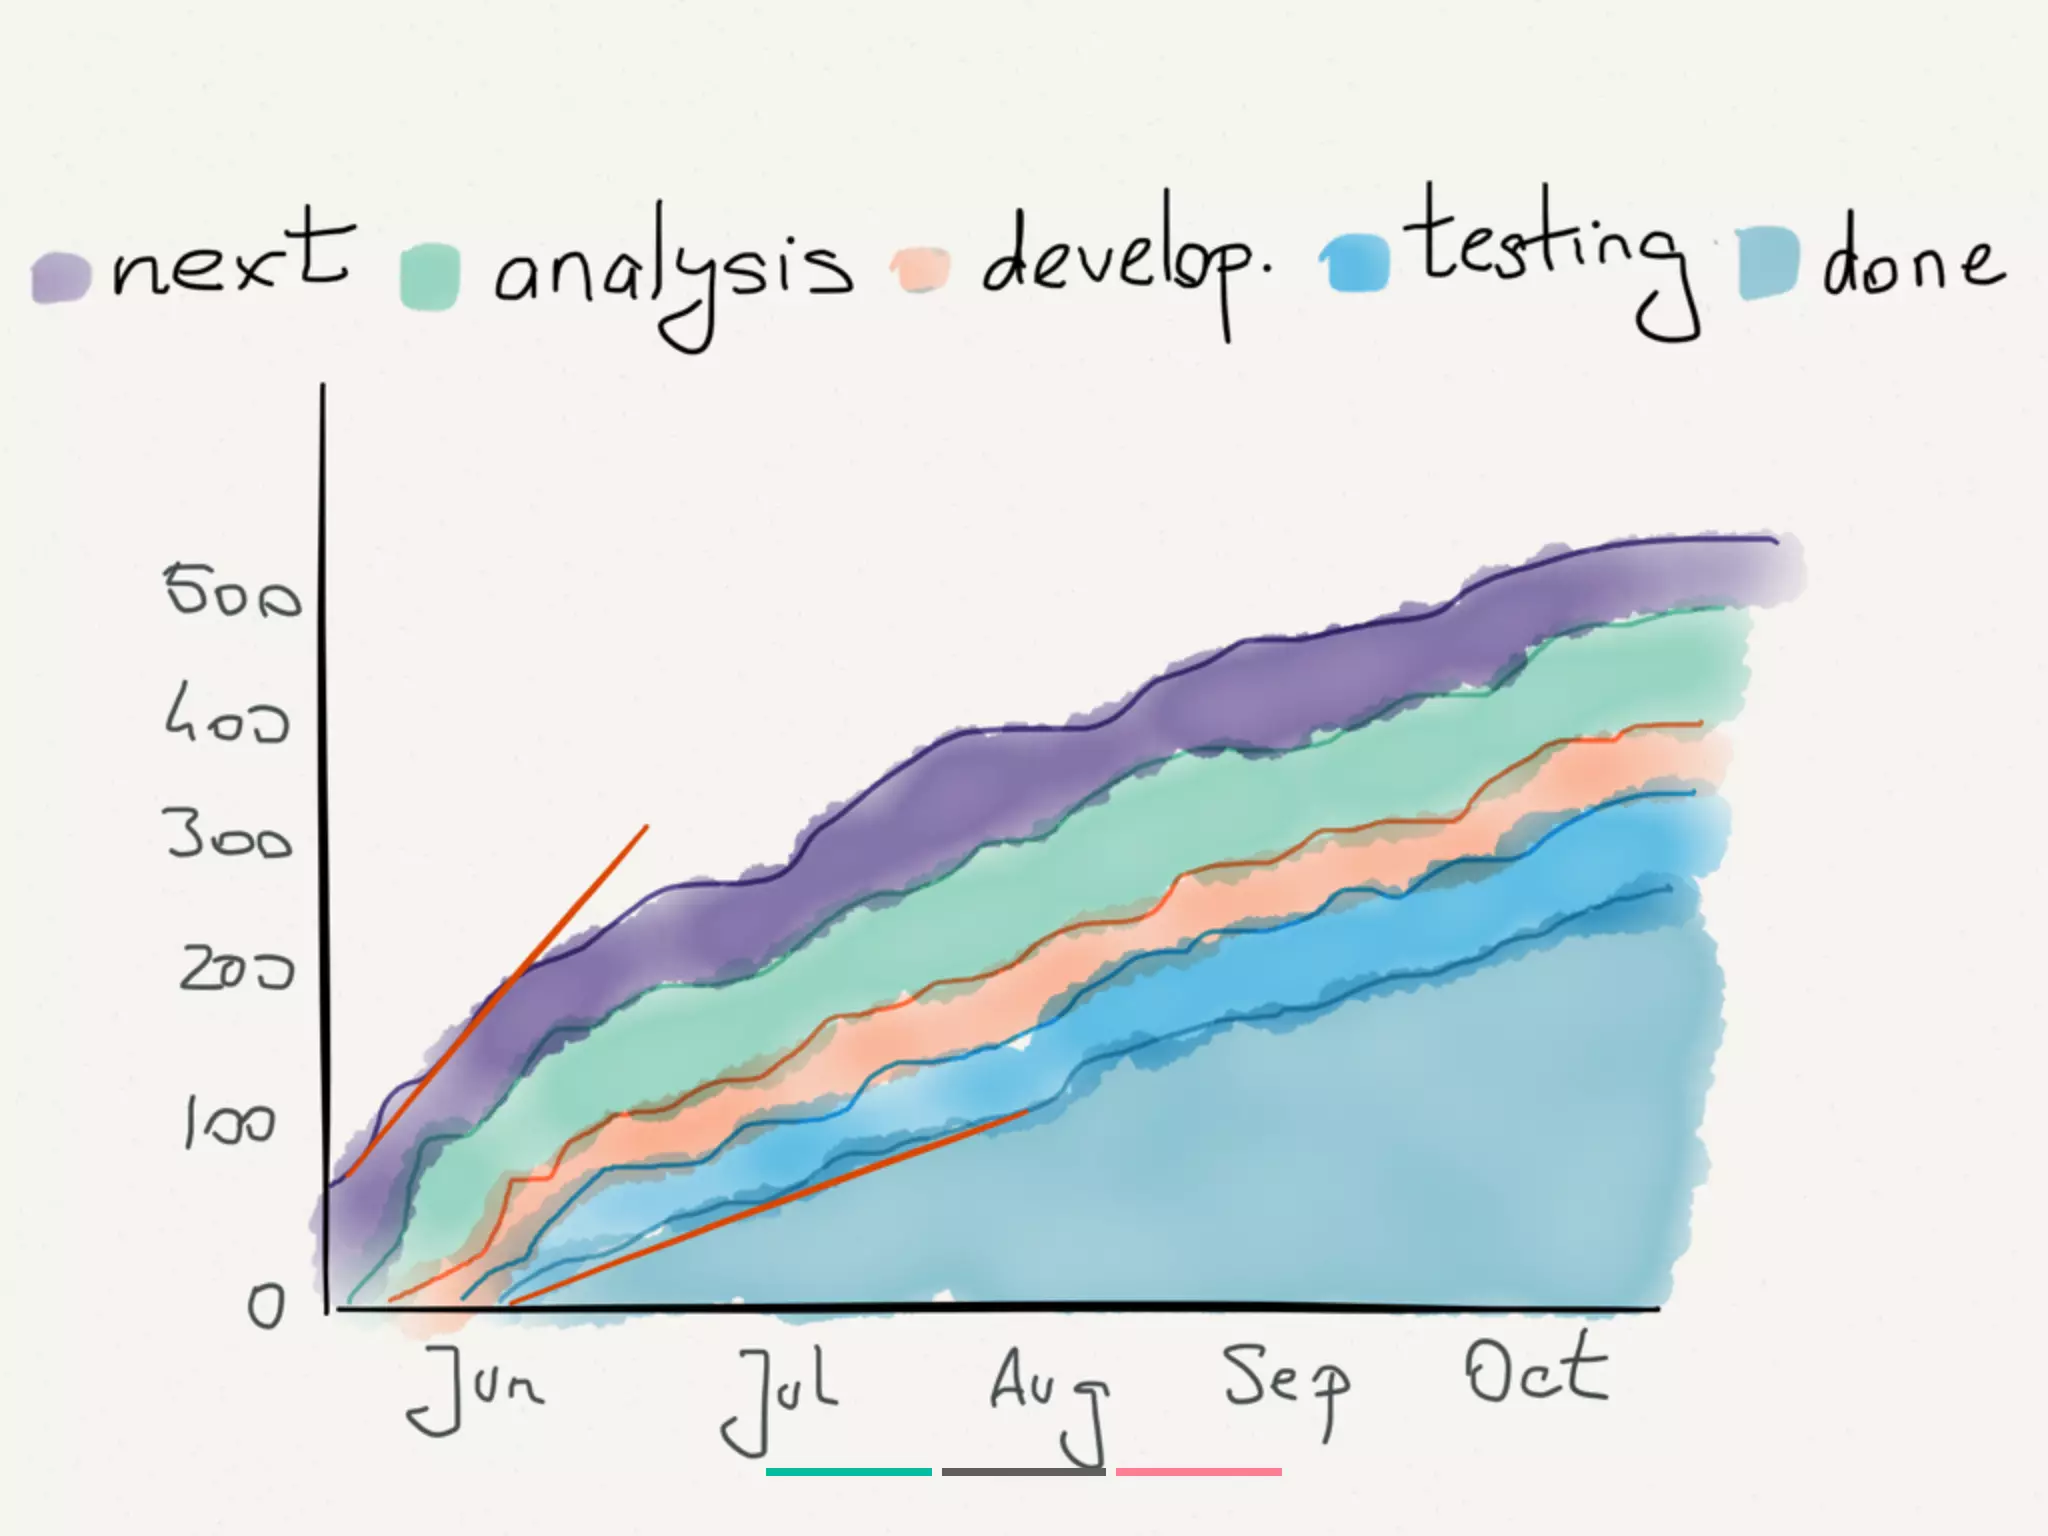
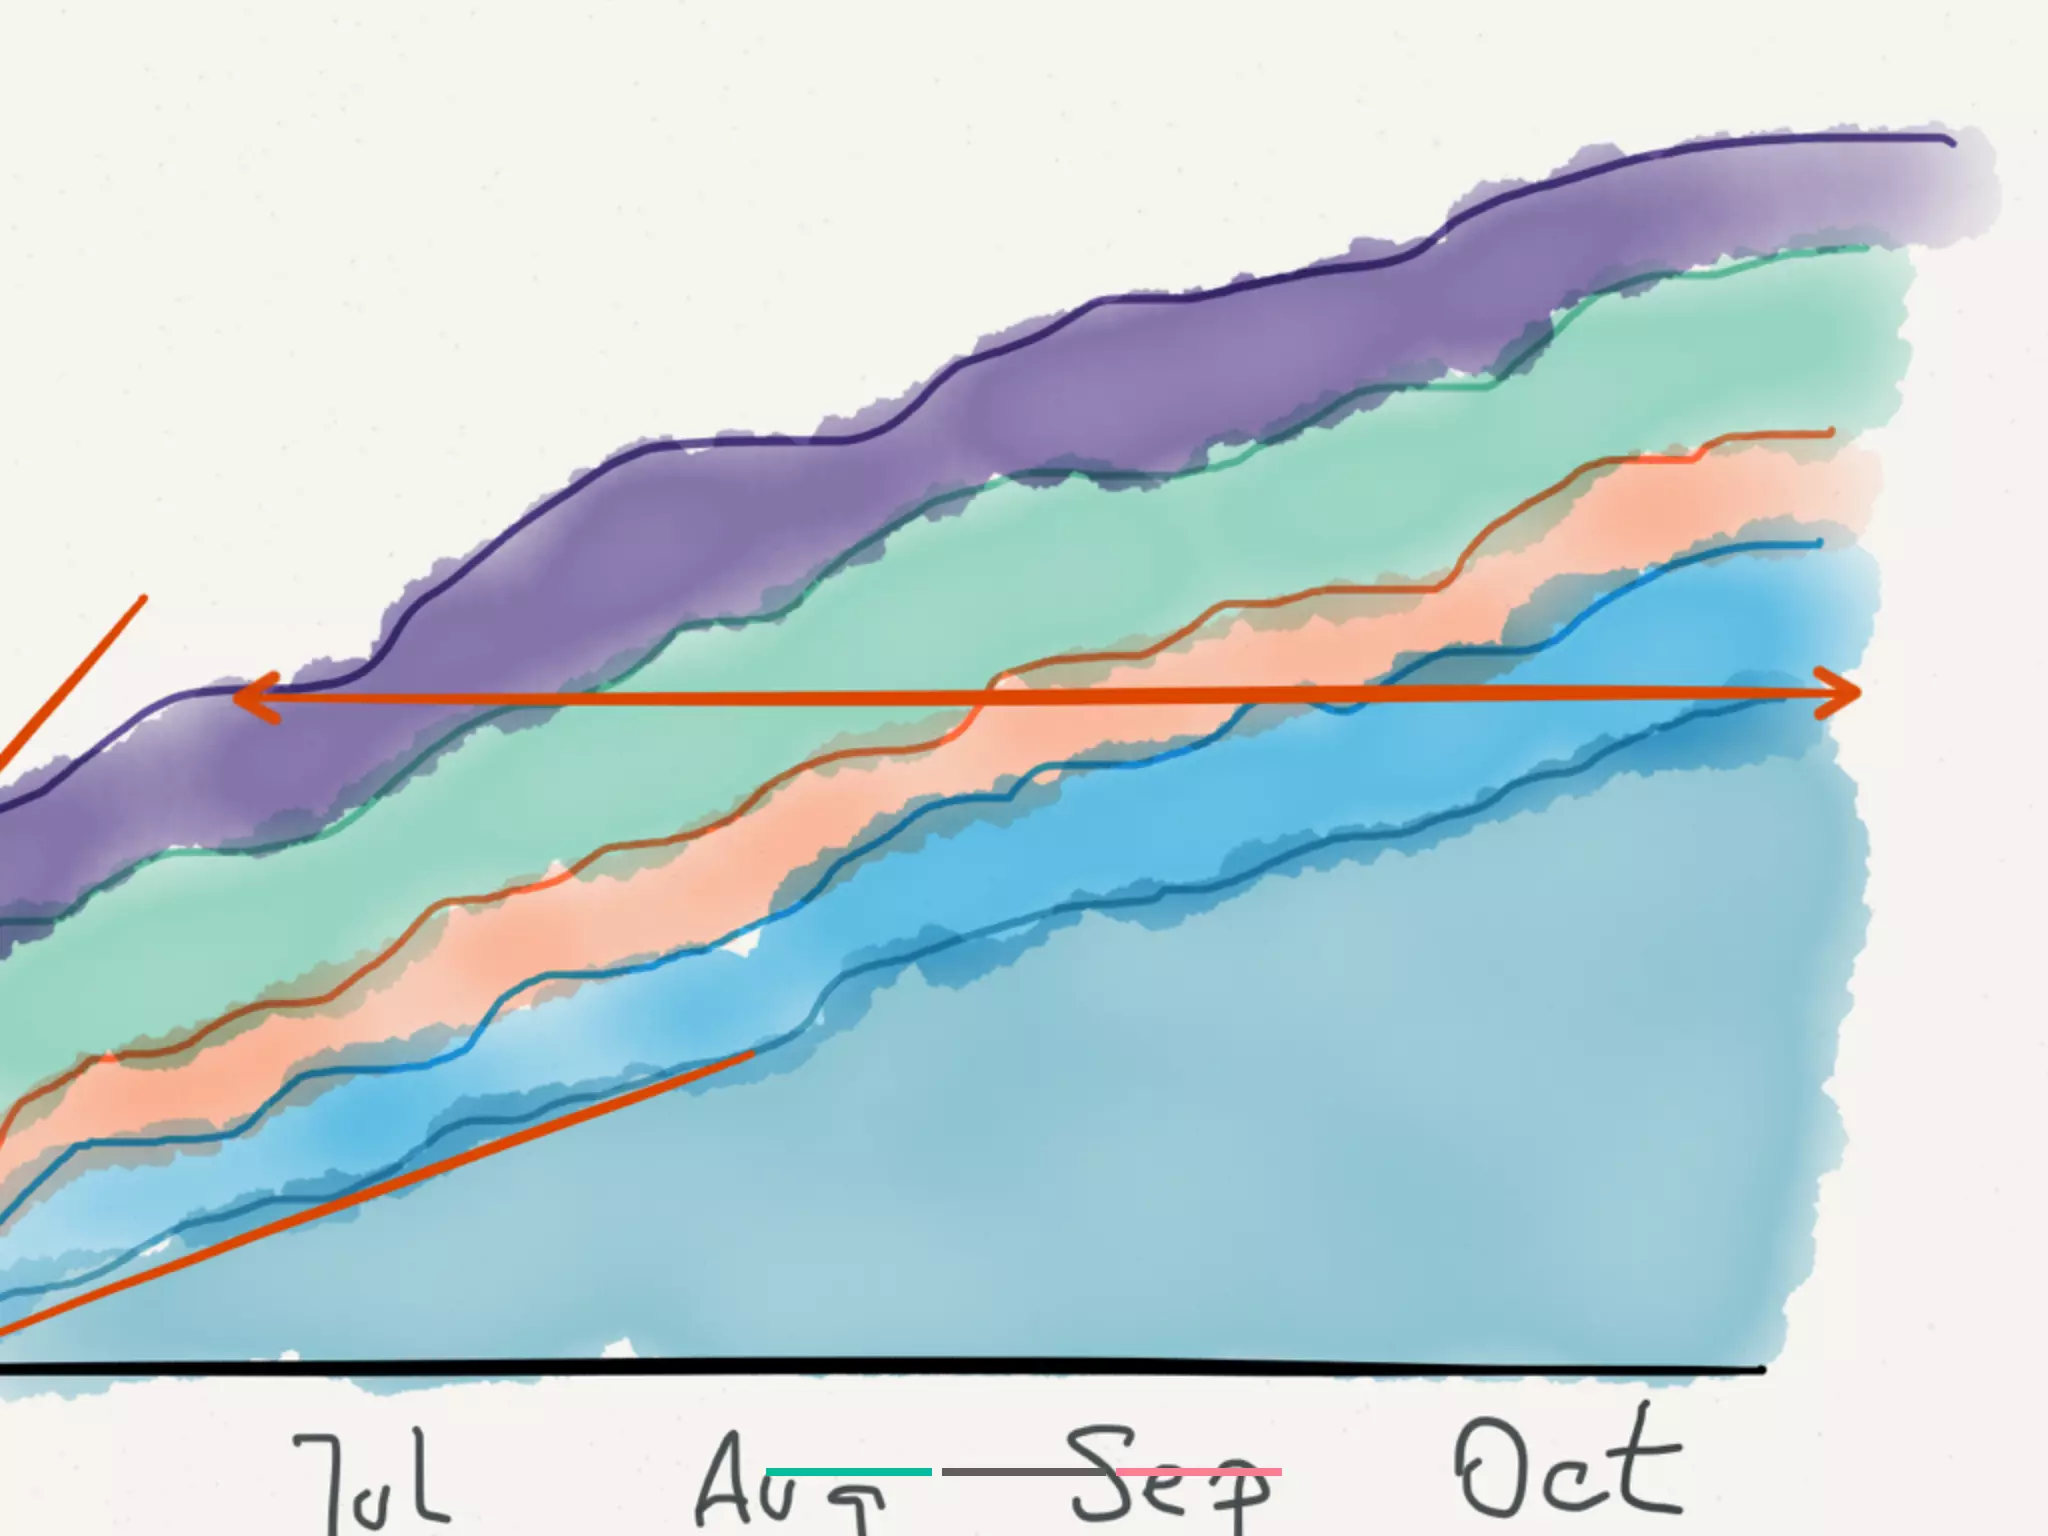
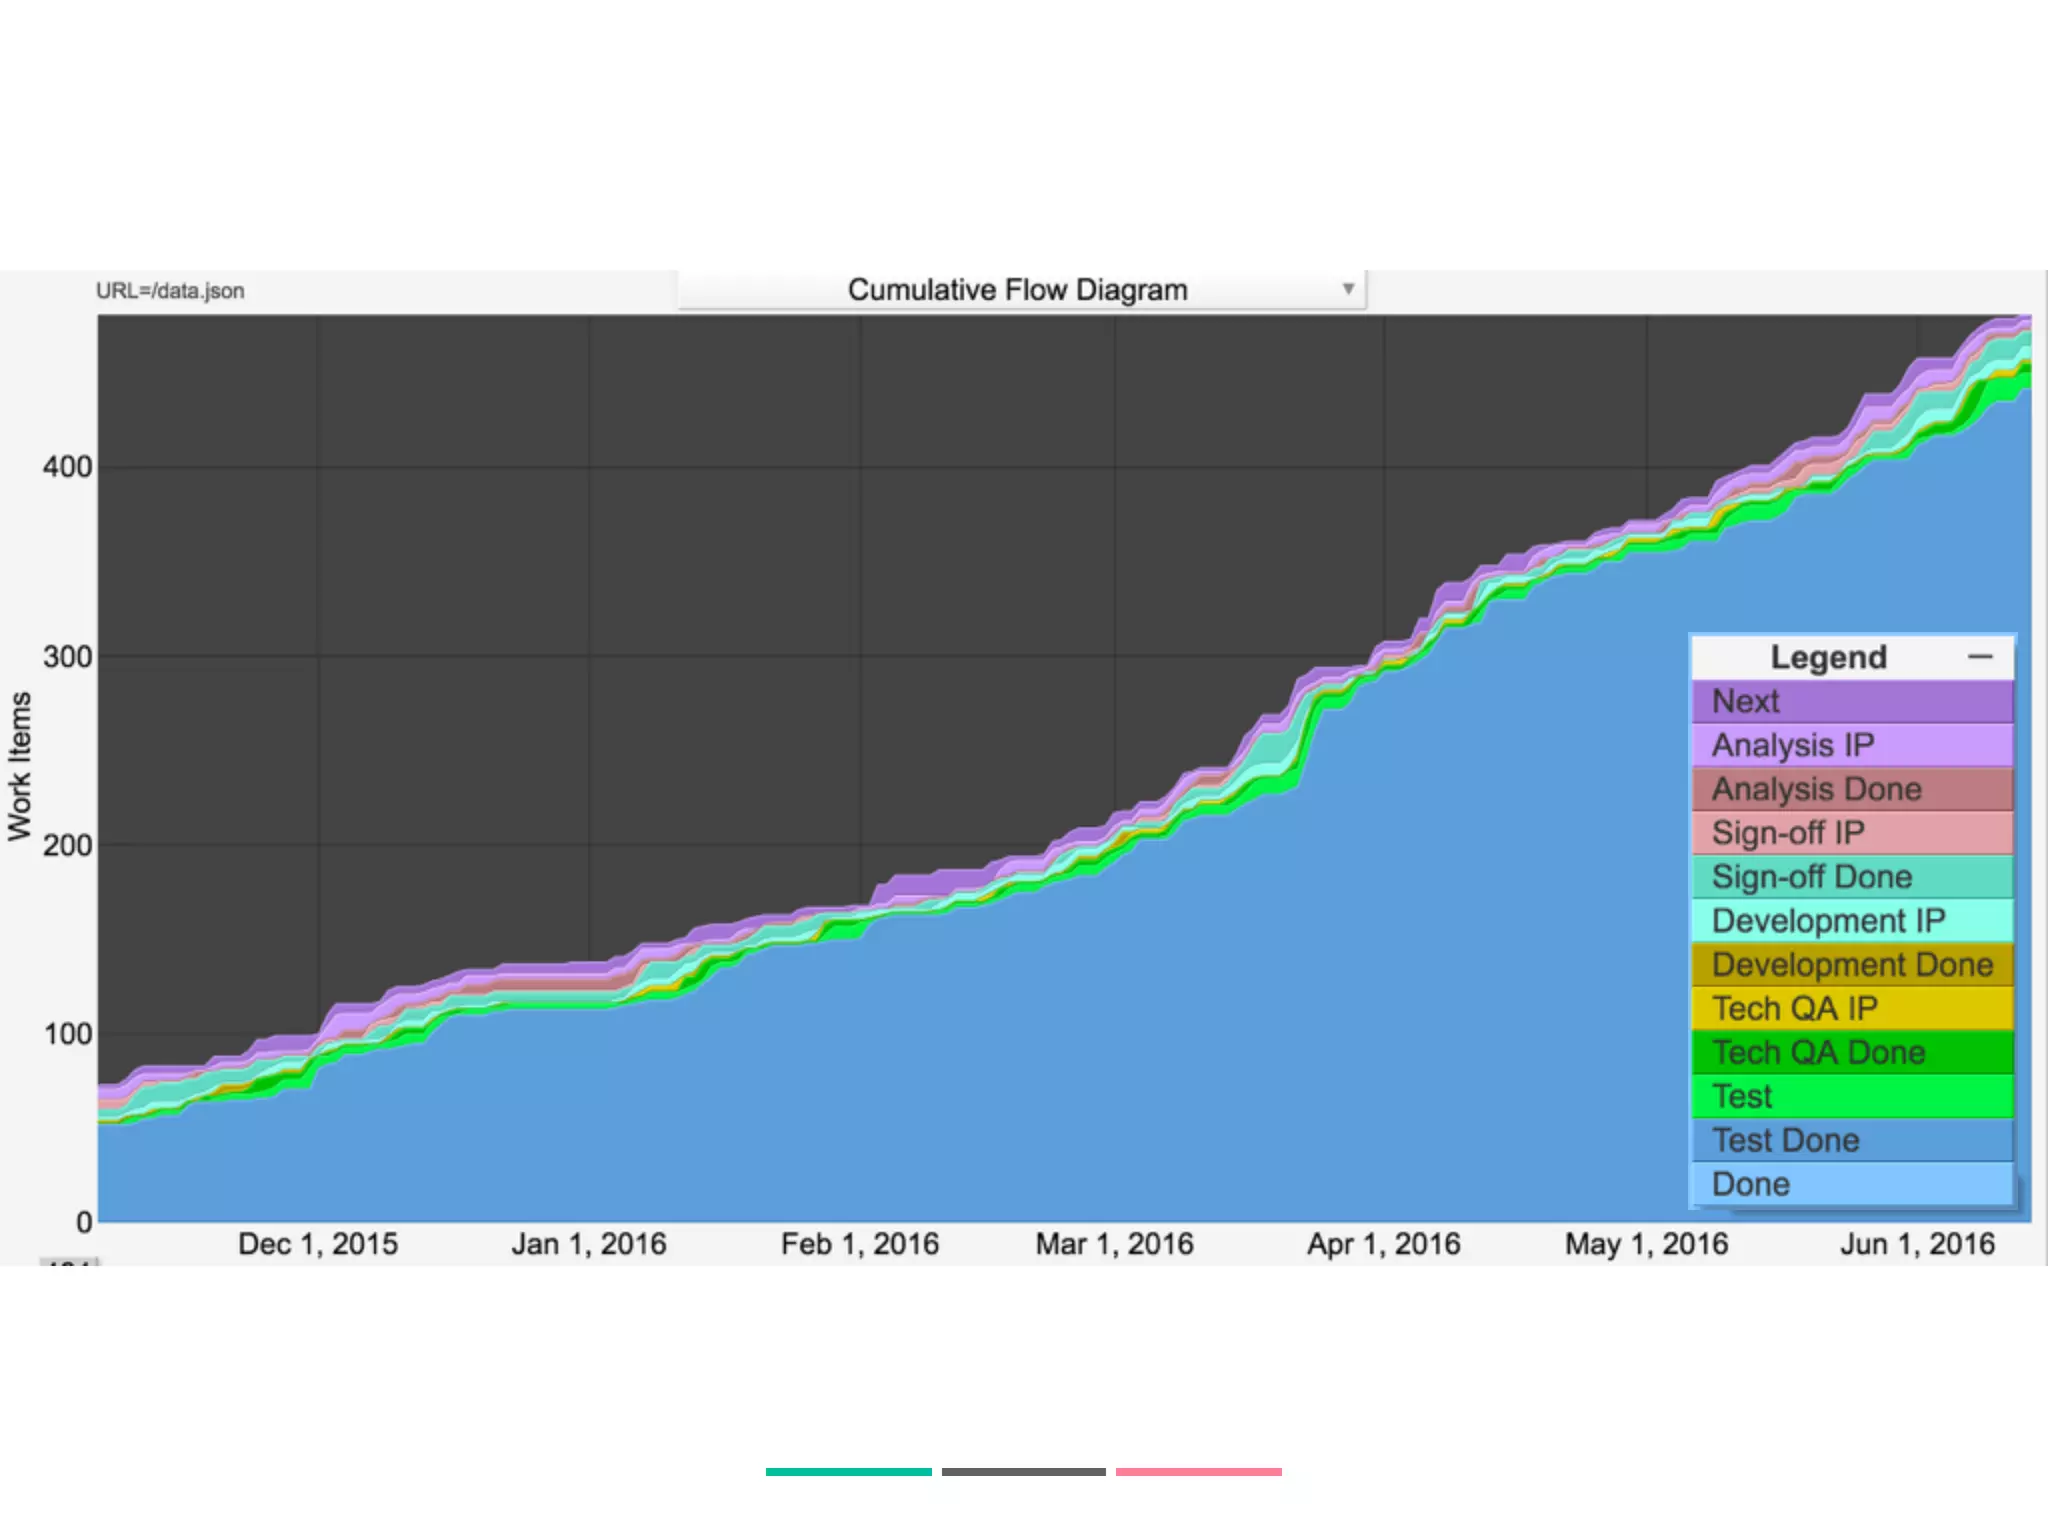
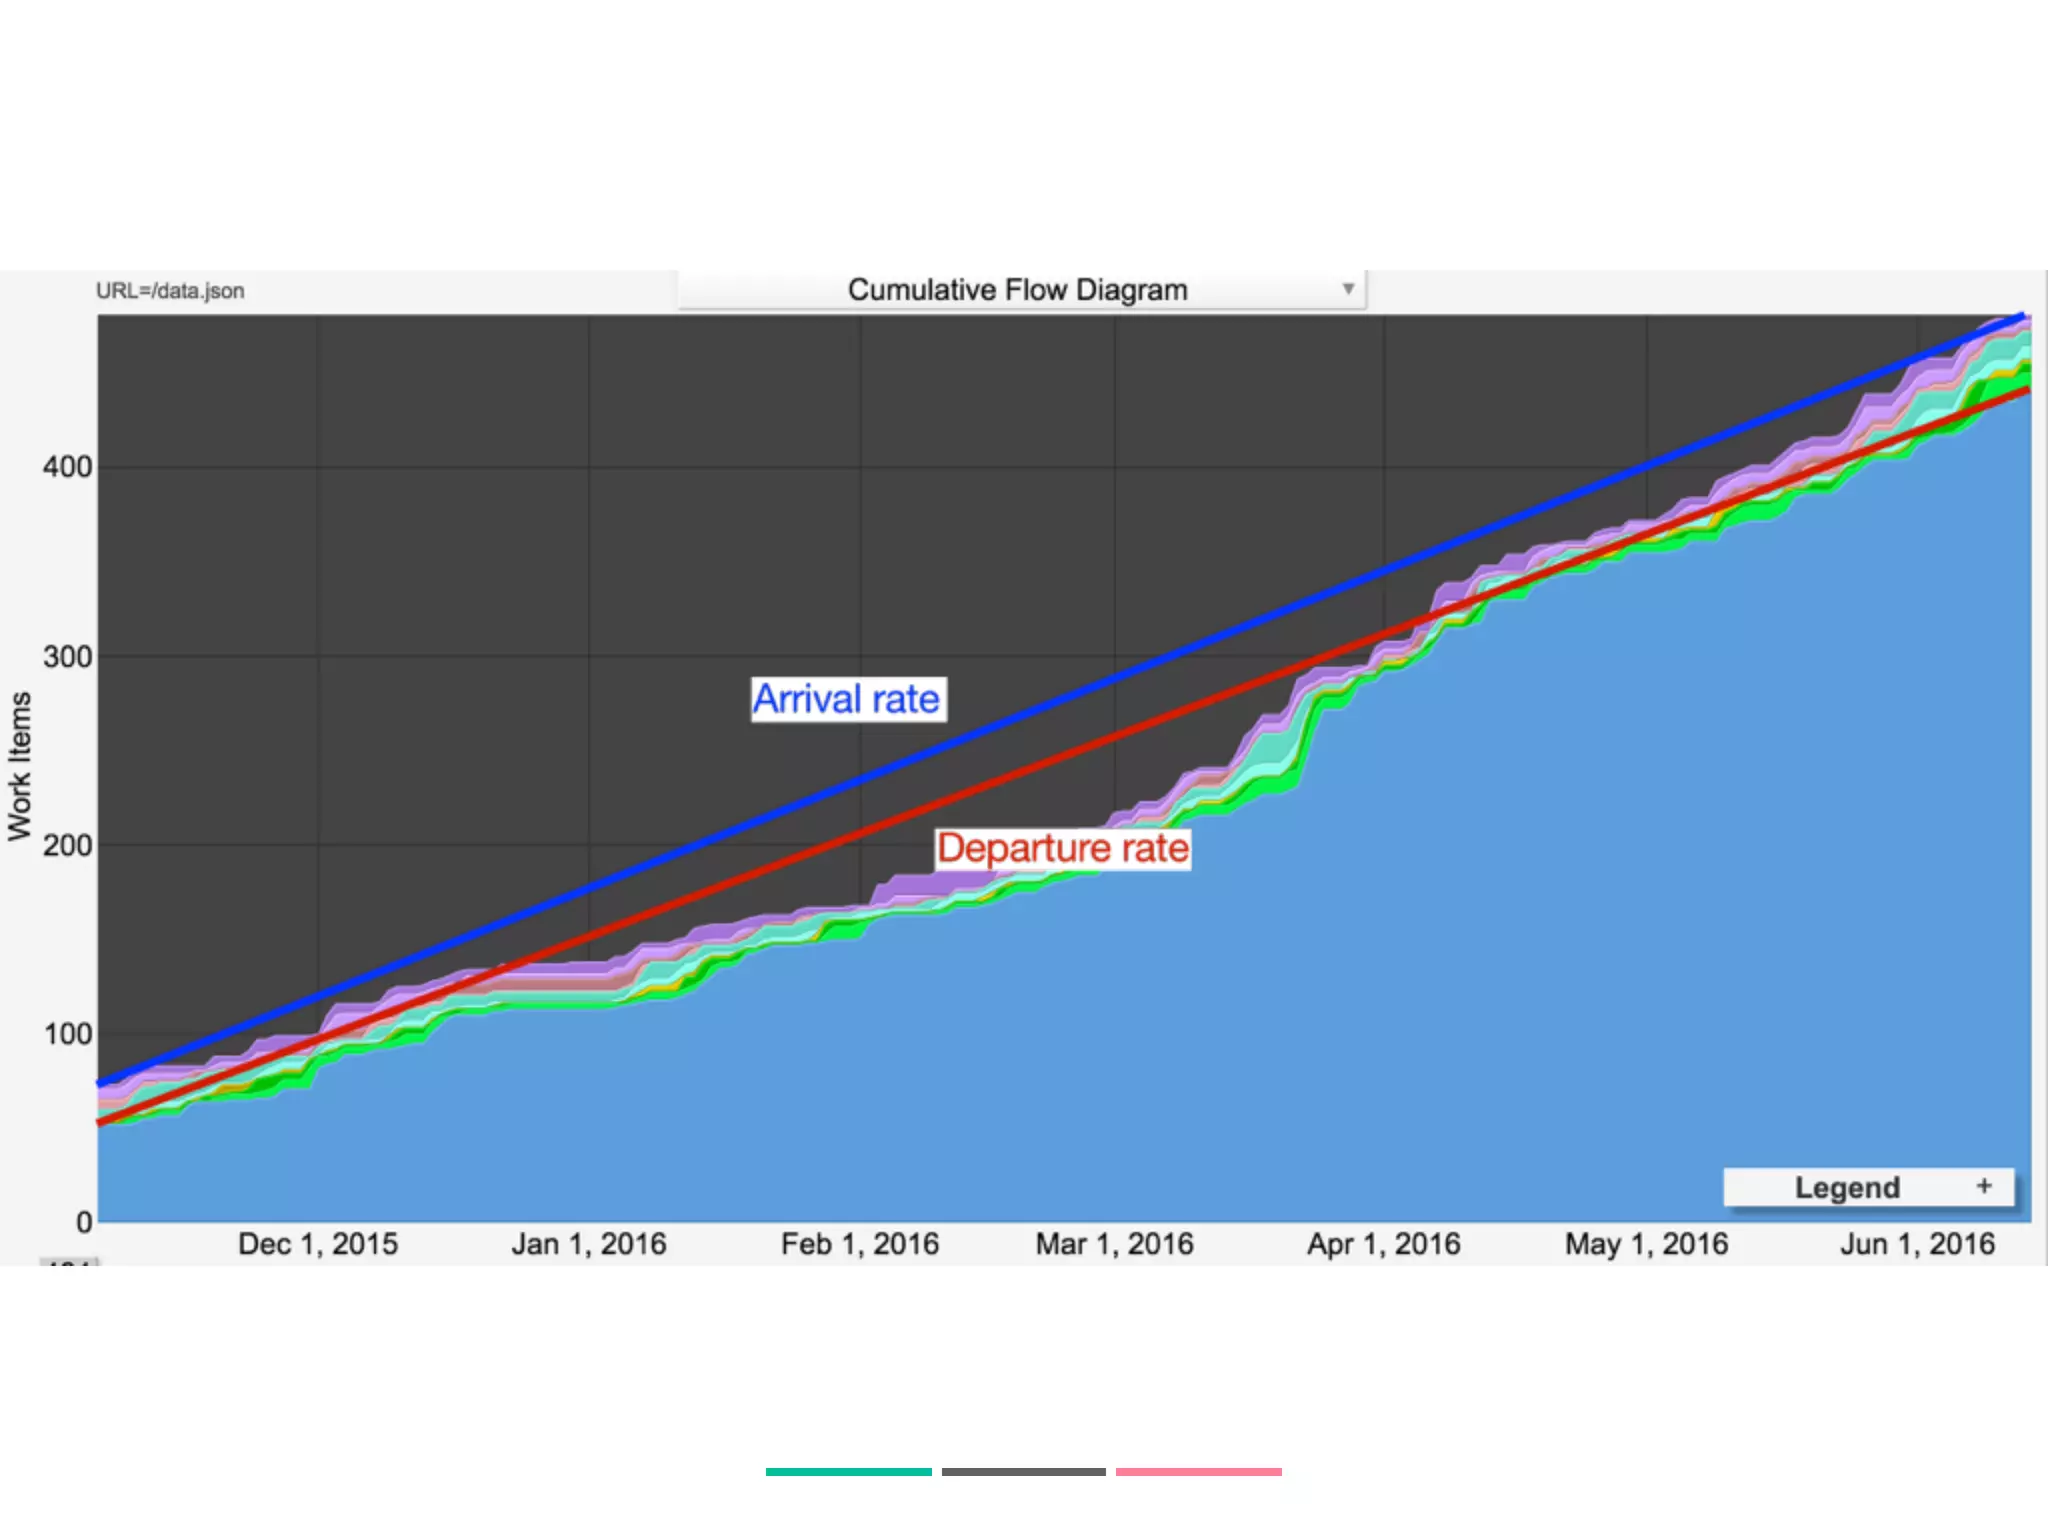
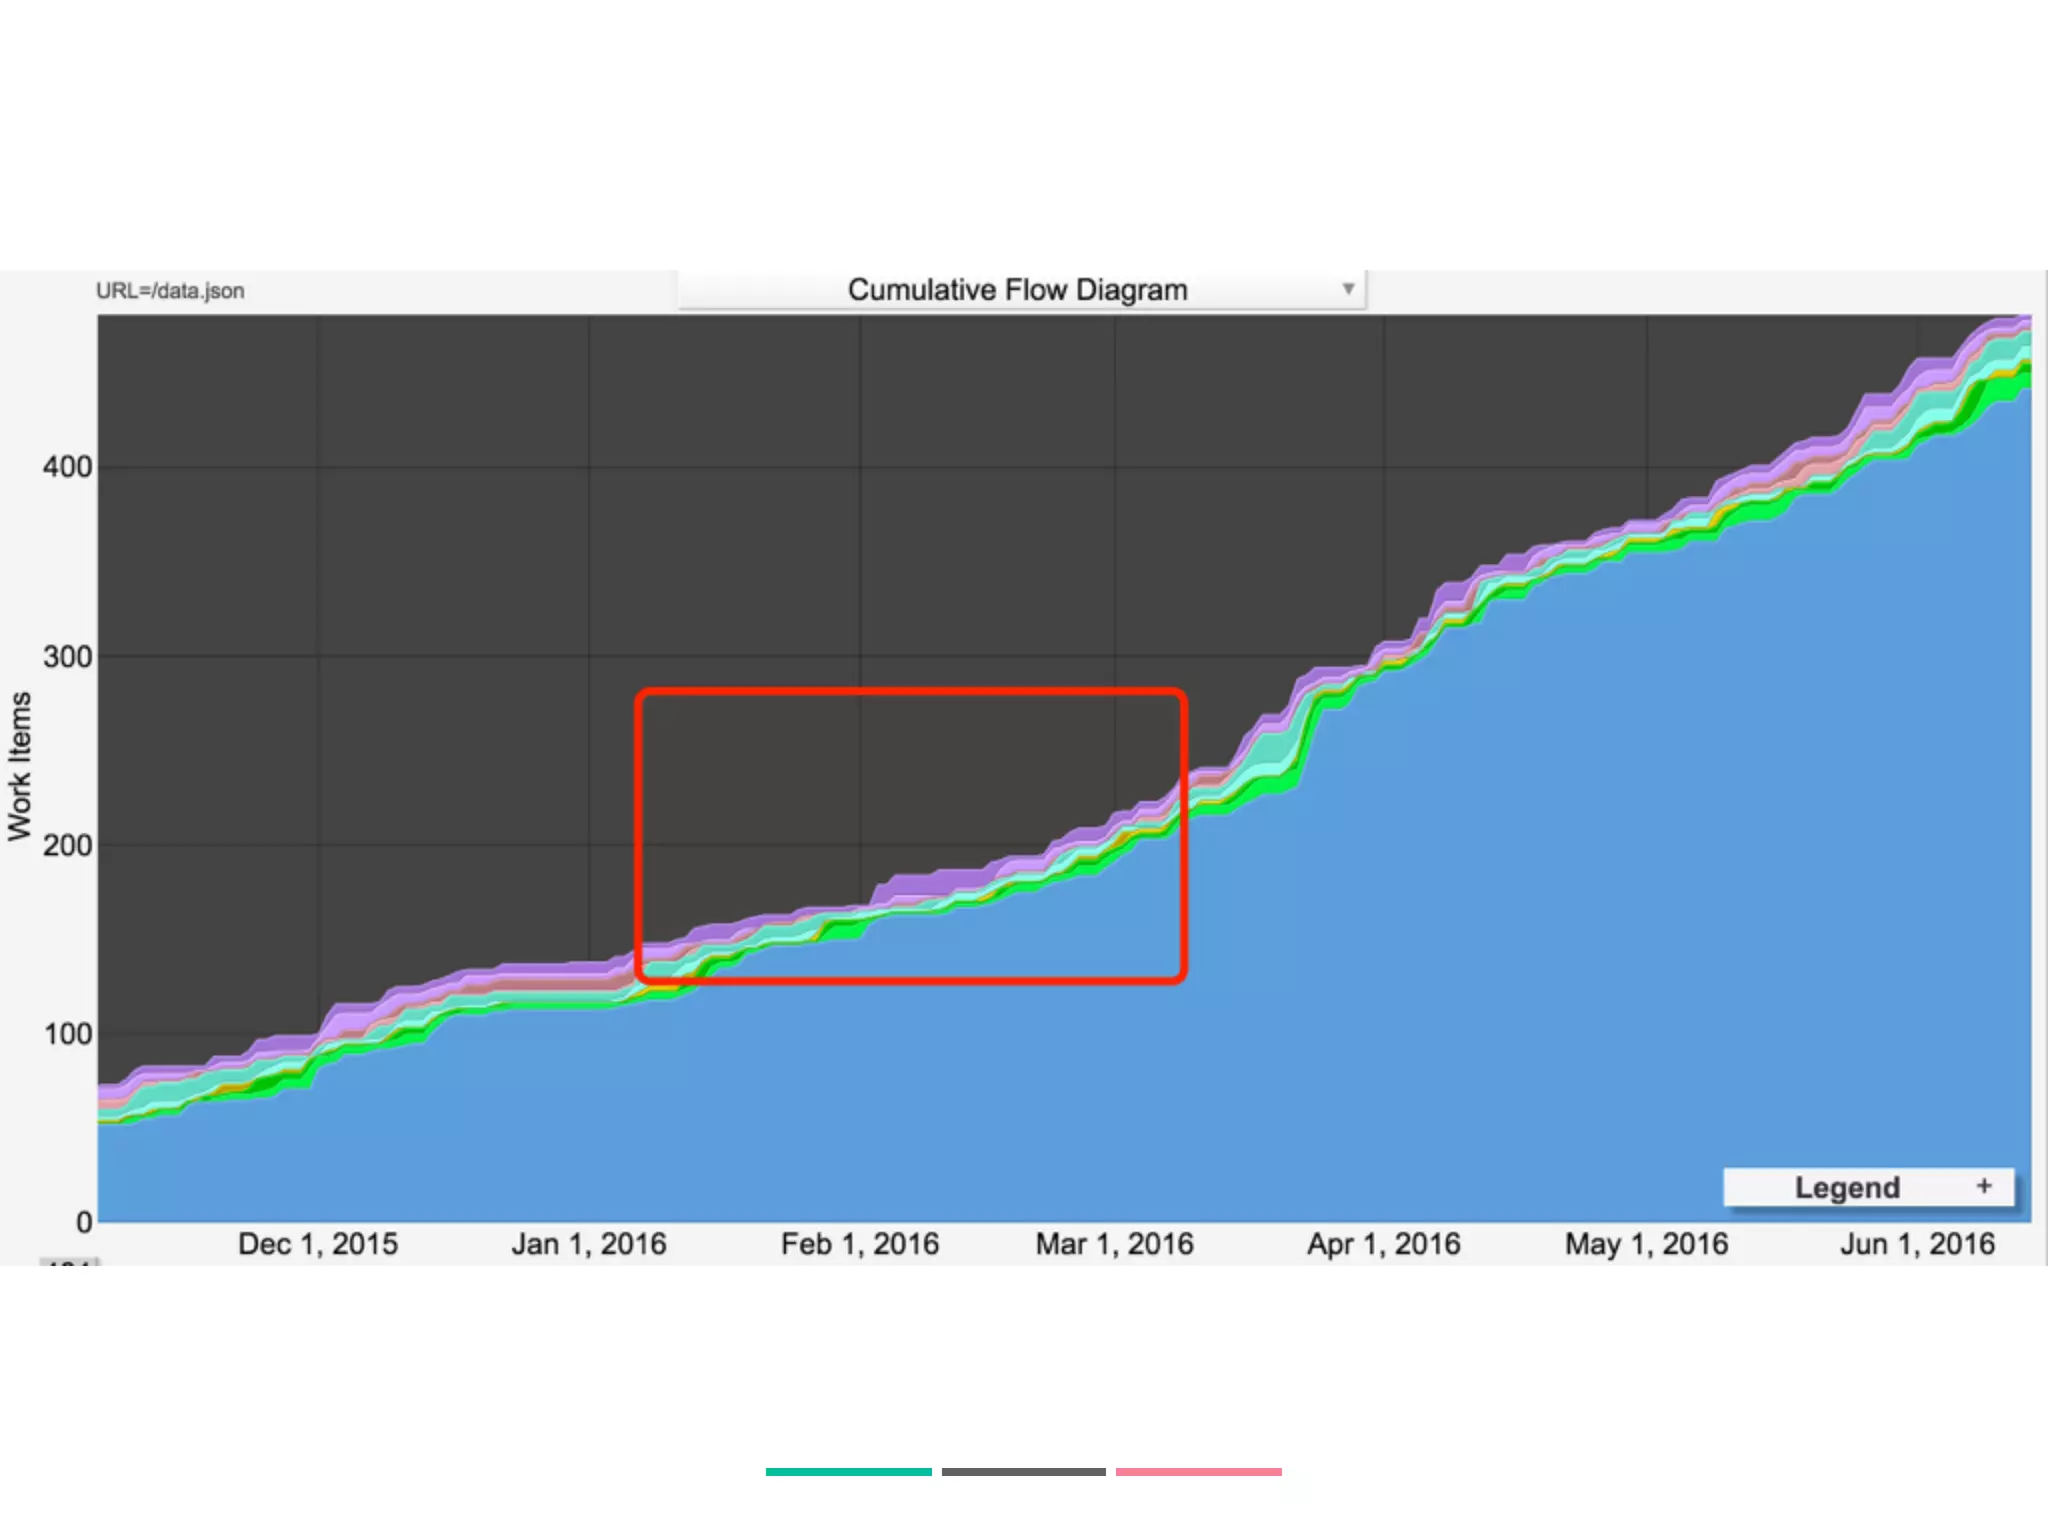
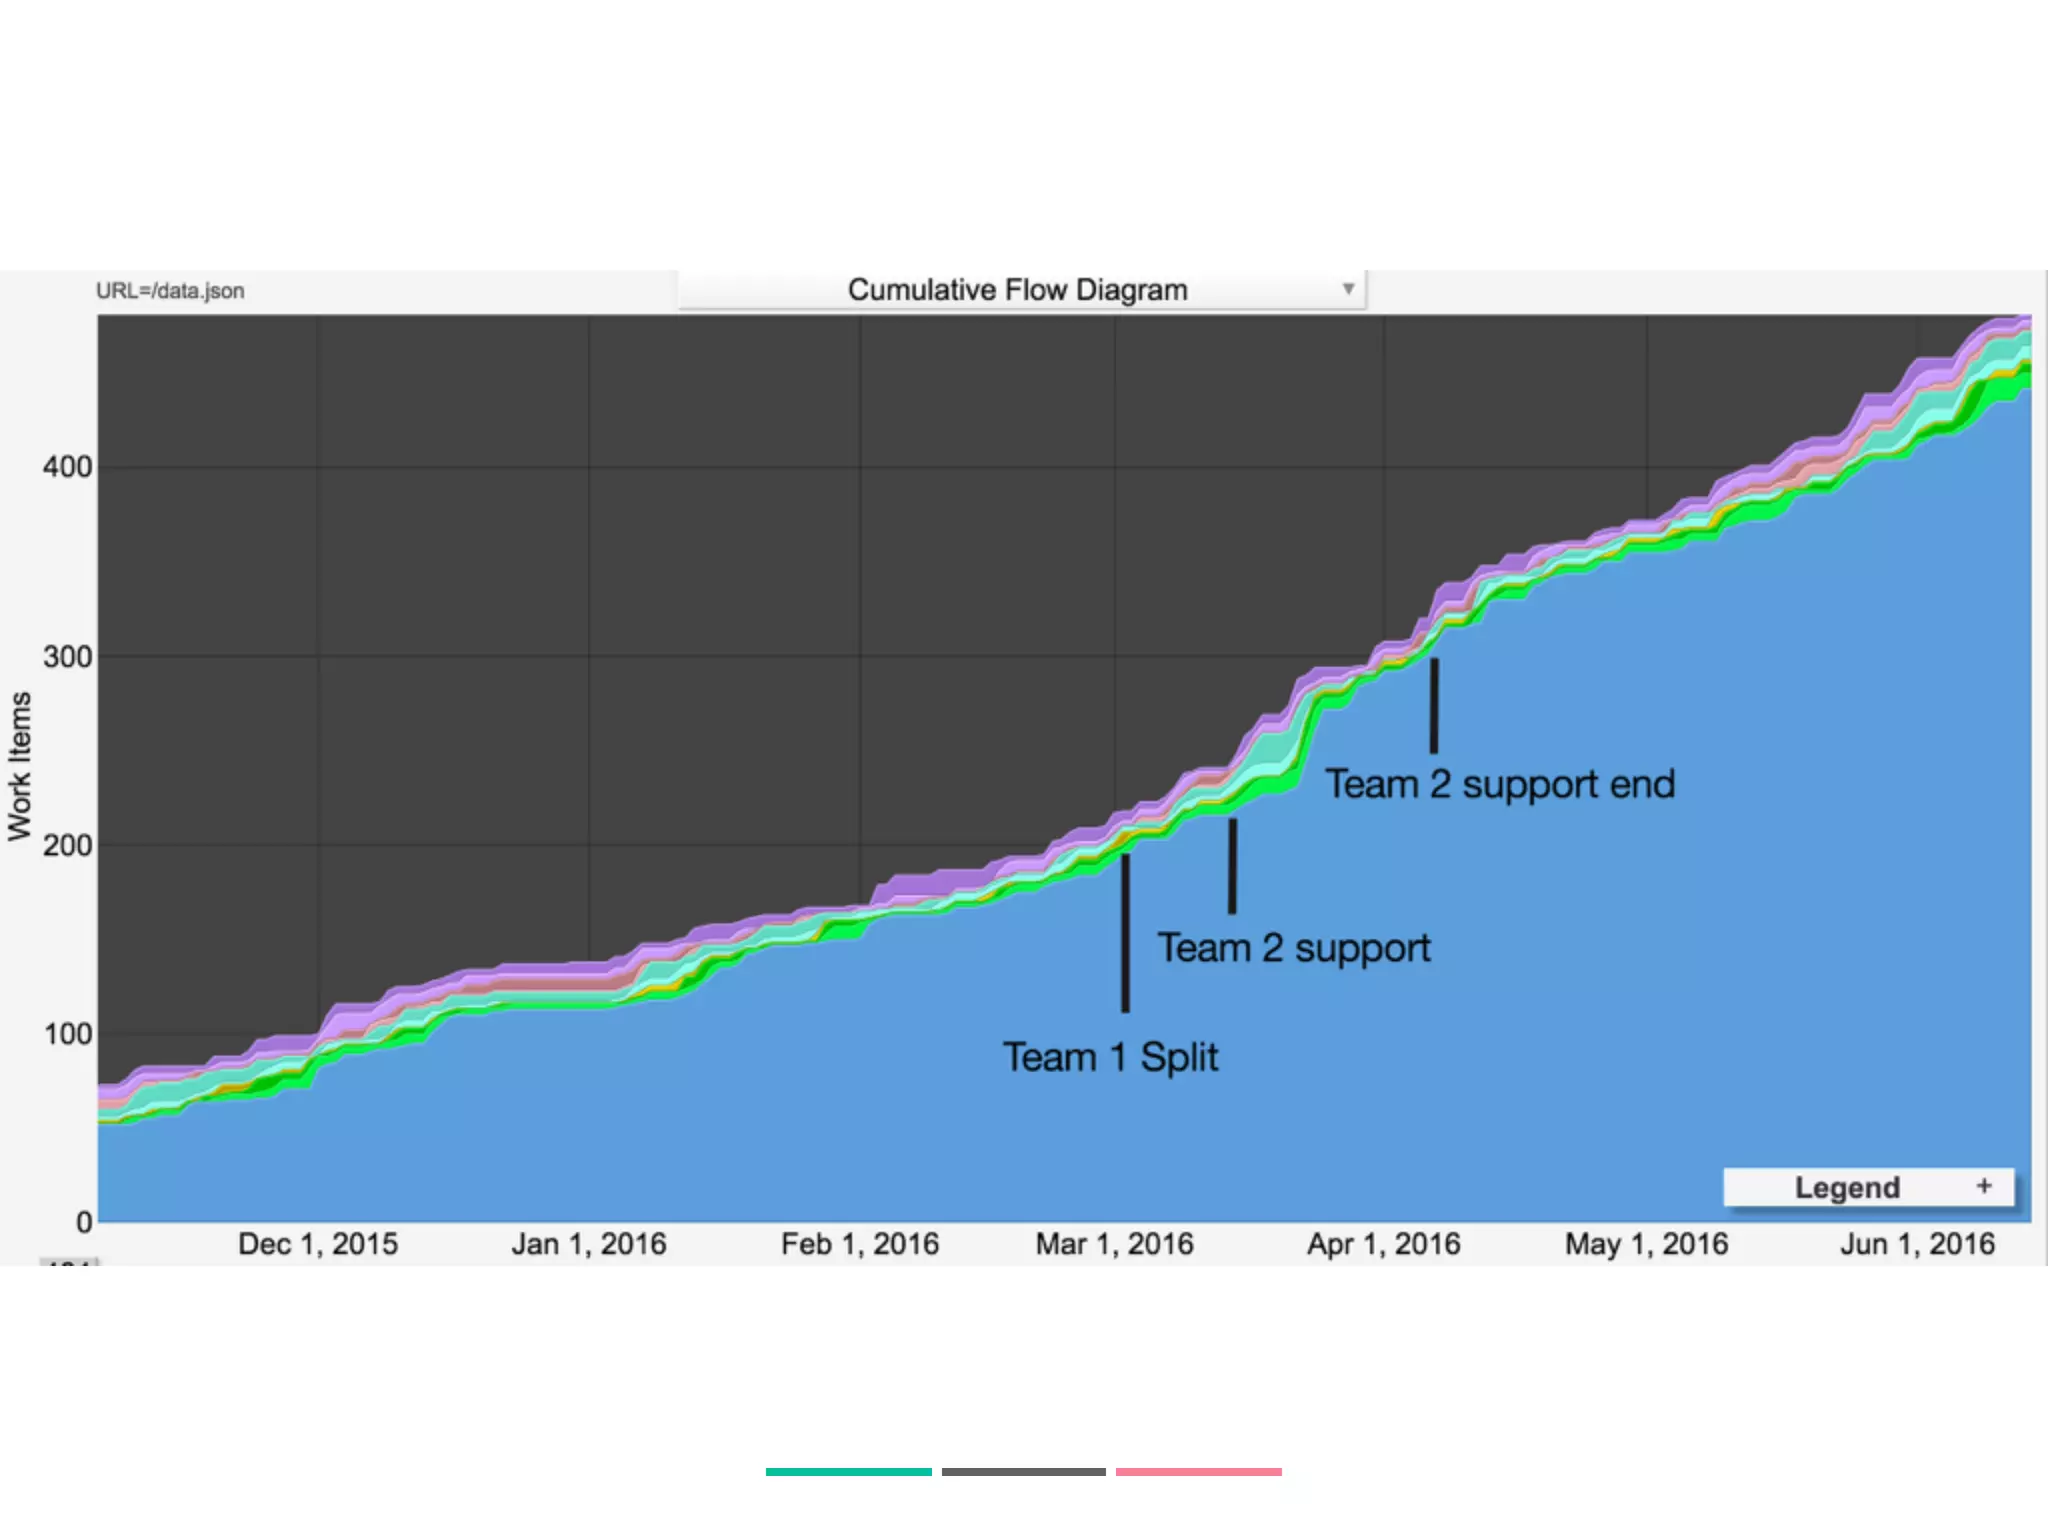
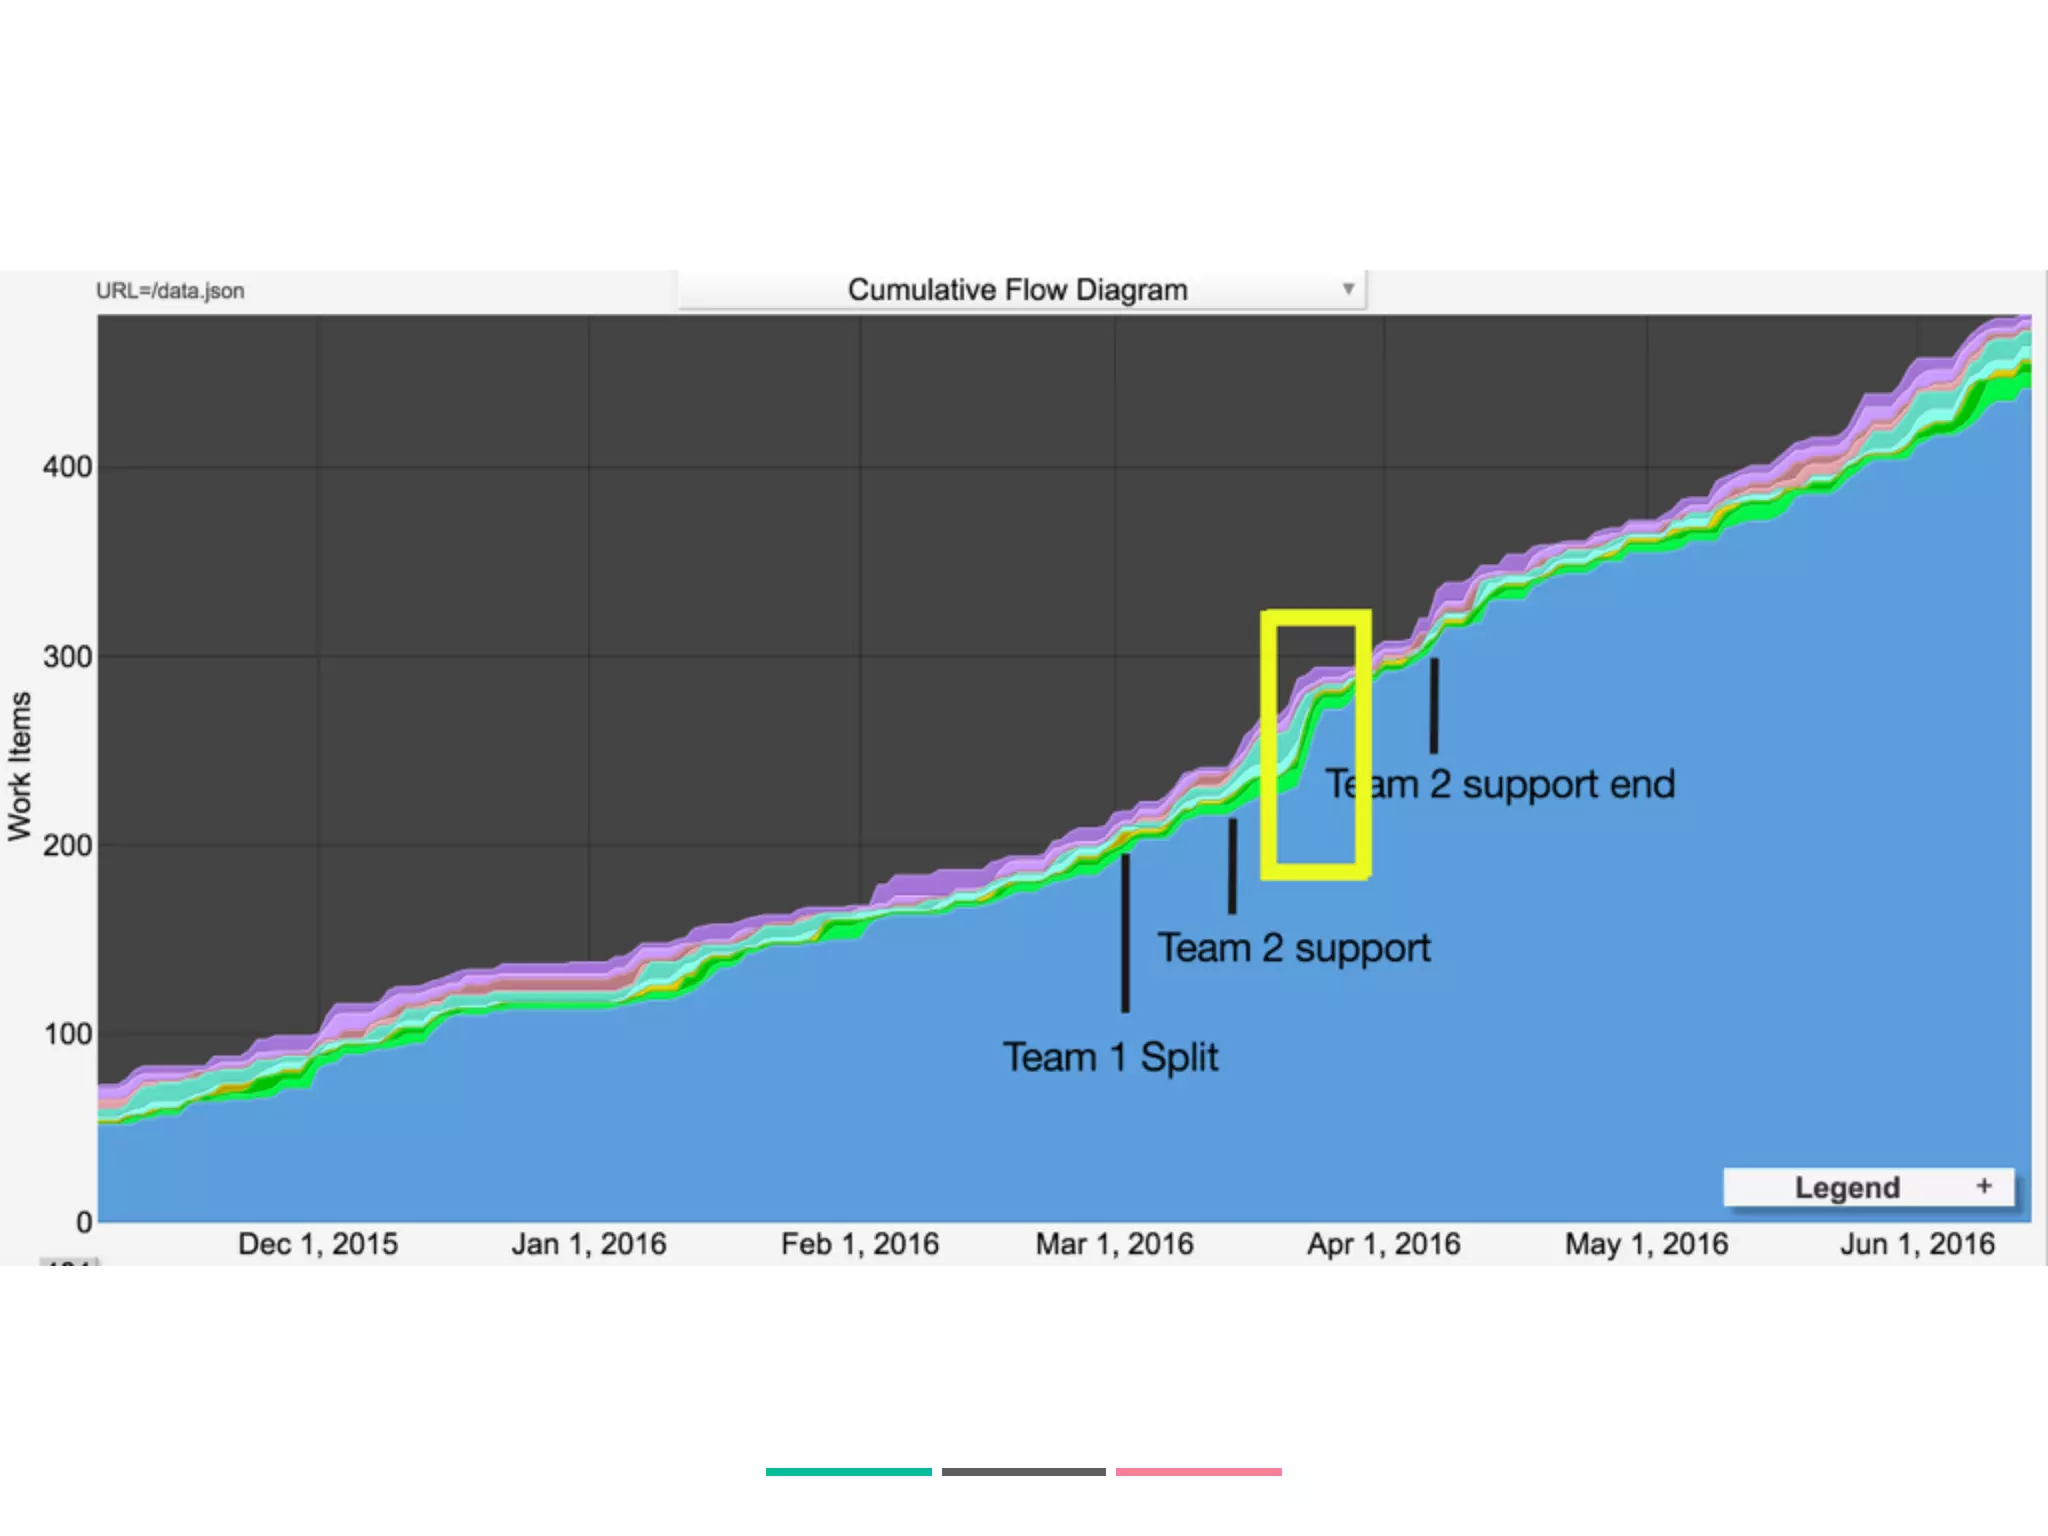
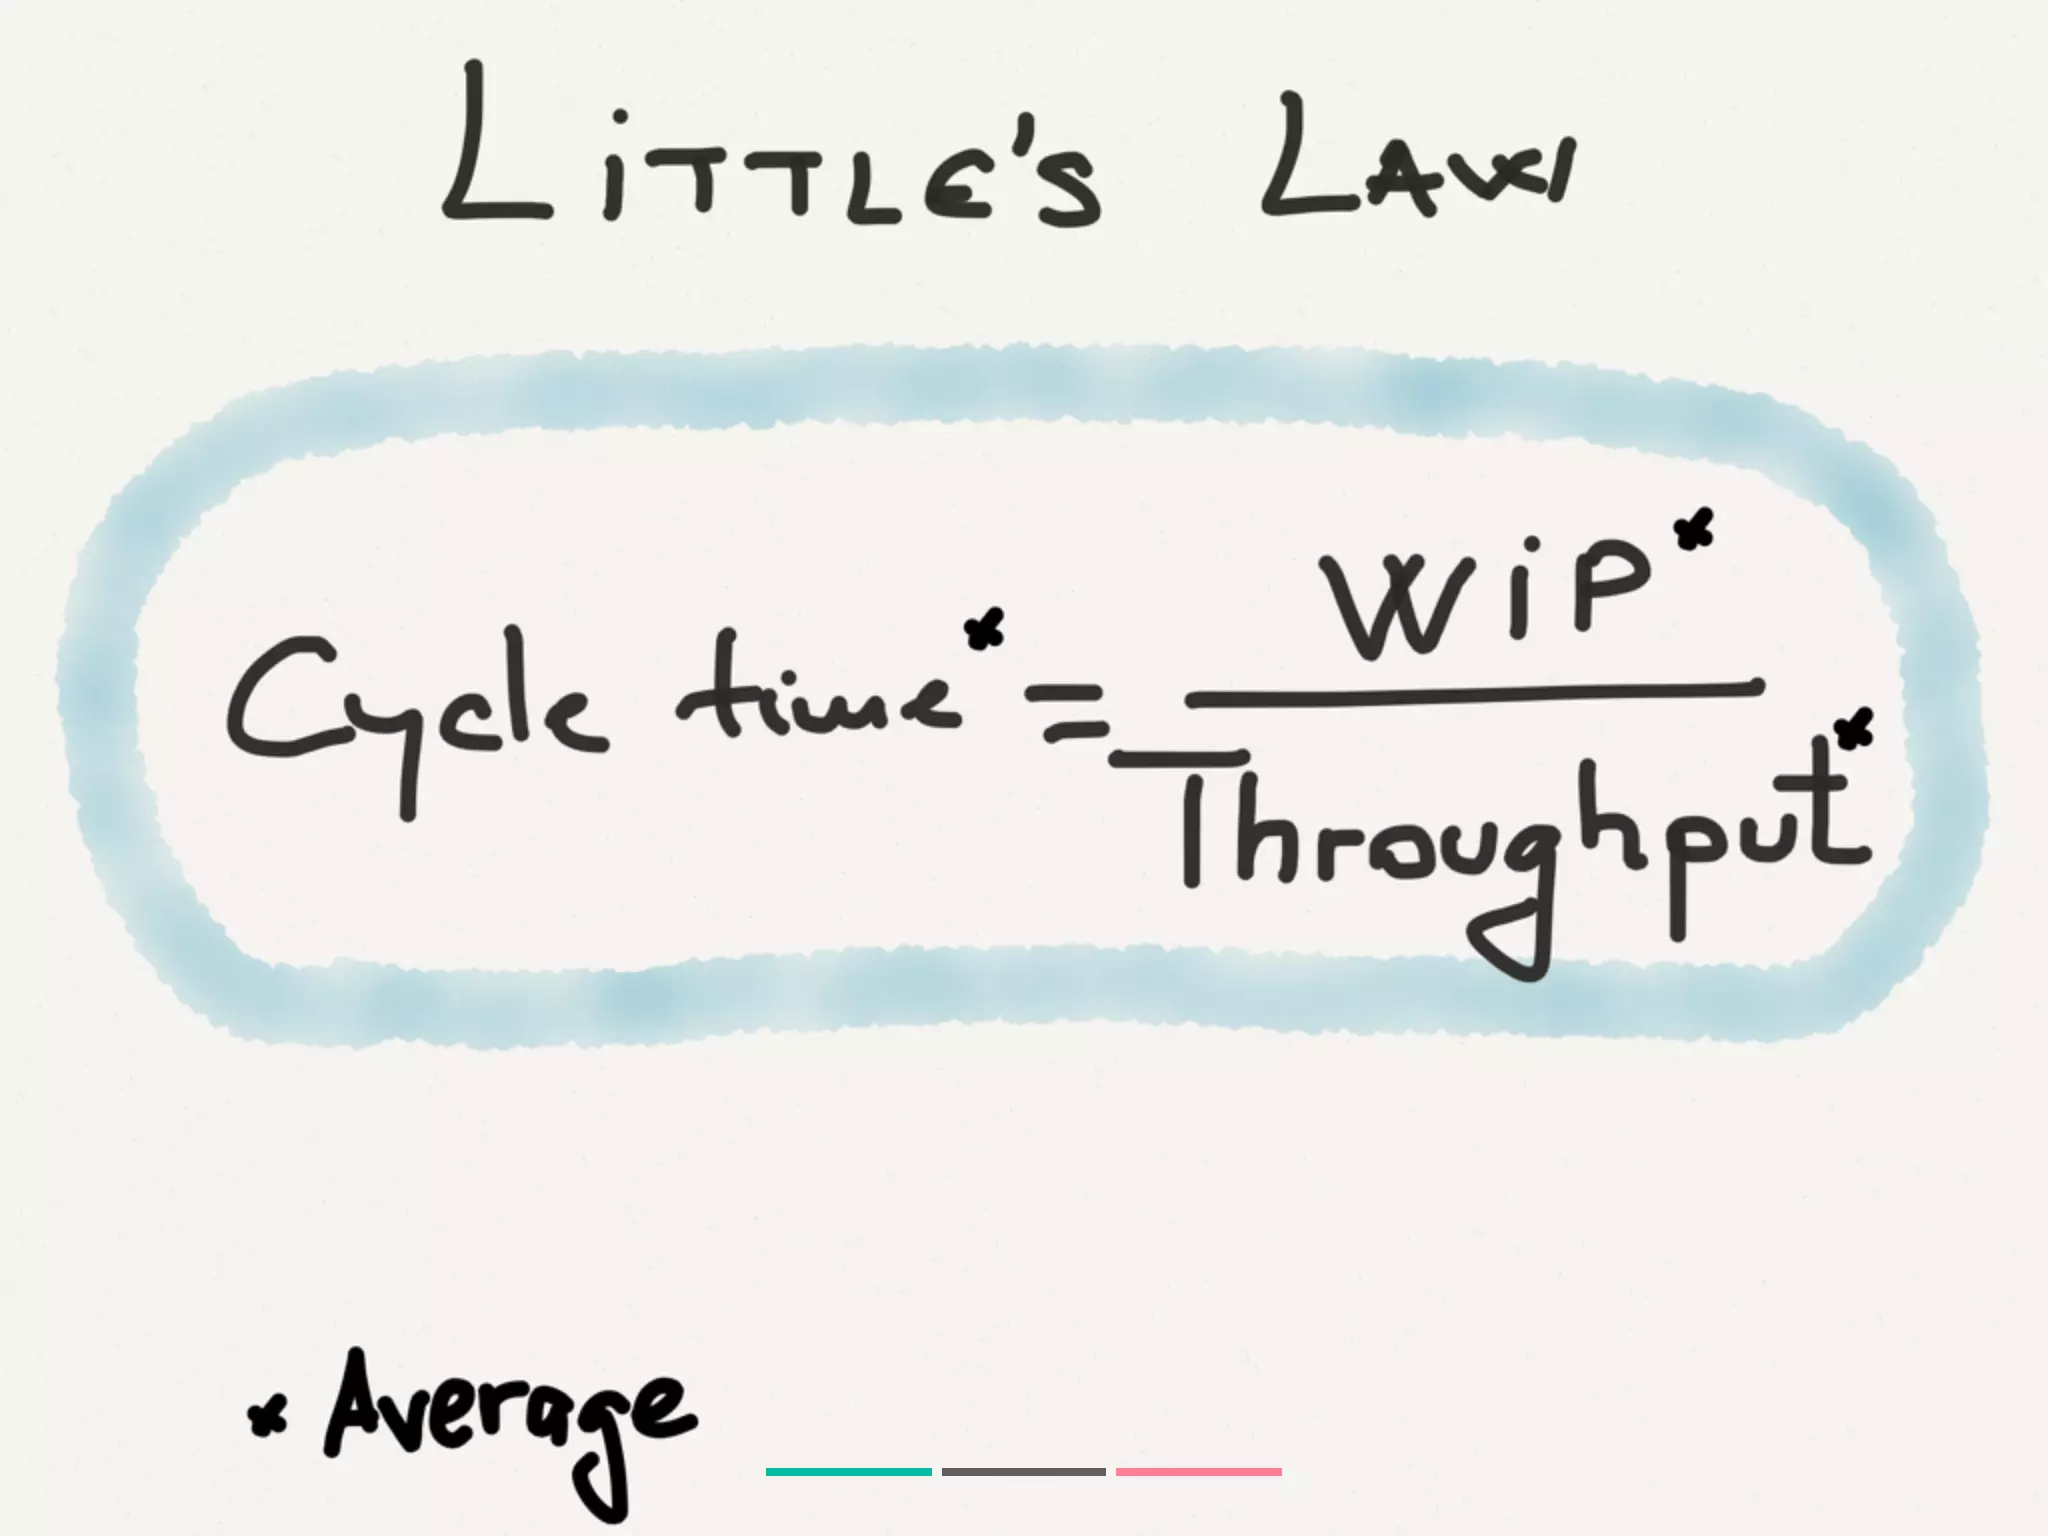
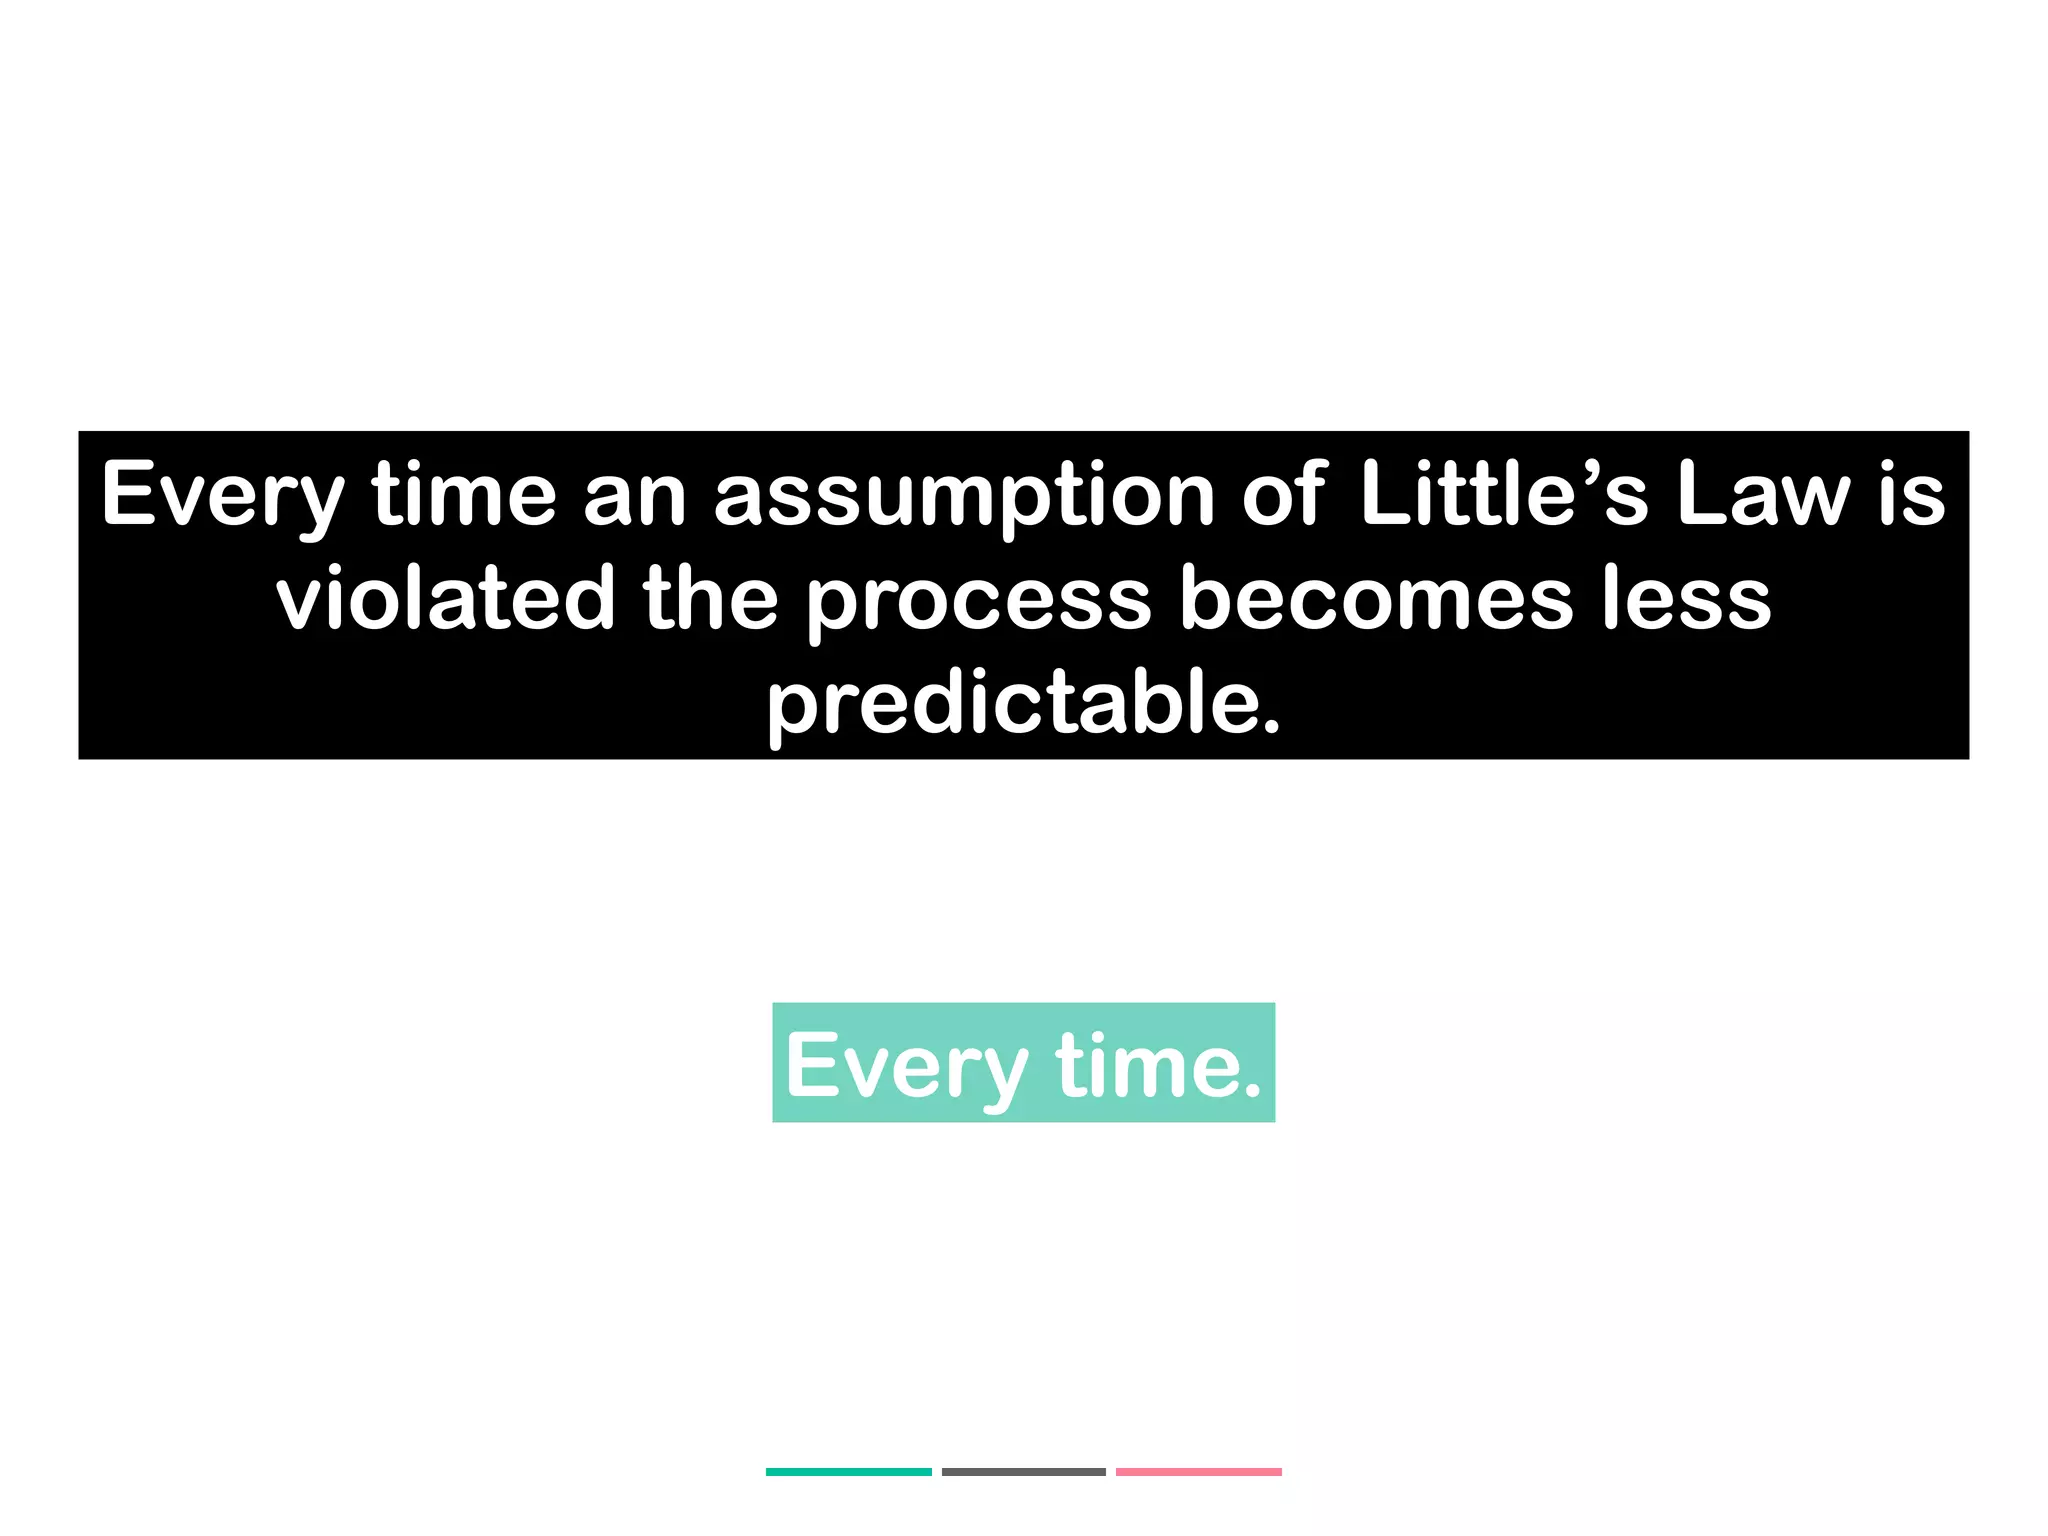
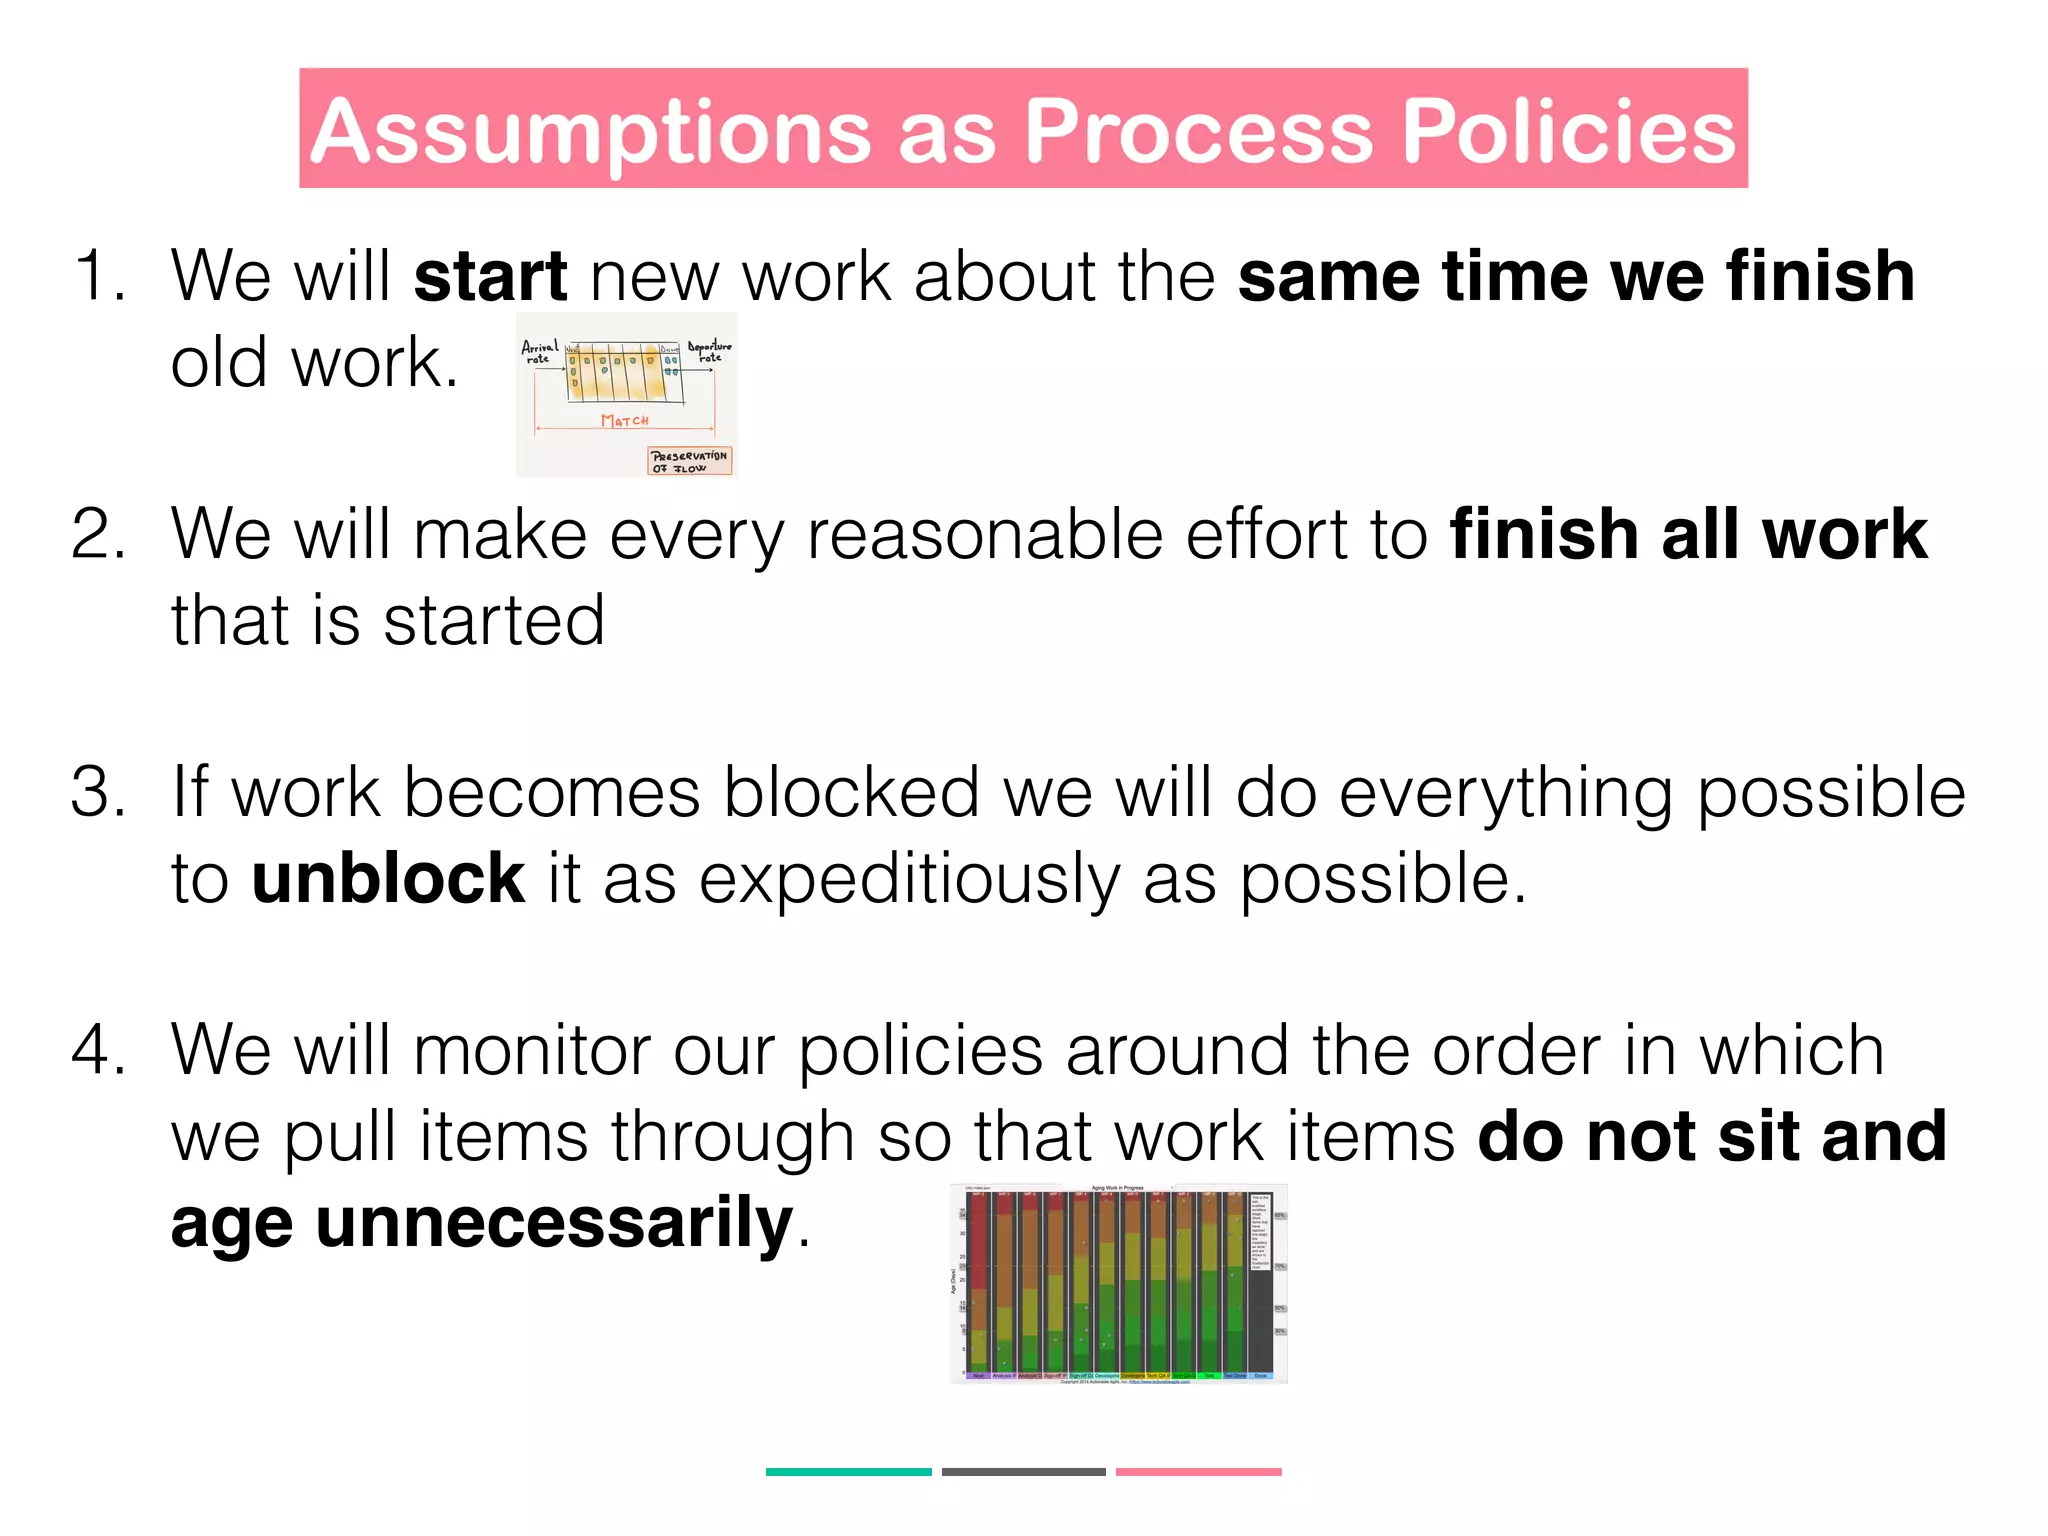
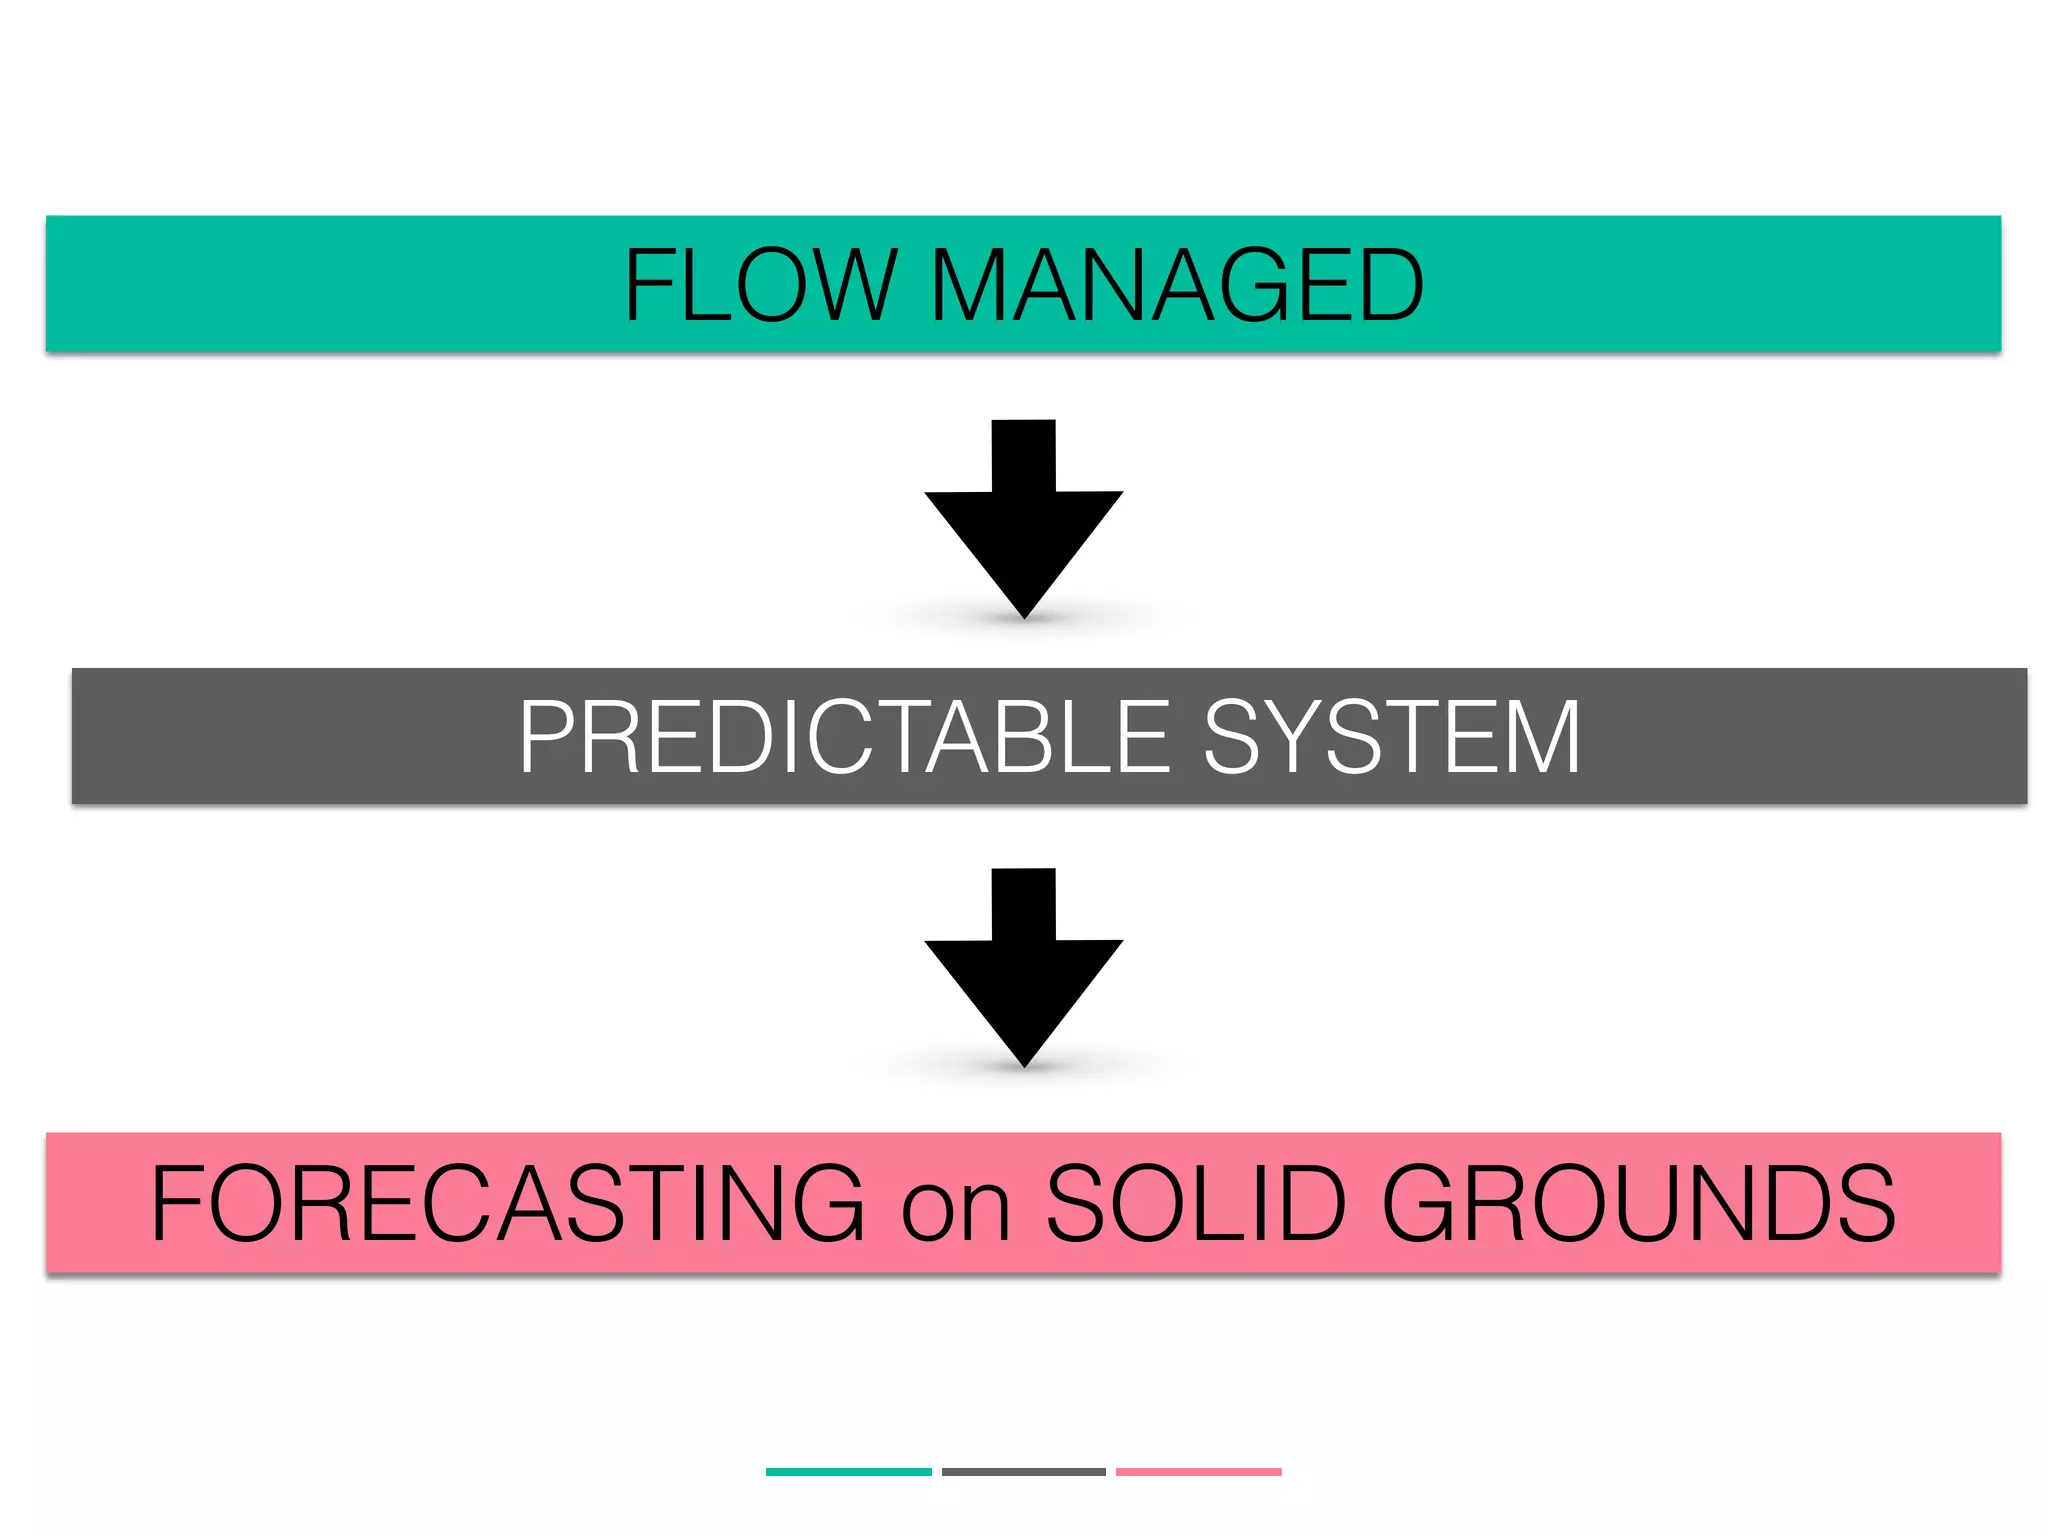
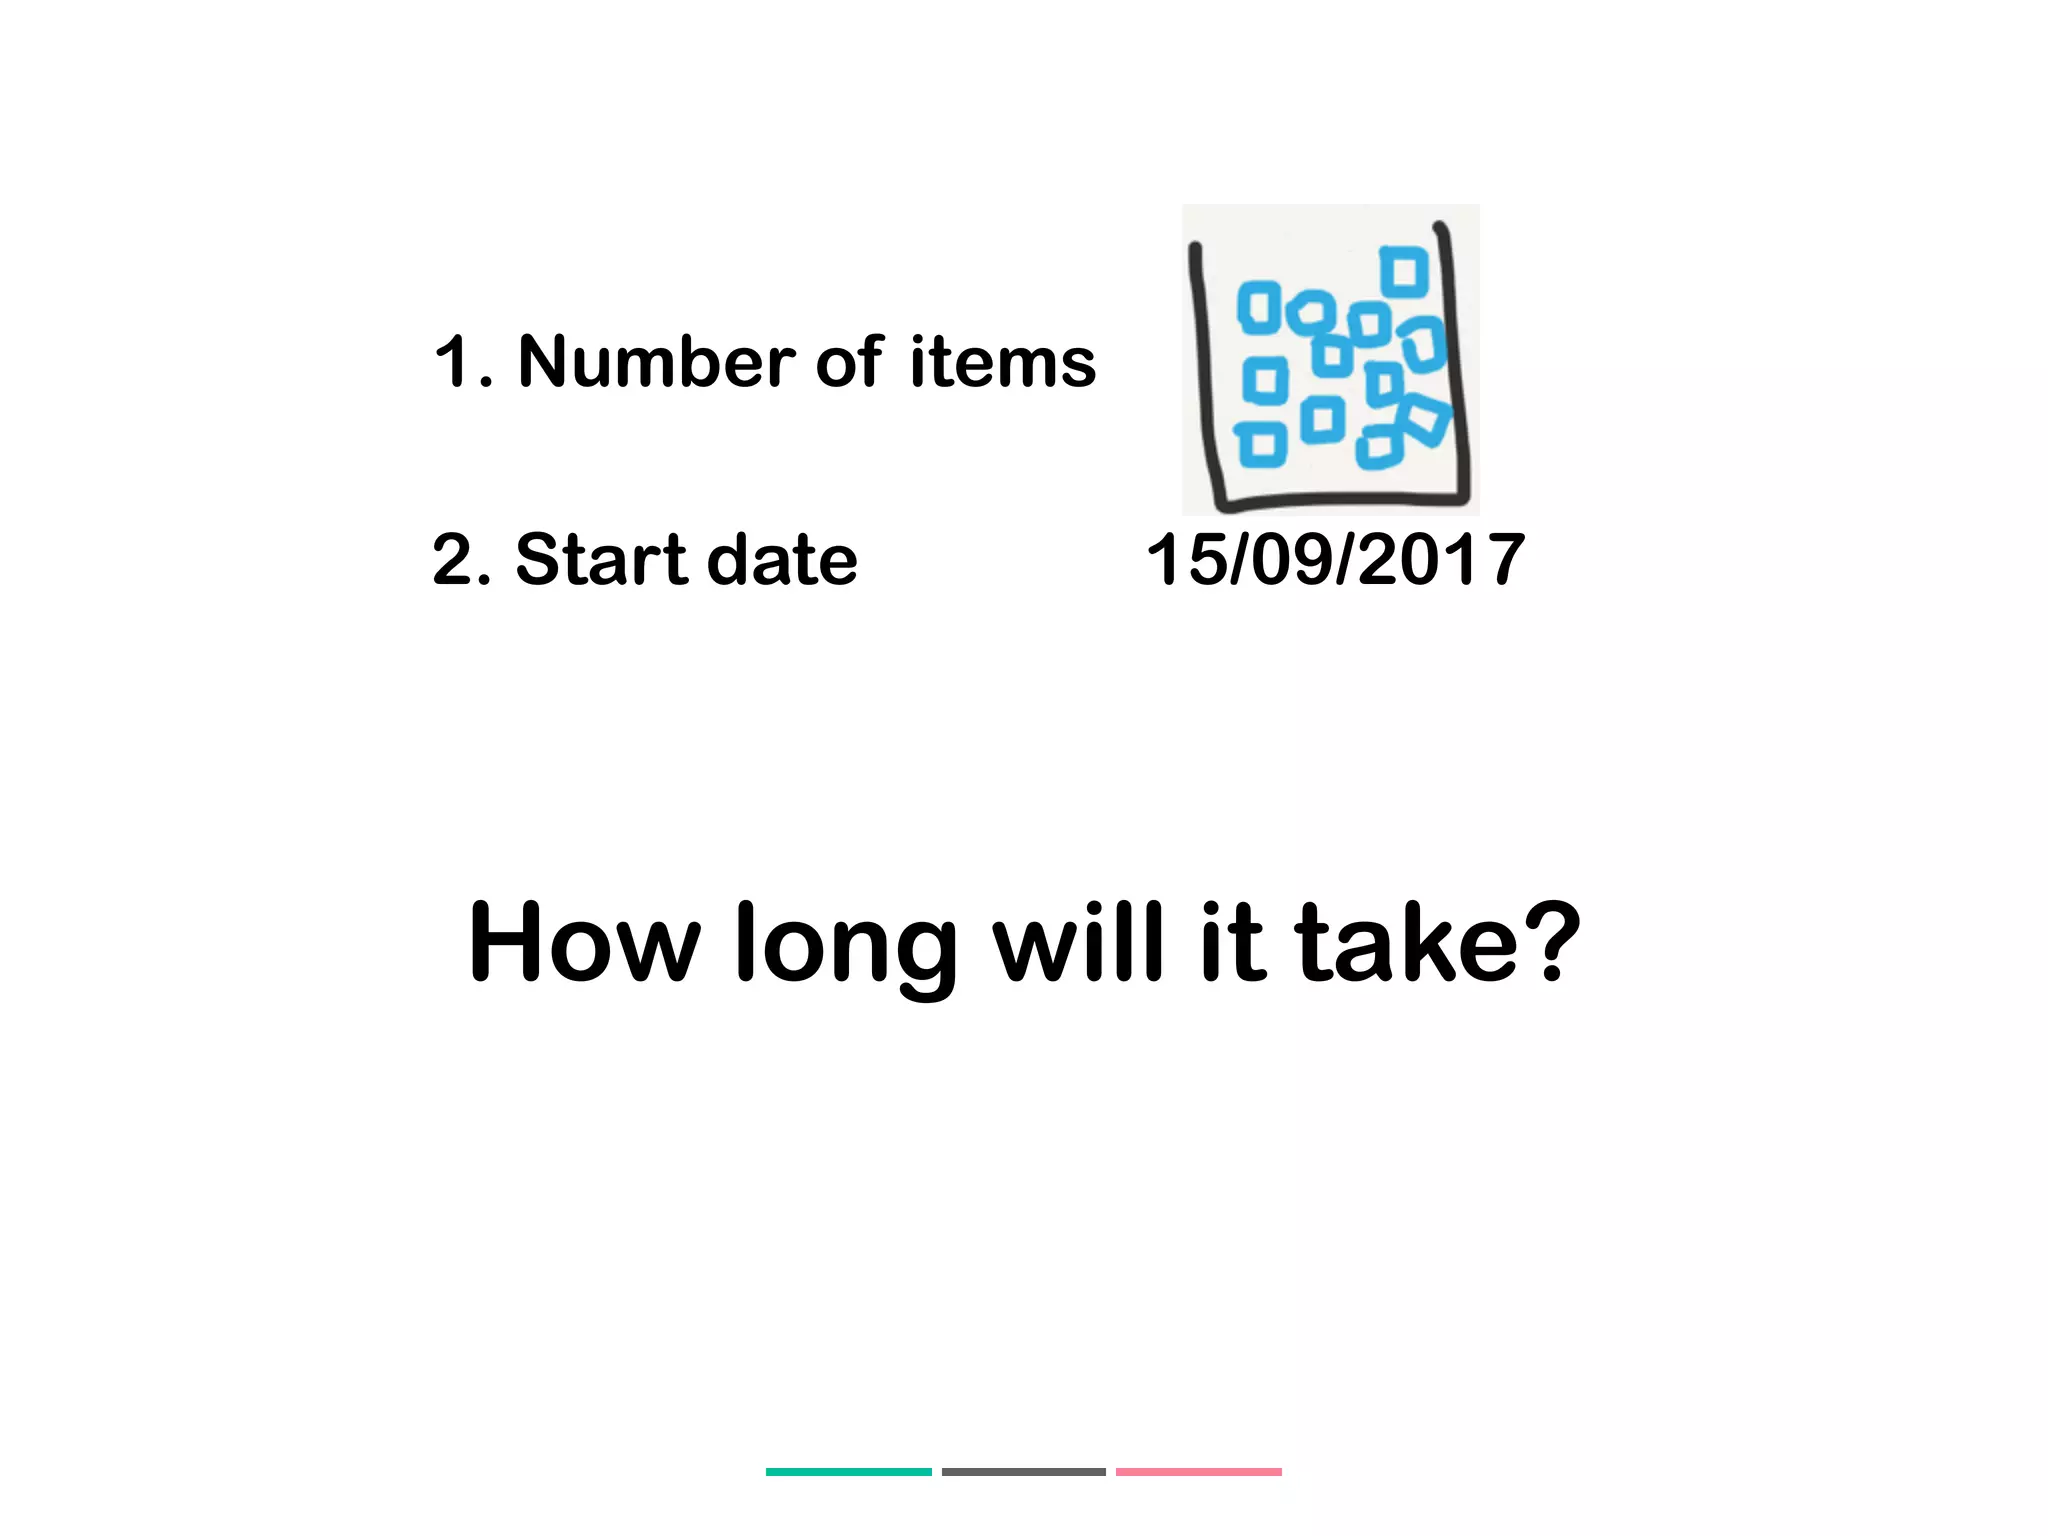
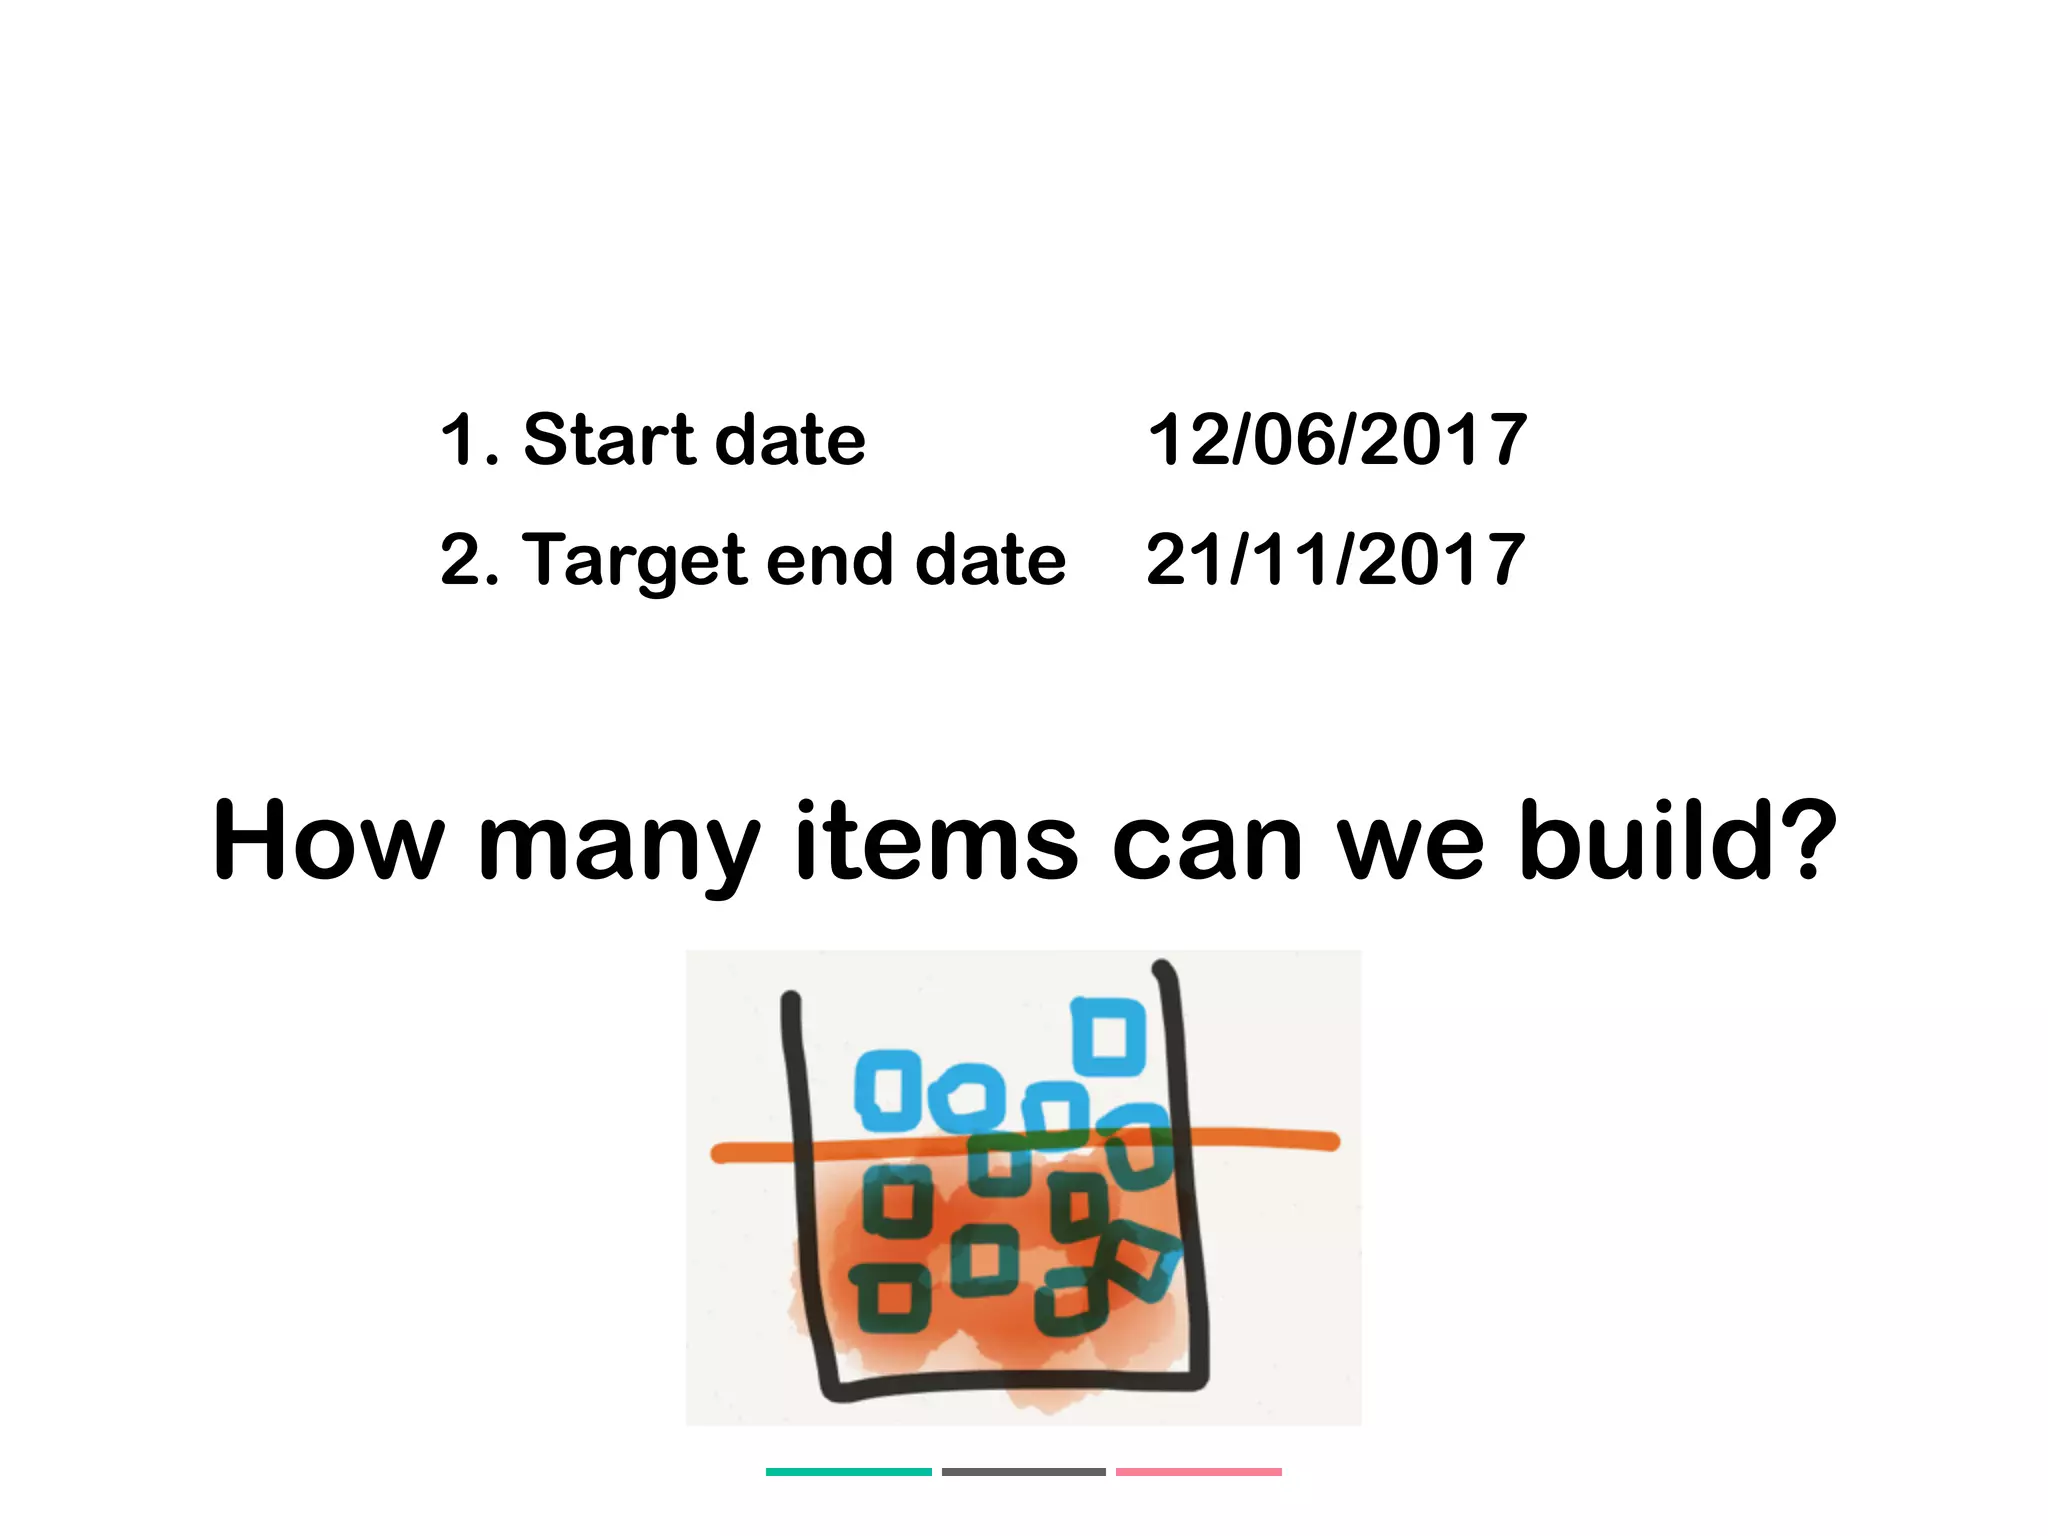
The document outlines a methodology for transitioning from Scrum to a flow-based system using actionable metrics in agile projects, emphasizing key practices like defining a Kanban system, measuring cycle time, and visualizing data. It discusses several assumptions and policies necessary to maintain process predictability and foster an effective workflow. Additionally, it illustrates the application of Monte Carlo simulations for forecasting project timelines based on various inputs.


![[Talk] Manage flow - Metrics and Analytics for predictability and flow](https://cdn.slidesharecdn.com/ss_thumbnails/lkna-manageflow-metricsandanalyticsforpredictabilityandflow-190527041051-thumbnail.jpg?width=640&height=640&fit=bounds)