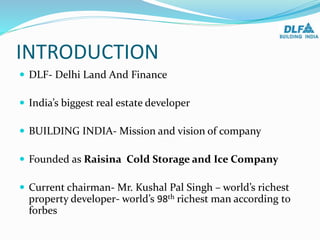
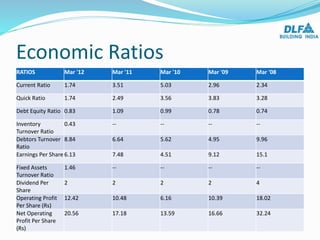
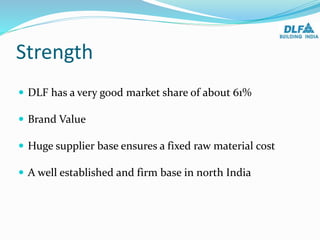
Delhi Land and Finance
CONTENTS
 Introduction
 History
 Balance Sheet
 Profit and Loss Statements
 Economic Ratios
 Financial Statistics and Analysis
 Porter’s 5 Forces Model Analysis
 SWOT Analysis
 Gallery
INTRODUCTION
 DLF- Delhi Land And Finance
 India’s biggest real estate developer
 BUILDING INDIA- Mission and vision of company
 Founded as Raisina Cold Storage and Ice Company
 Current chairman- Mr. Kushal Pal Singh – world’s richest
property developer- world’s 98th richest man according to
forbes
HISTORY
 Founder- Mr.Raghuvendra Singh on 16 March 1946
 Starting developments in Delhi like Krishna Nagar,
Greater Kailash
 Company acquire land on outskirts like Gurgoan
Awards
 Most diversified real estate developer award by CNBC –
2007
 Most trusted brand By reader’s digest- 2008
 Most respected real estate company – Business World 2011
Major milestones
Balance Sheet
Source of Funds Mar '12 Mar '11 Mar '10 Mar '09 Mar '08
Shareholders 14496.6 13810.5 12830 12374.8 11269.2
Loan funds 11975.1 15059.6 12637.9 9614.97 8386.4
Application of
Funds
Fixed Asset 4166.26 3942.35 3447.52 3473.26 3256.17
Investments 7046.65 7037.24 6558.88 2956.32 1839.83
Current assets,
loans and
advances
24855.1 24251.8 18944.5 18718.6 18345.9
Less : Current
liabilities and
provisions
9596.33 6361.36 3483.03 3158.39 3786.37
Net Current
Assets
15258.8 17890.4 15461.5 15560.2 14559.6
Profit & Loss Account
Profit & Loss Mar '12 Mar '11 Mar '10 Mar '09 Mar '08
INCOME
4582.7 4151.6 3215.6 3832.5 6051.8
EXPENDITURE
1381.4 1136.2 1262 1064.5 2418.9
Profit before Tax 1500.5 1578.7 940.91 1839.2 3118.2
Tax Expense 458.77 309.05 175.71 261 543.52
Net Profit 1041.8 1269.6 765.06 1547.8 2574.4
Earnings Per Share 6.13 7.48 4.51 9.12 15.1
Economic Ratios
RATIOS Mar '12 Mar '11 Mar '10 Mar '09 Mar '08
Current Ratio 1.74 3.51 5.03 2.96 2.34
Quick Ratio 1.74 2.49 3.56 3.83 3.28
Debt Equity Ratio 0.83 1.09 0.99 0.78 0.74
Inventory
Turnover Ratio
0.43 -- -- -- --
Debtors Turnover
Ratio
8.84 6.64 5.62 4.95 9.96
Earnings Per Share 6.13 7.48 4.51 9.12 15.1
Fixed Assets
Turnover Ratio
1.46 -- -- -- --
Dividend Per
Share
2 2 2 2 4
Operating Profit
Per Share (Rs)
12.42 10.48 6.16 10.39 18.02
Net Operating
Profit Per Share
(Rs)
20.56 17.18 13.59 16.66 32.24
Liquidity Ratio
0
1
2
3
4
5
6
Mar '12 Mar '11 Mar '10 Mar '09 Mar '08
Current Ratio
Quick Ratio
Market value ratios
0
2
4
6
8
10
12
14
16
Mar '12 Mar '11 Mar '10 Mar '09 Mar '08
Earnings Per Share
Earnings Per Share
Market Capital
Name Last Price Market Cap. Sales Net Profit Total Assets
(Rs. cr.) Turnover
DLF 237.85 40,404.03 3,491.32 1,041.78 26,471.67
Oberoi Realty 252.7 8,294.45 595.05 327.47 2,245.06
Prestige Estate 170.4 5,964.00 745.47 129.07 3,243.86
Godrej Prop 601.15 4,691.74 368.94 81.36 2,518.47
Sobha
Developer 399.25 3,915.20 1,397.50 200.8 2,222.26
Indiabulls Real 70.65 2,995.64 354.86 268.56 6,610.93
61%12%
9%
7%
6% 5%
Market Cap. (Rs. cr.)
DLF Oberoi Realty Prestige Estate
Godrej Prop Sobha Developer Indiabulls Real
Intra-Industry
Rivalry
Strategic Business Unit
Bargaining
Power
of Buyers
Bargaining
Power
of Suppliers
Substitute
Products
and Services
Potential
New Entrants
Porter’s 5 Forces Model Analysis
Threat of new entrants
 Decrease in profitability due to increase in number of
entrants.
 Real Estate Sector needs high working capital.
 This results in high entry barriers.
 Existing firm has an edge over the others due to more
industrial experience.
Threat Of Established Rivals
 DLF has 61% of the Market share in the Real Estate
Sector.
 High competition in the sector.
 Established rivals are a threat to upcoming players.
 DLF , Oberoi and Prestige are the major players in this
sector.
Bargaining Power Of Suppliers
 Bargaining power of suppliers is low.
 Supplier’s margins have been stagnant despite strong
growth in volumes.
 Large number of suppliers are available
 This leads to shift of contracts when a supplier tries to
increases the price.
Bargaining Power of Buyers
 Bargaining power of the buyers is low.
 Difficult to predict the direction and magnitude of
price movement on real estate.
 Forces of demand and supply would always apply
 Price movement would follow accordingly
Threat Of Substitute Product
 No substitutes to the basic product
So,
 No threat of substitute products.
SWOT Analysis
Strength Weakness
Opportunities Threats
Strength
 DLF has a very good market share of about 61%
 Brand Value
 Huge supplier base ensures a fixed raw material cost
 A well established and firm base in north India
Weakness
 Little or no projects in the other parts of India
 No parallel products to support during times of bad
economy
Opportunities
 Expansion of business in other parts of India
 It can invest more in Power generation projects like
Hydroelectric or Wind power
 Investment in raw material – Backward Vertical
Integration
Threats
 Competitors may try to get more market share through
improved techniques
DLF Constructions
DLF Gateway Tower
Gurgaon
SkyLine
Gurgaon
SkyLine
New Delhi
Thank You

DLF-final ppt

  • 1.
  • 2.
    CONTENTS  Introduction  History Balance Sheet  Profit and Loss Statements  Economic Ratios  Financial Statistics and Analysis  Porter’s 5 Forces Model Analysis  SWOT Analysis  Gallery
  • 3.
    INTRODUCTION  DLF- DelhiLand And Finance  India’s biggest real estate developer  BUILDING INDIA- Mission and vision of company  Founded as Raisina Cold Storage and Ice Company  Current chairman- Mr. Kushal Pal Singh – world’s richest property developer- world’s 98th richest man according to forbes
  • 4.
    HISTORY  Founder- Mr.RaghuvendraSingh on 16 March 1946  Starting developments in Delhi like Krishna Nagar, Greater Kailash  Company acquire land on outskirts like Gurgoan Awards  Most diversified real estate developer award by CNBC – 2007  Most trusted brand By reader’s digest- 2008  Most respected real estate company – Business World 2011
  • 5.
  • 6.
    Balance Sheet Source ofFunds Mar '12 Mar '11 Mar '10 Mar '09 Mar '08 Shareholders 14496.6 13810.5 12830 12374.8 11269.2 Loan funds 11975.1 15059.6 12637.9 9614.97 8386.4 Application of Funds Fixed Asset 4166.26 3942.35 3447.52 3473.26 3256.17 Investments 7046.65 7037.24 6558.88 2956.32 1839.83 Current assets, loans and advances 24855.1 24251.8 18944.5 18718.6 18345.9 Less : Current liabilities and provisions 9596.33 6361.36 3483.03 3158.39 3786.37 Net Current Assets 15258.8 17890.4 15461.5 15560.2 14559.6
  • 7.
    Profit & LossAccount Profit & Loss Mar '12 Mar '11 Mar '10 Mar '09 Mar '08 INCOME 4582.7 4151.6 3215.6 3832.5 6051.8 EXPENDITURE 1381.4 1136.2 1262 1064.5 2418.9 Profit before Tax 1500.5 1578.7 940.91 1839.2 3118.2 Tax Expense 458.77 309.05 175.71 261 543.52 Net Profit 1041.8 1269.6 765.06 1547.8 2574.4 Earnings Per Share 6.13 7.48 4.51 9.12 15.1
  • 8.
    Economic Ratios RATIOS Mar'12 Mar '11 Mar '10 Mar '09 Mar '08 Current Ratio 1.74 3.51 5.03 2.96 2.34 Quick Ratio 1.74 2.49 3.56 3.83 3.28 Debt Equity Ratio 0.83 1.09 0.99 0.78 0.74 Inventory Turnover Ratio 0.43 -- -- -- -- Debtors Turnover Ratio 8.84 6.64 5.62 4.95 9.96 Earnings Per Share 6.13 7.48 4.51 9.12 15.1 Fixed Assets Turnover Ratio 1.46 -- -- -- -- Dividend Per Share 2 2 2 2 4 Operating Profit Per Share (Rs) 12.42 10.48 6.16 10.39 18.02 Net Operating Profit Per Share (Rs) 20.56 17.18 13.59 16.66 32.24
  • 9.
    Liquidity Ratio 0 1 2 3 4 5 6 Mar '12Mar '11 Mar '10 Mar '09 Mar '08 Current Ratio Quick Ratio
  • 10.
    Market value ratios 0 2 4 6 8 10 12 14 16 Mar'12 Mar '11 Mar '10 Mar '09 Mar '08 Earnings Per Share Earnings Per Share
  • 11.
    Market Capital Name LastPrice Market Cap. Sales Net Profit Total Assets (Rs. cr.) Turnover DLF 237.85 40,404.03 3,491.32 1,041.78 26,471.67 Oberoi Realty 252.7 8,294.45 595.05 327.47 2,245.06 Prestige Estate 170.4 5,964.00 745.47 129.07 3,243.86 Godrej Prop 601.15 4,691.74 368.94 81.36 2,518.47 Sobha Developer 399.25 3,915.20 1,397.50 200.8 2,222.26 Indiabulls Real 70.65 2,995.64 354.86 268.56 6,610.93
  • 12.
    61%12% 9% 7% 6% 5% Market Cap.(Rs. cr.) DLF Oberoi Realty Prestige Estate Godrej Prop Sobha Developer Indiabulls Real
  • 13.
    Intra-Industry Rivalry Strategic Business Unit Bargaining Power ofBuyers Bargaining Power of Suppliers Substitute Products and Services Potential New Entrants Porter’s 5 Forces Model Analysis
  • 14.
    Threat of newentrants  Decrease in profitability due to increase in number of entrants.  Real Estate Sector needs high working capital.  This results in high entry barriers.  Existing firm has an edge over the others due to more industrial experience.
  • 15.
    Threat Of EstablishedRivals  DLF has 61% of the Market share in the Real Estate Sector.  High competition in the sector.  Established rivals are a threat to upcoming players.  DLF , Oberoi and Prestige are the major players in this sector.
  • 16.
    Bargaining Power OfSuppliers  Bargaining power of suppliers is low.  Supplier’s margins have been stagnant despite strong growth in volumes.  Large number of suppliers are available  This leads to shift of contracts when a supplier tries to increases the price.
  • 17.
    Bargaining Power ofBuyers  Bargaining power of the buyers is low.  Difficult to predict the direction and magnitude of price movement on real estate.  Forces of demand and supply would always apply  Price movement would follow accordingly
  • 18.
    Threat Of SubstituteProduct  No substitutes to the basic product So,  No threat of substitute products.
  • 19.
  • 20.
    Strength  DLF hasa very good market share of about 61%  Brand Value  Huge supplier base ensures a fixed raw material cost  A well established and firm base in north India
  • 21.
    Weakness  Little orno projects in the other parts of India  No parallel products to support during times of bad economy
  • 22.
    Opportunities  Expansion ofbusiness in other parts of India  It can invest more in Power generation projects like Hydroelectric or Wind power  Investment in raw material – Backward Vertical Integration
  • 23.
    Threats  Competitors maytry to get more market share through improved techniques
  • 24.
  • 25.
  • 26.
  • 27.
  • 28.