Downloaded 163 times


![● WKT / WKB - Geospatial Markup Language
○ POLYGON((34.807841777801514 32.164333053441936,34.81168270111084
32.164859820966136,34.81337785720825 32.1613540349589,34.80865716934204
32.16046394346568,34.807841777801514 32.164333053441936))
○ http://arthur-e.github.io/Wicket/sandbox-gmaps3.html
● GeoJSON
○ { "type": "FeatureCollection", "features": [{ "type": "Feature", "properties": { "Name": "Verint", "Guest":
"dmarcous", "Accomodations": "Beer; Pizza" }, "geometry": { "type": "Polygon", "coordinates": [ [
[ 34.807841777801514, 32.164333053441936 ], [ 34.81168270111084,
32.164859820966136 ], [ 34.81337785720825, 32.1613540349589 ], [
34.80865716934204, 32.16046394346568 ], [ 34.807841777801514,
32.164333053441936 ]]]}}]}
○ http://geojson.io/#map=17/32.16267/34.81061
● Shape Files - ESRI vector format
● GML - The Geography Markup Language (GML) is an XML grammar for expressing
geographical features.
● Raster - Display file built from coordinates
Formats](https://image.slidesharecdn.com/geodataanalytics-150526084812-lva1-app6891/85/Geo-data-analytics-11-320.jpg)
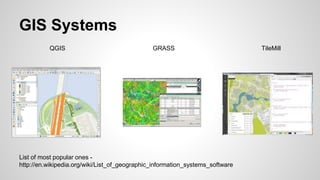

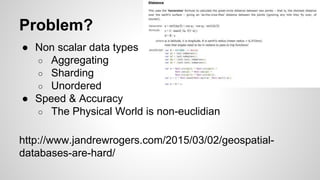

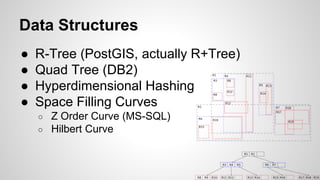
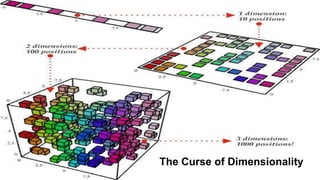


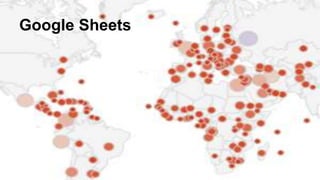
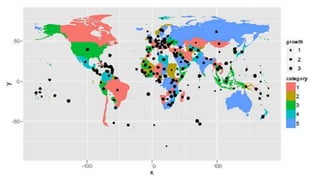


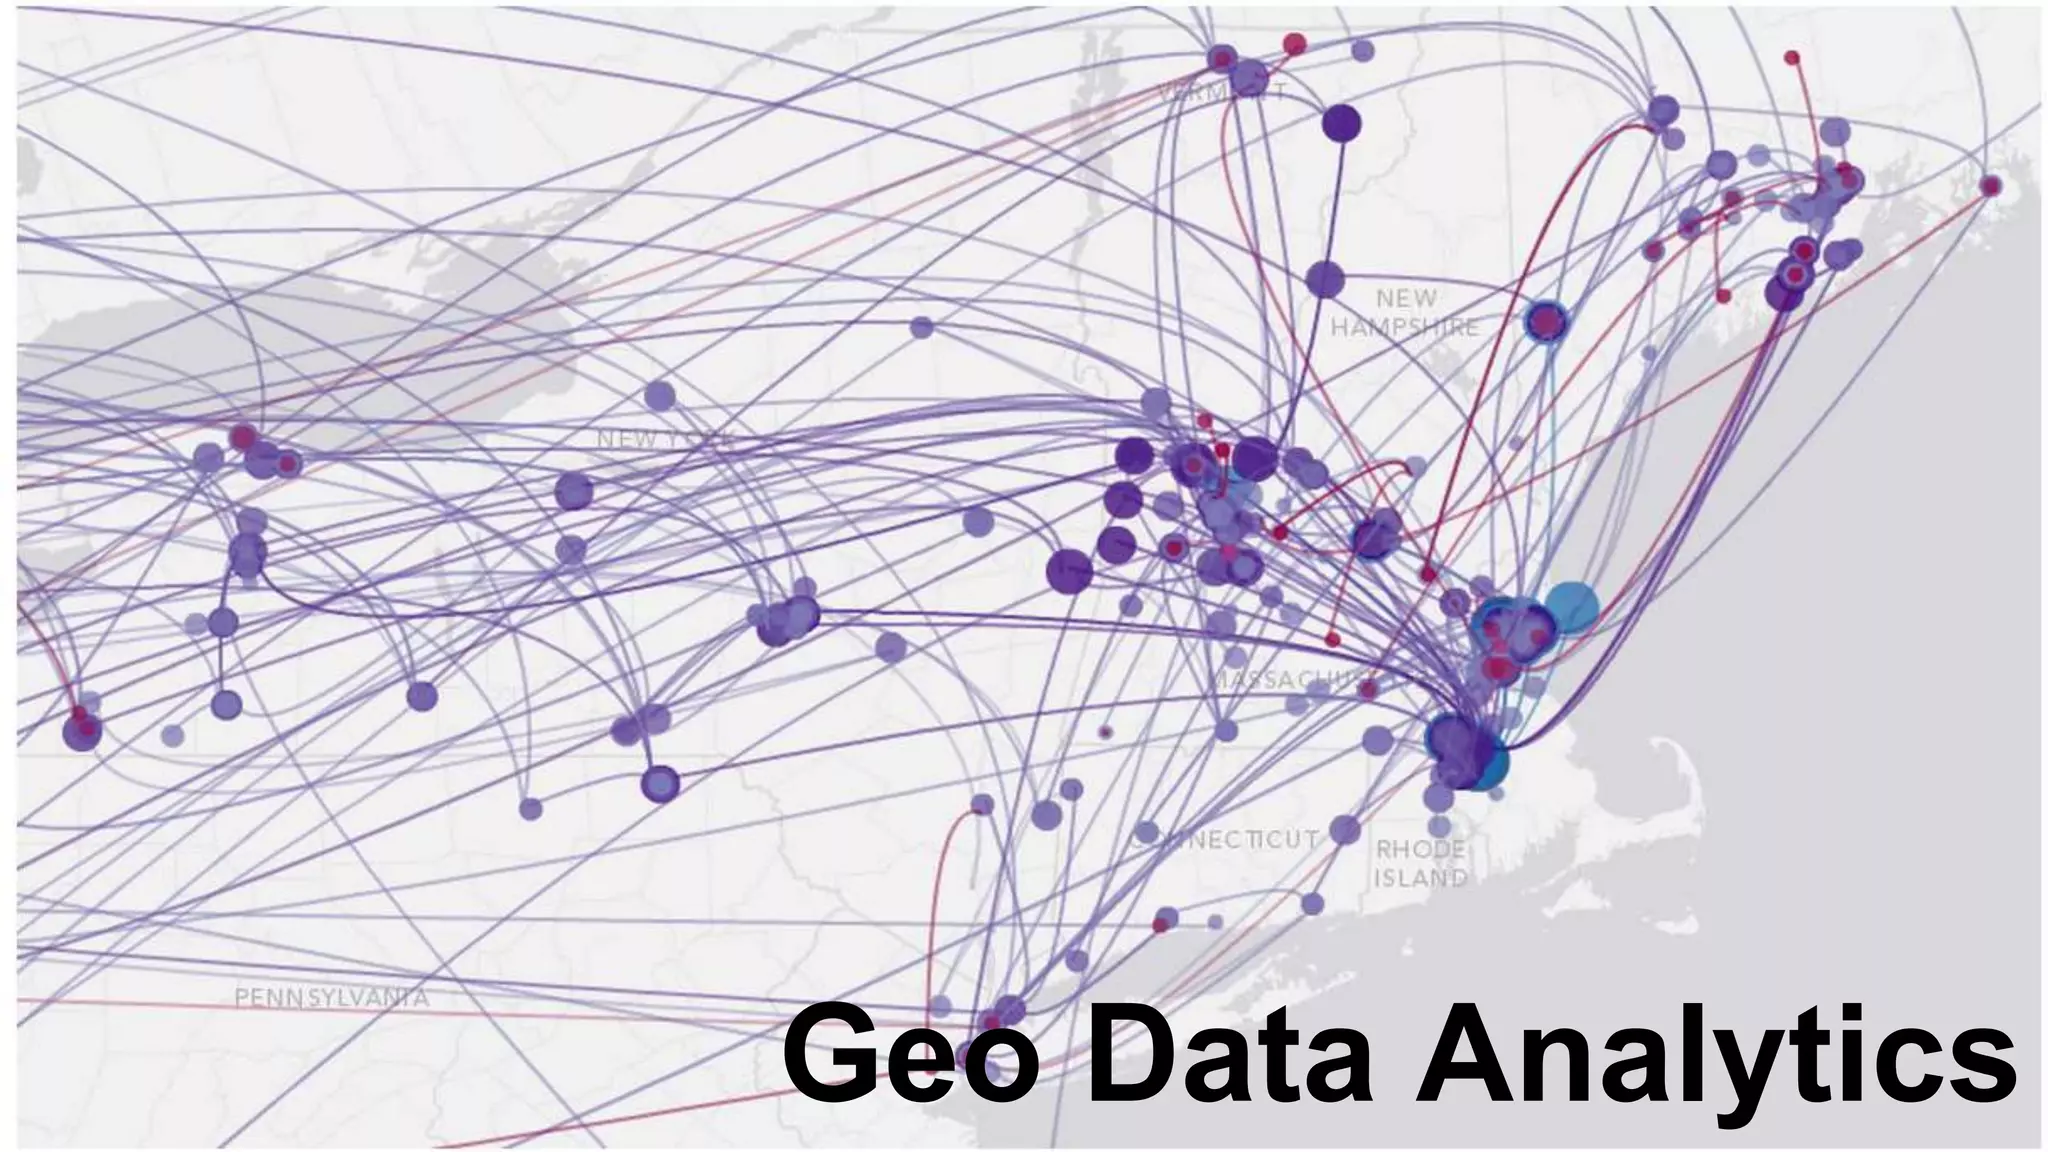
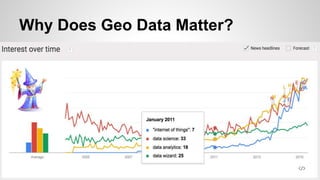
This document summarizes a presentation on geo data analytics. It discusses why geo data matters, common data formats and libraries for working with spatial data, challenges of working with spatial data at scale, and solutions including dimension reduction techniques and spatial databases. It also provides tips for working with spatial data in tools like Spark, R, and Javascript libraries.