Downloaded 22 times

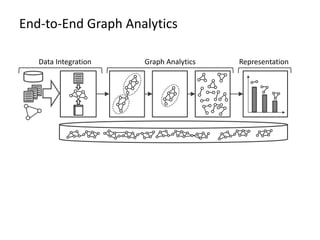
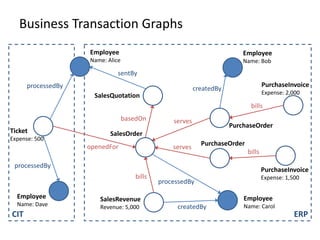
![Combination
1: personGraph = db.G[0].combine(db.G[1]).combine(db.G[2])](https://image.slidesharecdn.com/gradoopflinkforward-151014071436-lva1-app6891/85/Gradoop-Scalable-Graph-Analytics-with-Apache-Flink-Flink-Forward-2015-30-320.jpg)
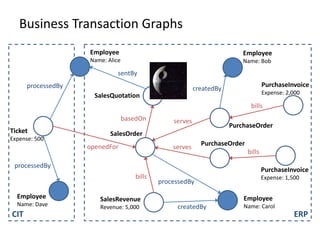
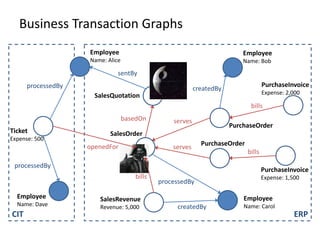
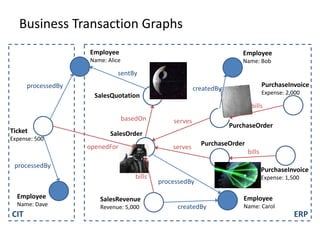
![Combination
1: personGraph = db.G[0].combine(db.G[1]).combine(db.G[2])](https://image.slidesharecdn.com/gradoopflinkforward-151014071436-lva1-app6891/85/Gradoop-Scalable-Graph-Analytics-with-Apache-Flink-Flink-Forward-2015-31-320.jpg)
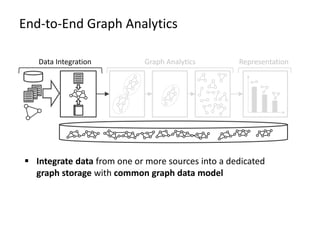
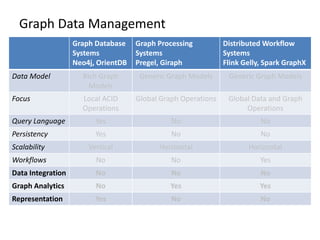
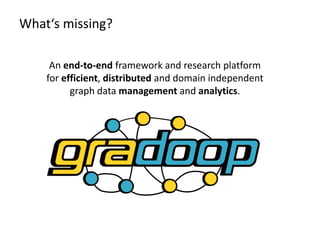
![Summarization
1: personGraph = db.G[0].combine(db.G[1]).combine(db.G[2])
2: vertexGroupingKeys = {:type, “city”}
3: edgeGroupingKeys = {:type}
4: vertexAggFunc = (Vertex vSum, Set vertices => vSum[“count”] = |vertices|)
5: edgeAggFunc = (Edge eSum, Set edges => eSum[“count”] = |edges|)
6: sumGraph = personGraph.summarize(vertexGroupingKeys, vertexAggFunc,
edgeGroupingKeys, edgeAggFunc)](https://image.slidesharecdn.com/gradoopflinkforward-151014071436-lva1-app6891/85/Gradoop-Scalable-Graph-Analytics-with-Apache-Flink-Flink-Forward-2015-33-320.jpg)
![Summarization
1: personGraph = db.G[0].combine(db.G[1]).combine(db.G[2])
2: vertexGroupingKeys = {:type, “city”}
3: edgeGroupingKeys = {:type}
4: vertexAggFunc = (Vertex vSum, Set vertices => vSum[“count”] = |vertices|)
5: edgeAggFunc = (Edge eSum, Set edges => eSum[“count”] = |edges|)
6: sumGraph = personGraph.summarize(vertexGroupingKeys, vertexAggFunc,
edgeGroupingKeys, edgeAggFunc)](https://image.slidesharecdn.com/gradoopflinkforward-151014071436-lva1-app6891/85/Gradoop-Scalable-Graph-Analytics-with-Apache-Flink-Flink-Forward-2015-34-320.jpg)
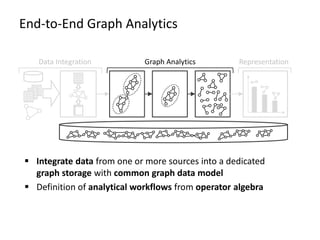
![Graph Collection Operators
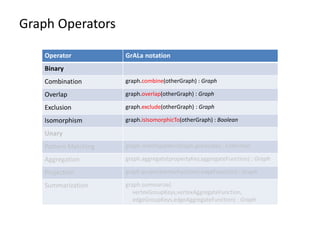
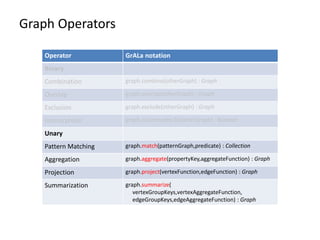
Operator GrALa notation
Collection
Selection collection.select(predicate) : Collection
Distinct collection.distinct() : Collection
Sort by collection.sortBy(key, [:asc|:desc]) : Collection
Top collection.top(limit) : Collection
Union collection.union(otherCollection) : Collection
Intersection collection.intersect(otherCollection) : Collection
Difference collection.difference(otherCollection) : Collection
Auxiliary
Apply collection.apply(unaryGraphOperator) : Collection
Reduce collection.reduce(binaryGraphOperator) : Graph
Call [graph|collection].callFor[Graph|Collection](
algorithm,parameters) : [Graph|Collection]](https://image.slidesharecdn.com/gradoopflinkforward-151014071436-lva1-app6891/85/Gradoop-Scalable-Graph-Analytics-with-Apache-Flink-Flink-Forward-2015-35-320.jpg)
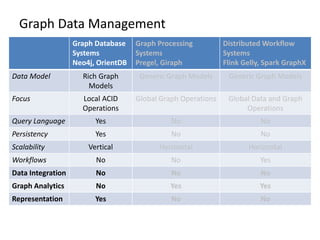
![Selection
1: collection = <db.G[0],db.G[1],db.G[2]>
2: predicate = (Graph g => |g.V| > 3)
3: result = collection.select(predicate)](https://image.slidesharecdn.com/gradoopflinkforward-151014071436-lva1-app6891/85/Gradoop-Scalable-Graph-Analytics-with-Apache-Flink-Flink-Forward-2015-36-320.jpg)
![Selection
1: collection = <db.G[0],db.G[1],db.G[2]>
2: predicate = (Graph g => |g.V| > 3)
3: result = collection.select(predicate)](https://image.slidesharecdn.com/gradoopflinkforward-151014071436-lva1-app6891/85/Gradoop-Scalable-Graph-Analytics-with-Apache-Flink-Flink-Forward-2015-37-320.jpg)
![Graph Collection Operators
Operator GrALa notation
Collection
Selection collection.select(predicate) : Collection
Distinct collection.distinct() : Collection
Sort by collection.sortBy(key, [:asc|:desc]) : Collection
Top collection.top(limit) : Collection
Union collection.union(otherCollection) : Collection
Intersection collection.intersect(otherCollection) : Collection
Difference collection.difference(otherCollection) : Collection
Auxiliary
Apply collection.apply(unaryGraphOperator) : Collection
Reduce collection.reduce(binaryGraphOperator) : Graph
Call [graph|collection].callFor[Graph|Collection](
algorithm,parameters) : [Graph|Collection]](https://image.slidesharecdn.com/gradoopflinkforward-151014071436-lva1-app6891/85/Gradoop-Scalable-Graph-Analytics-with-Apache-Flink-Flink-Forward-2015-38-320.jpg)
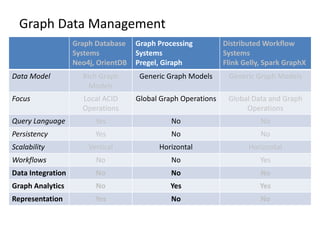
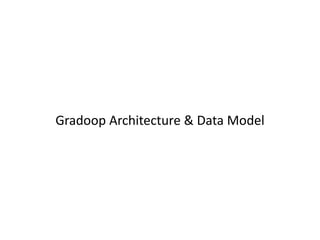
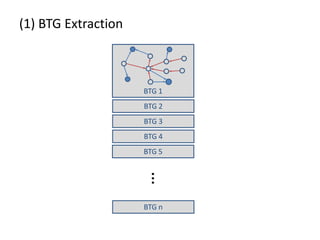
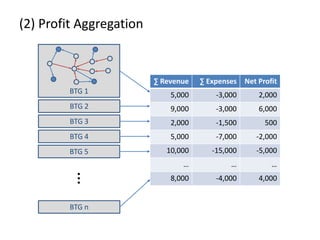
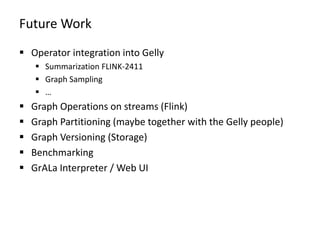
![Summarization in Flink
VID City
0 L
1 L
2 D
3 D
4 D
5 B
EID S T
0 0 1
1 1 0
2 1 2
3 2 1
4 2 3
5 3 2
6 4 0
7 4 1
8 5 2
9 5 3
L [0,1]
D [2,3,4]
B [5]
VID City Count
0 L 2
2 D 3
5 B 1
VID Rep
0 0
1 0
2 2
3 2
4 2
5 5
ID S T
0 0 1
1 0 0
2 0 2
3 2 1
4 2 3
5 2 2
6 2 0
7 2 1
8 5 2
9 5 3
ID S T
0 0 0
1 0 0
2 0 2
3 2 0
4 2 2
5 2 2
6 2 0
7 2 0
8 5 2
9 5 2
0,0 [0,1]
0,2 [2]
2,0 [3,6,7]
2,2 [4,5]
5,2 [8,9]
EID S T Count
0 0 1 2
2 0 2 1
3 2 0 3
4 2 2 2
8 5 2 2
join(VID==S)
𝒱
ℰ’
𝒱′
ℰ
groupBy(City)
reduceGroup + filter + map
reduceGroup + filter + map
groupBy(S,T)
join(VID==T)](https://image.slidesharecdn.com/gradoopflinkforward-151014071436-lva1-app6891/85/Gradoop-Scalable-Graph-Analytics-with-Apache-Flink-Flink-Forward-2015-41-320.jpg)
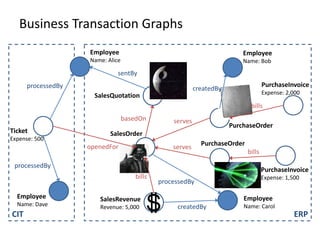
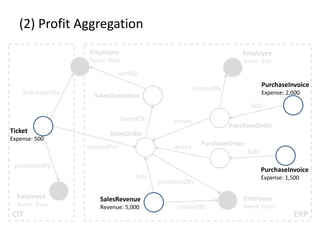
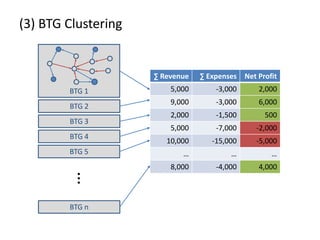
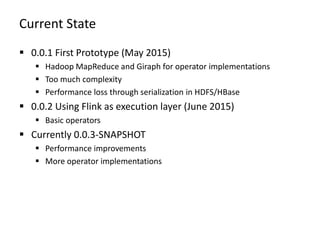
![(3) BTG Clustering
// select profit and loss clusters
profitBtgs = btgs.select( Graph g => g[“Profit”] >= 0 )
lossBtgs = btgs.difference(profitBtgs)](https://image.slidesharecdn.com/gradoopflinkforward-151014071436-lva1-app6891/85/Gradoop-Scalable-Graph-Analytics-with-Apache-Flink-Flink-Forward-2015-59-320.jpg)
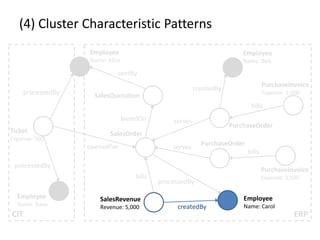
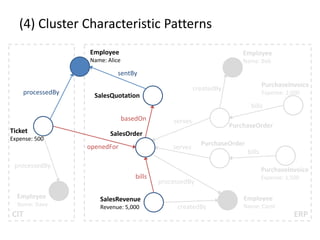
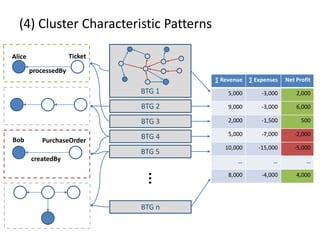
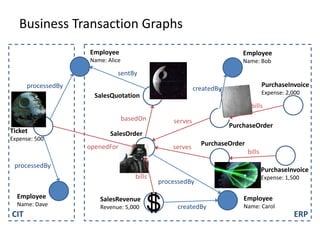
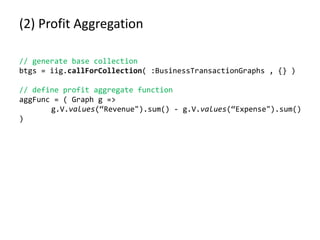
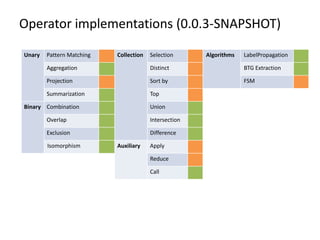
![(4) Cluster Characteristic Patterns
// select profit and loss clusters
profitBtgs = btgs.select( Graph g => g[“Profit”] >= 0 )
lossBtgs = btgs.difference(profitBtgs)
// apply magic
profitFreqPats = profitBtgs.callForCollection(
:FrequentSubgraphs , {“Threshold”:0.7}
)
lossFreqPats = lossBtgs.callForCollection(
:FrequentSubgraphs , {“Threshold”:0.7}
)
// determine cluster characteristic patterns
trivialPats = profitFreqPats.intersect(lossFreqPats)
profitCharPatterns = profitFreqPats.difference(trivialPats)
lossCharPatterns = lossFreqPats.difference(trivialPats)](https://image.slidesharecdn.com/gradoopflinkforward-151014071436-lva1-app6891/85/Gradoop-Scalable-Graph-Analytics-with-Apache-Flink-Flink-Forward-2015-63-320.jpg)

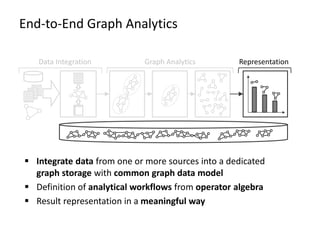
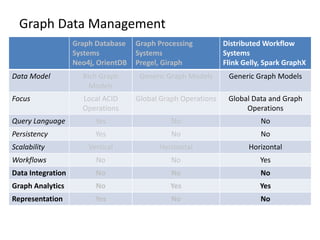
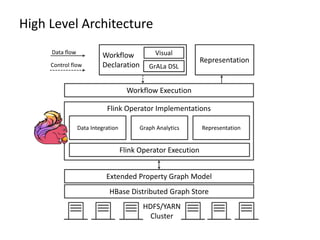
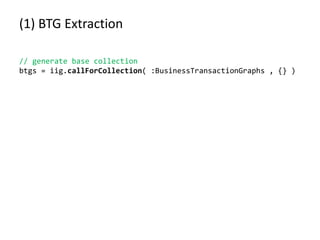
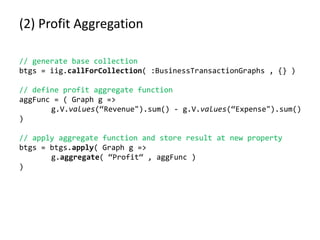
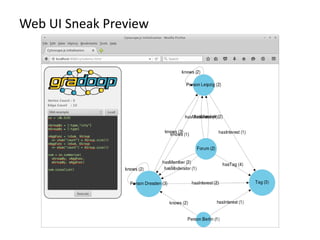
![Benchmarks Sneak Preview
0
200
400
600
800
1000
1200
1400
1 2 4 8 16
Time [s]
# Worker
Summarization (Vertex and Edge Labels)
16x Intel(R) Xeon(R) CPU E5-2430 v2 @ 2.50GHz (12 Cores), 48 GB RAM
Hadoop 2.5.2, Flink 0.9.0
slots (per node) 12
jobmanager.heap.mb 2048
taskmanager.heap.mb 40960
Foodbroker Graph (https://github.com/dbs-leipzig/foodbroker)
Generates BI process data
858,624,267 Vertices, 4,406,445,007 Edges, 663GB Payload](https://image.slidesharecdn.com/gradoopflinkforward-151014071436-lva1-app6891/85/Gradoop-Scalable-Graph-Analytics-with-Apache-Flink-Flink-Forward-2015-68-320.jpg)


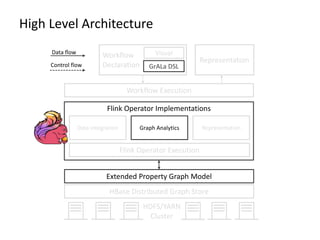
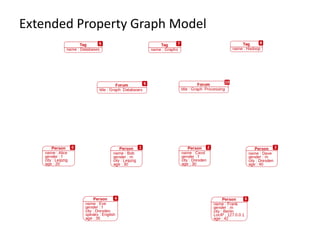
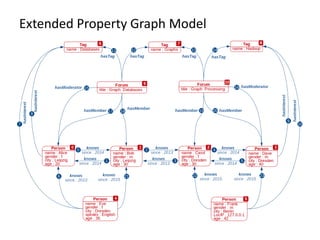
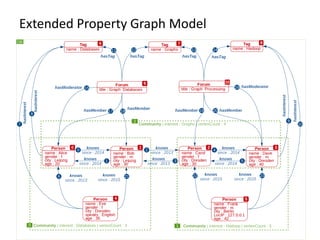
The document provides an overview of Gradoop, a scalable graph analytics platform using Apache Flink, highlighting its architecture, data integration, and graph analytics capabilities. It also discusses the significance of graph data in various applications, particularly in business intelligence, and emphasizes the need for an end-to-end framework for effective graph data management. Key features, operators, and use cases are illustrated to demonstrate the platform's ability to analyze complex relationships within large datasets.