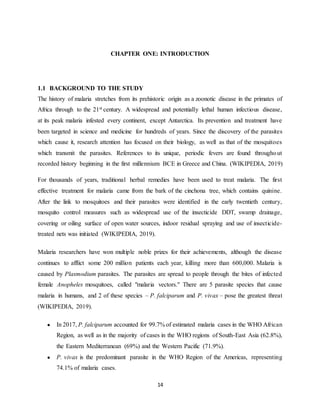
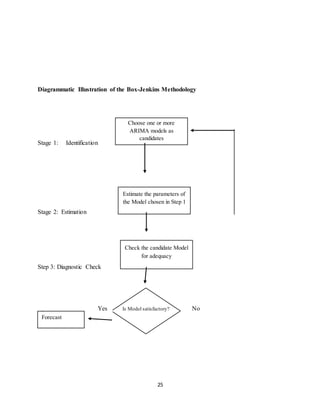
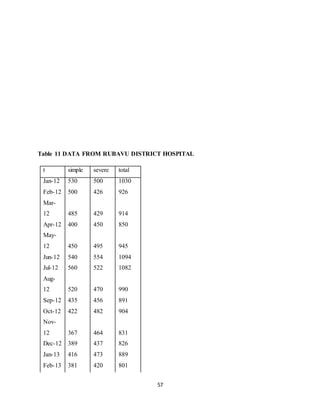
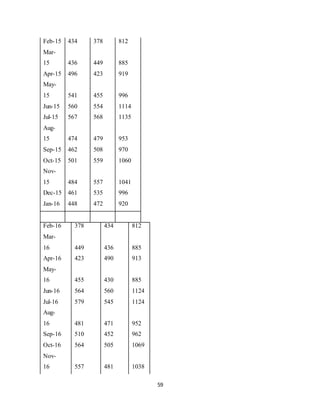
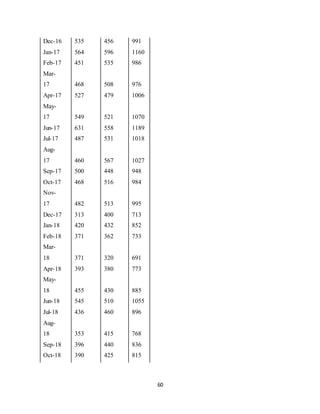
SlideShare a Scribd company logo
MAKERERE UNIVERSITY
COLLEGE OF BUSINESS AND MANAGEMENT SCIENCES
SCHOOL OF STATISTICS AND PLANNING
TIME SERIES ANALYSIS OF MALARIA CASES IN RWANDA FOR THE PERIOD
2012-2018: A CASE STUDY OF RUBAVU HOSPITAL
BY
MUDAHERANWA AUGUSTINE KING
16/X/2336/EVE
A DISSERTATION SUBMITTED TO THE SCHOOL OF STATISTICS AND
PLANNING IN PARTIAL FULFILMENT OF THE REQUIREMENTS FOR THE
AWARD OF DEGREE OF BACHELOR OF SCIENCE IN QUANTITATIVE
ECONOMICS OF MAKERERE UNIVERSITY KAMPALA
AUGUST 2019
2
DECLARATION
I, MUDAHERANWA AUGUSTIN KING, declare that this work is original and has never been
presented to any institution of higher learning or organization by any person for the award of any
qualification.
Signature …………………. Date …./…./……
MUDAHERANWA AUGUSTIN KING
Student
3
APPROVAL
This dissertation of MUDAHERANWA AUGUSTIN KING has been approved as partial
fulfillment of the requirements for the award of the degree of Bachelor of Science in Quantitative
Economics of Makerere University.
Signature ………………………….
Date ……………………………….
James Wokadala, PhD
School of Statistics and Planning
4
DEDICATION
I dedicate this piece of work to my mother Uwera and my cousin late Kayitare in his memory.
5
ACKNOWLEDGMENT
My Lord and God! You are worthy to be glorified and honored, for you created all things. Had it
not been for your grace, this report would not be a success. Boundless thanks to many who in one
way or the other assisted in the preparation of this report. First and foremost, to my family for the
encouragement, support and cheerleading.
Many thanks to my supervisor James Wokadala Ph.D. the Dean at the School of Statistics and
Planning. His tireless and selfless dedication of time since the beginning of this research to its
completion. My whole brain could function at its best because I was always challenged by his
questions. Had it not been his constructive criticisms, comments, and corrections, this research
would have been impossible.
In a special way, I am really grateful to Rubavu district hospital especially the director of the
Hospital Lt.Col. Kanyankore William who helped me get all the data I needed for this research
project. I highly believe that this research will be of help to the hospital. Finally, I want to thank
everyone who has been with me for this undergraduate course, directly or indirectly. I must say,
am humbled for having met you.
ABSTRACT
6
The main objective of the study was to establish the time-series properties of malaria cases in
Rwanda. In this study, secondary data was collected from the hospital’s data records on malaria
cases with respect to year and severity. The data collected was thereafter entered, analysed using
Ms Excel and STATA. Tests of hypotheses using the Dickey-Fuller test at 95% confidence level
were done to determine whether there was a trend in malaria incidence. An ARIMA model was
then fitted in order to provide a more reliable forecast.
The results from the study revealed that malaria cases are highly affected by seasons. In Rwanda,
there are two seasons, dry seasons that occur from June to mid-September, then from December
to February that record a large number of malaria cases. The wet season starts from March to May,
then from October to November that records a slight decrease in malaria cases. It was also found
out that malaria incidence was estimated to be decreasing in the future though at a slow rate.
Arising from the study, two recommendations were proposed; First, preventive care should be a
priority. People should be sensitized on the importance of mosquito nets, indoor Residual
Spraying. Second, awareness of mosquito activity, factors that attract mosquitoes such as bushes
and swamps, the different seasons for mosquito activity should be provided through education and
media.
7
LIST OF ABBREVIATIONS
DDT Dichlorodiphenyltrichloroethane
IPTP Intermittent Preventive Treatment of Pregnant women
IRS Indoor Residual Spraying
ITNs Insecticide-Treated mosquito Nets
MOH Ministry Of Health
PMI President’s Malaria Initiative
WHO World Health Organization
8
TABLE OF CONTENTS
LIST OF TABLES viii
CHAPTER ONE: INTRODUCTION 1
1.1 14
1.2 Error! Bookmark not defined.
1.3 16
1.5 16
1.6 16
CHAPTER TWO: LITERATURE REVIEW 5
2.1 INTRODUCTION 5
2.2 DEFINITION AND FACTS ABOUT MALARIA 5
CHAPTER THREE: METHODOLOGY 11
3.1 Data collection procedure 11
3.3Data editing 11
3.4Data analysis 11
3.5.1.Univariate analysis 11
3.5.2.Time Series analysis 11
CHAPTER FOUR: PRESENTATION, ANALYSIS, AND INTERPRETATION OF FINDINGS 14
4.0 Introduction 14
4.1 Hypothesis testing 14
4.1.1 Research Hypothesis One 14
Time series plot of simple Malaria cases 15
4.1.2 Research Hypothesis Two 16
Time series plot for Severe Malaria cases 17
9
4.1.3 Research Hypothesis Three 18
Time series plot for total malaria cases 20
Correlogram for simple malaria cases 21
Partial correlogram for simple malaria cases 22
4.2 Arima model for Simple Malaria cases 23
Correlogram for severe malaria cases 24
Partial correlogram for severe malaria cases 25
4.3 Arima model for Severe Malaria cases 26
Correlogram for total malaria cases 27
Partial correlogram for total malaria cases 28
CHAPTER FIVE: SUMMARY, CONCLUSIONS, AND RECOMMENDATIONS 30
5.0 Introduction 30
5.1 SUMMARY AND CONCLUSIONS 30
5.1.1 Simple Malaria 30
5.1.2 Severe Malaria 30
5.1.3 Total Malaria 30
5.2 RECOMMENDATIONS 31
REFERENCES 35
10
11
LIST OF FIGURES
Figure 1 Timeseries plot for simple malaria cases 18
Figure 2 Timeseries plot for severe malaria cases 20
Figure 3 Time series plot for total malaria cases Error! Bookmark not defined.
Figure 4 Correlogram for simple malaria cases 23
Figure 5 Partial correlogram for simple malaria cases 24
Figure 6 25
Figure 7 Correlogram for severe malaria cases 26
Figure 8 Partial correlogram for severe malaria cases 27
Figure 9 28
Figure 10 Correlogram for total malaria cases 29
Figure 11 Partial correlogram for total malaria cases 30
Figure 12 31
Figure 13 Cumulative Periodogram white-noise test for simple malaria cases 32
Figure 14 Cumulative Periodogram White-Noise test for severe malaria cases 33
Figure 15 Cumulative Periodogram white-noise test for total malaria cases 34
12
LIST OF TABLES
Table 1 Dickey fuller test for simple malaria cases 17
Table 2 Dickey fuller test for severe malaria cases 19
Table 3 Dickey fuller test for total malaria cases 21
Table 4 White noise test output for normality of residual simple malaria cases 32
Table 5 White noise test output for normality of severe malaria cases 33
Table 6 White noise test output for normality of total malaria cases 33
Table 7 regression analysis for simple malaria cases 34
Table 8 regression analysis for severe malaria cases 35
Table 9 regression analysis for total malaria cases 36
Table 10 forecast for malaria cases 37
Table 11 DATA FROM RUBAVU DISTRICT HOSPITAL 39
13
14
CHAPTER ONE: INTRODUCTION
1.1 BACKGROUND TO THE STUDY
The history of malaria stretches from its prehistoric origin as a zoonotic disease in the primates of
Africa through to the 21st century. A widespread and potentially lethal human infectious disease,
at its peak malaria infested every continent, except Antarctica. Its prevention and treatment have
been targeted in science and medicine for hundreds of years. Since the discovery of the parasites
which cause it, research attention has focused on their biology, as well as that of the mosquitoes
which transmit the parasites. References to its unique, periodic fevers are found throughout
recorded history beginning in the first millennium BCE in Greece and China. (WIKIPEDIA, 2019)
For thousands of years, traditional herbal remedies have been used to treat malaria. The first
effective treatment for malaria came from the bark of the cinchona tree, which contains quinine.
After the link to mosquitoes and their parasites were identified in the early twentieth century,
mosquito control measures such as widespread use of the insecticide DDT, swamp drainage,
covering or oiling surface of open water sources, indoor residual spraying and use of insecticide-
treated nets was initiated (WIKIPEDIA, 2019).
Malaria researchers have won multiple noble prizes for their achievements, although the disease
continues to afflict some 200 million patients each year, killing more than 600,000. Malaria is
caused by Plasmodium parasites. The parasites are spread to people through the bites of infected
female Anopheles mosquitoes, called "malaria vectors." There are 5 parasite species that cause
malaria in humans, and 2 of these species – P. falciparum and P. vivax – pose the greatest threat
(WIKIPEDIA, 2019).
● In 2017, P. falciparum accounted for 99.7% of estimated malaria cases in the WHO African
Region, as well as in the majority of cases in the WHO regions of South-East Asia (62.8%),
the Eastern Mediterranean (69%) and the Western Pacific (71.9%).
● P. vivax is the predominant parasite in the WHO Region of the Americas, representing
74.1% of malaria cases.
15
Malaria is an acute febrile illness. In a non-immune individual, symptoms usually appear 10–15
days after the infective mosquito bite. The first symptoms – fever, headache, and chills – may be
mild and difficult to recognize as malaria. If not treated within 24 hours, P. falciparum malaria
can progress to severe illness, often leading to death.
1.2 PROBLEM STATEMENT
Since 2004 malaria interventions in Rwanda have resulted in a substantial decline in malaria
incidence. However, this achievement is fragile as potentials for local malaria transmissions
remain. The risk of getting malaria infection is partially explained by the social conditions of
vulnerable populations (Bizimana, 2015)
Vector control is the main way to prevent and reduce malaria transmission. If coverage of vector
control interventions within a specific area is high enough, then a measure of protection will be
conferred across the community.
Transmission also depends on climatic conditions that may affect the number and survival of
mosquitoes, such as rainfall patterns, temperature, and humidity. In many places, transmission is
seasonal, with the peak during and just after the rainy season. Malaria epidemics can occur when
climate and other conditions suddenly favor transmission in areas where people have little or no
immunity to malaria. They can also occur when people with low immunity move into areas with
intense malaria transmission, for instance to find work, or as refugees (WHO, 2002).
Human immunity is another important factor, especially among adults in areas of moderate or
intense transmission conditions. Partial immunity is developed over years of exposure, and while
it never provides complete protection, it does reduce the risk that malaria infection will cause
severe disease. For this reason, most malaria deaths in Africa occur in young children, whereas in
areas with less transmission and low immunity, all age groups are at risk.
Efforts have been made to reduce on the malaria incidence such as the PRESIDENT’S MALARIA
INITIATIVE (PMI) which was launched in 2005 and implementation as a PMI focus country in
2007. More details will be available in the literature review.
16
despite all these efforts to intervene, no study has been conducted to address the problem of time
series modeling which will can help the government and other concerned parties to make the
necessary planning as far as malaria is concerned, which is the purpose of this study.
1.2 OBJECTIVES
Main Objective
● The main objective of the study is to conduct a time series analysis of MALARIA cases in
Rwanda.
Specific objectives
● To establish the time-series properties of malaria cases
● To estimate the ARIMA model of the malaria cases
● To fit trends and forecast the malaria cases in RUBAVU hospital.
1.3 HYPOTHESES
● The occurrence of simple malaria is trended.
● The occurrence of severe malaria is trended.
● The occurrence of total malaria is trended.
1.4 SCOPE AND COVERAGE OF THE STUDY
The study will cover simple and severe malaria cases that were registered in Gisenyi hospital for the
period of January 2012 to December 2018. The study will go beyond descriptive analysis to
a time series analysis of annual registration of malaria cases by type of malaria.
1.5 SIGNIFICANCE OF THE STUDY
The study is relevant to the Government and Medical society at large who will use this model
predictions to know how they can plan for the treatment, control and prevention of the
17
disease and how much money the Government and its development partners will spend in
the future.
18
CHAPTER TWO: LITERATURE REVIEW
2.1 INTRODUCTION
This chapter consists of previous interventions and research that was done related to the study.
Most literature presented here concentrates on the epidemiology of malaria and its control
measures.
2.2 DEFINITION AND FACTS ABOUT MALARIA
Malaria also known as plasmodium infection is a disease caused by a plasmodium parasite
transmitted by the bite of infected female anopheles mosquitoes. According to the World Health
Organization (WHO), most malaria cases and deaths occur in sub-Saharan Africa.
In Rwanda approximately 90% of Rwandans are at risk of malaria. Malaria is the leading cause of
morbidity(condition of being diseased) and mortality in Rwanda according to WHO. In 2005
Rwanda reported 991,612 malaria cases (WHO, 2003)
According to ministry of health (MOH), malaria cases in Rwanda rose at 68.6% in 2014 against
947,689 cases in 2013. The MOH attributed this increase in the number of malaria cases to poor
quality of mosquito nets.
According to the malaria operational plan financial year 2018, when the PMI was launched in
2005, the goal was to reduce malaria- related mortality by 50% across 15 high burden countries in
sub-Saharan Africa through a rapid scale up of four proven and highly effective malaria prevention
and treatment measures:
● Insecticide-treated mosquito nets(ITNs)
● Indoor residual spraying(IRS)
● Accurate diagnosis and prompt treatment with artemisinin-based combination therapies
and
Intermittent preventive treatment of pregnant women(IPTp)
19
So far 81% of households have at least one ITN (National Institute of Statistics of Rwanda, 2016).
73 percent of pregnant women age 15 to 49 slept under any net the night before the survey.
(National Institute of Statistics of Rwanda, 2016)
A study that was done in Mozambique showed that the majority of respondents perceived the
effectiveness of the IRS as limited, a large proportion accepted the intervention to combat malaria
due to diverse motivations. The findings suggest that trusted community leaders and spray
mobilizers communicate with households that IRS kills the mosquitoes that cause malaria. (Sergio
Chicumbe, 2019)
Malaria is both curable and preventable with medication; however, a vaccine is not available.
According to WHO, in 2012, there were approximately 207 million cases of malaria resulting in
627,000 deaths (WHO, 2014). The overwhelming majority that is 90% of these cases occur in
Africa (Council, 2001). Most of the deaths occur in children. However, the rate of deaths in
children has been reduced by 54% since 2000 (WHO, 2014). The countries with most confirmed
cases are in sub-Saharan Africa and India (Time series analysis of Malaria in Kumasi using
ARIMA models to forecast future incidence ). Moreover, malaria contributed to 2.05% to the total
global death in 2000 and was responsible for 9% of all death in Africa (WHO, 2003). WHO also
estimated that the cost of malaria in Africa was US$ 1.08 billion in 1995 and US$ 2 billion in 1997
(WHO, 1997).
According to the WHO report, estimates of 3.3 billion people are at risk of malaria, of which 1.2
billion are at high risk. In a high-risk area, more than one malaria case occurs per 1000 population
(WHO, 2014). 2005 edition of the daily graphic, it was reported that 2000 pregnant women and
15000 children below the age of five died of malaria. The ministry of health reported that a quarter
of these cases of child mortality were attributed to malaria, which he said was responsible for 36%
of all admissions in the country hospital over ten years (Elvis Adam, 2017)
● Malaria is a life-threatening disease caused by parasites that are transmitted to people
through the bites of infected female Anopheles mosquitoes. It is preventable and curable.
● In 2017, there were an estimated 219 million cases of malaria in 87 countries.
● The estimated number of malaria deaths stood at 435 000 in 2017.
20
● The WHO African Region carries a disproportionately high share of the global malaria
burden. In 2017, the region was home to 92% of malaria cases and 93% of malaria deaths.
● Total funding for malaria control and elimination reached an estimated US$ 3.1 billion in
2017. Contributions from governments of endemic countries amounted to US$ 900 million,
representing 28% of total funding.
According to the latest World malaria report, released on November 2018, there were 219 million
cases of malaria in 2017, up from 217 million cases in 2016. The estimated number of malaria
deaths stood at 435 000 in 2017, a similar number to the previous year. The WHO African Region
continues to carry a disproportionately high share of the global malaria burden. In 2017, the region
was home to 92% of malaria cases and 93% of malaria deaths.In 2017, 5 countries accounted for
nearly half of all malaria cases worldwide: Nigeria (25%), the Democratic Republic of the Congo
(11%), Mozambique (5%), India (4%) and Uganda (4%) (world malaria report, 2018).
Children under 5 years of age are the most vulnerable group affected by malaria; in 2017, they
accounted for 61% (266 000) of all malaria deaths worldwide.In most cases, malaria is transmitted
through the bites of female Anopheles mosquitoes. There are more than 400 different species of
Anopheles mosquito; around 30 are malaria vectors of major importance. All of the important
vector species bite between dusk and dawn. The intensity of transmission depends on factors
related to the parasite, the vector, the human host, and the environment.
Anopheles mosquitoes lay their eggs in water, which hatch into larvae, eventually emerging as
adult mosquitoes. The female mosquitoes seek a blood meal to nurture their eggs. Each species of
Anopheles mosquito has its own preferred aquatic habitat; for example, some prefer small, shallow
collections of freshwater, such as puddles and hoof prints, which are abundant during the rainy
season in tropical countries.
Transmission is more intense in places where the mosquito lifespan is longer (so that the parasite
has time to complete its development inside the mosquito) and where it prefers to bite humans
rather than other animals. The long lifespan and strong human-biting habit of the African vector
species is the main reason why approximately 90% of the world's malaria cases are in Africa.
21
WHO recommends protection for all people at risk of malaria with effective malaria vector control.
Two forms of vector control – insecticide-treated mosquito nets and indoor residual spraying – are
effective in a wide range of circumstances.
Sleeping under an insecticide-treated net (ITN) can reduce contact between mosquitoes and
humans by providing both a physical barrier and an insecticidal effect. Population-wide protection
can result from the killing of mosquitoes on a large scale where there is high access and usage of
such nets within a community.
In 2017, about half of all people at risk of malaria in Africa were protected by an insecticide-
treated net, compared to 29% in 2010. However, ITN coverage increased only marginally in the
period 2015 to 2017.
Indoor residual spraying (IRS) with insecticides is another powerful way to rapidly reduce malaria
transmission. It involves spraying the inside of housing structures with an insecticide, typically
once or twice per year. To confer significant community protection, IRS should be implemented
at a high level of coverage (WIKIPEDIA, 2019).
Since 2012, WHO has recommended seasonal malaria chemoprevention as an additional malaria
prevention strategy for areas of the Sahel sub-region of Africa. The strategy involves the
administration of monthly courses of amodiaquine plus sulfadoxine-pyrimethamine to all children
under 5 years of age during the high transmission season.
Since 2000, progress in malaria control has resulted primarily from expanded access to vector
control interventions, particularly in sub-Saharan Africa. However, these gains are threatened by
emerging resistance to insecticides among Anopheles mosquitoes. According to the latest World
malaria report, 68 countries reported mosquito resistance to at least 1 of the 5 commonly-used
insecticide classes in the period 2010-2017; among these countries, 57 reported resistance to 2 or
more insecticide classes (world malaria report, 2017).
Despite the emergence and spread of mosquito resistance to pyrethroids (the only insecticide class
used in ITNs), insecticide-treated nets continue to provide a substantial level of protection in most
22
settings. This was evidenced in a large 5 country study coordinated by WHO between 2011 and
2016.
While the findings of this study are encouraging, WHO continues to highlight the urgent need for
new and improved tools in the global response to malaria. To prevent an erosion of the impact of
core vector control tools, WHO also underscores the critical need for all countries with ongoing
malaria transmission to develop and apply effective insecticide resistance management strategies
(WHO, 2002).
Early diagnosis and treatment of malaria reduces disease and prevents deaths. It also contributes
to reducing malaria transmission. The best available treatment, particularly for P. falciparum
malaria, is artemisinin-based combination therapy (ACT).
WHO recommends that all cases of suspected malaria be confirmed using parasite-based
diagnostic testing (either microscopy or rapid diagnostic test) before administering treatment.
Results of parasitological confirmation can be available in 30 minutes or less. Treatment, solely
on the basis of symptoms should only be considered when a parasitological diagnosis is not
possible. More detailed recommendations are available in the "WHO Guidelines for the treatment
of malaria", third edition, published on April 2015.
At the World Health Assembly in May 2015, WHO launched the Strategy for malaria elimination
in the Greater Mekong sub region (2015–2030), which was endorsed by all the countries in the
sub region. Urging immediate action, the strategy calls for the elimination of all species of human
malaria across the region by 2030, with priority action targeted to areas where multidrug-resistant
malaria has taken root. Surveillance entails tracking of the disease and programmatic responses
and taking action based on the data received. Currently, many countries with a high burden of
malaria have weak surveillance systems and are not in a position to assess disease distribution and
trends, making it difficult to optimize responses and respond to outbreaks.
Effective surveillance is required at all points on the path to malaria elimination. Stronger malaria
surveillance systems are urgently needed to enable a timely and effective malaria response in
endemic regions, to prevent outbreaks and resurgences, to track progress, and to hold governments
and the global malaria community accountable.Malaria elimination is defined as the interruption
23
of local transmission of a specified malaria parasite species in a defined geographical area as a
result of deliberate activities. Malaria eradication is defined as the permanent reduction to zero of
the worldwide incidence of malaria infection caused by human malaria parasites as a result of
deliberate activities. Interventions are no longer required once eradication has been achieved
(WHO, 1997).
Countries that have achieved at least 3 consecutive years of 0 local cases of malaria are eligible to
apply for the WHO certification of malaria elimination. In recent years, 9 countries have been
certified by the WHO Director-General as having eliminated malaria: United Arab Emirates
(2007), Morocco (2010), Turkmenistan (2010), Armenia (2011), Maldives (2015), Sri Lanka
(2016), Kyrgyzstan (2016), Paraguay (2018) and Uzbekistan (2018). The WHO Framework for
Malaria Elimination (2017) provides a detailed set of tools and strategies for achieving and
maintaining elimination (framework for malaria elimination, 2017).
24
CHAPTER THREE: METHODOLOGY
3.1 Data collection procedure
Quantitative data will be collected which will be purely secondary in nature. It will be collected
from the RUBAVU Hospital. The data will be collected on the following variables;
1. severity
2. Year
3.2 Data sources
Data was collected from the RUBAVU Hospital website and from the MALARIA registry of the
hospital. It consists of a number of MALARIA cases in the registry for the past five years.
3.3 Data editing
The data was entered into a Microsoft Excel spreadsheet, cross-checked for consistency,
correctness and reliability to ensure that it is perfect before analysis can be done.
3.4 Data analysis
The quantitative data were analyzed using STATA. The analysis will be done at uni-variate
level.
3.5.1.Univariate analysis
At the univariate level, data analysis was based on Box-Jenkins methodology for testing the
distribution and forecasting the time series and was done in four stages.
3.5.2.Time Series analysis
The time series analysis of Malaria cases will follow the Box -Jenkins Methodology.
25
Diagrammatic Illustration of the Box-Jenkins Methodology
Stage 1: Identification
Stage 2: Estimation
Step 3: Diagnostic Check
Choose one or more
ARIMA models as
candidates
Estimate the parameters of
the Model chosen in Step 1
Check the candidate Model
for adequacy
Forecast
Is Model satisfactory? NoYes
26
First, the time series was summarized using line plots to provide an insight into the nature of the
data. The data was then tested for stationarity as a requirement for Box-Jenkins criteria using the
Augmented Dickey Fuller (ADF) test. In case the series were not stationary, further differencing
was be done to achieve stationarity. Secondly, a series of ARIMA (Autoregressive Integrated
Moving Average) models were fitted and investigated for suitability. The appropriate model lags
were obtained by plotting the Autocorrelation Function (ACF) and Partial Autocorrelation
Function (PACF) on the correlogram plot. The selected lags were tested to assess the invertibility
condition for the AR and MA models and the white noise tests will be made to ascertain whether
the variables are independent. Furthermore, using an appropriate model, the principle of parsimony
was put into consideration thus the smallest number of coefficients were used to explain the data.
Thirdly, the estimated model was used to make a forecast of malaria cases by severity and
predicted series were plotted on a graph.
Identification
Identification process started with preliminary examinations of Malaria series to establish
their stationary properties by observing the behavior of series using graphical plots. Where
a trend was observed the series were differenced to make them stationary-oscillating about
the mean. In addition, Autocorrelation (ACF) and Partial Correlation Function (PACF)
plots for the series in level and in differenced from were examined. Identification of the
appropriate ARIMA (p, d, q) structure followed from Johnston & Dinardo summarized in
the table below;
Table 3.2: Model Identification parameters
Model Structure ACF PACF
27
AR(p) Damps out towards zero Cuts-off after lag p
MA(q) Cuts-off after lag q Damps out towards zero
ARIMA Damps out towards zero Decays-off towards
The ARIMA Model Estimation
The study followed ARIMA (p,d,q) process proposed by the Box and Jenkins (1976). Where p is
the order of AR(p) process, q relates to the order of MA(q) process and d is the order of integration.
The appropriate ARIMA (p,d,q) model was selected based on suitable AR(q) and MA(q) process
obtained through an iterative process starting from maximum lag of 12 dictated data frequency
and the procedure adopted from Meyler et at. (1998) and Alnaa & Abdul-Mumuni (2005). The
standard ARIMA (p,d,q) model takes the form below:
Yt = φtYt-1+ φ2Yt-2 …+φpYt-p + ϵt - θ1 ϵt-1 - θ2ϵt-2 …- θqϵt-q
Where;
Yt = First difference of malaria cases
P = lag order of AR process component
q = lag order of MA process component
ϵt = error term at time t
Yt, Yt-1, …. Yt-p = lagged difference malaria cases
ϵt-1, ϵt-2, …, ϵt-q = lagged residuals
φp, φ2…, φp, θ1, θ2, …, θq are parameters to be estimated.
28
Diagnostics Checking
The Bartlett’s white noise test ascertains whether the obtained residuals are independent. Bartlett’s
white noise test was performed to determine whether the model selected is good for the data.
Regression analysis was later carried out to test the suitability of the estimated models for
forecasting and fit the model.
3.5.3 Analytical Method
A simple linear regression model using Microsoft Excel for univariate analysis was fitted to predict
the malaria cases by severity in Rwanda as shown below;
Y=Bo + BiXi + ϵi
Where
Y = number malaria cases
Bo = constant term
Xi = previous year
ϵi = Error term at time i
3.5.4 Test ofSignificance
The study adopted a 95% confidence level to determine the statistical significance of the
independent variables in relation to the independent variables. The hypotheses were accepted if
the p-value was less than the 5% level of significance and rejected if the p-value is greater than
5%. The adjusted R-squared and coefficients of determination showed how the variation in malaria
cases is explained by malaria occurrence in the previous years .
3.6 Limitations
There was limited data on malaria cases below year 2012 making current assumptions based on
old data was difficult. Thus it would be better if there were more data in order to expand the years
and forecasting Horizon.
29
30
CHAPTER FOUR: PRESENTATION, INTERPRETATION, AND DISCUSSION OF
THE FINDINGS
4.0 Introduction
In this chapter, data is presented, analysed and interpreted. Results are presented in various tables
and graphs for visual analysis and descriptive statistics. The Augmented Dickey-Fuller test statistic
was used to carry out hypothesis testing for the study hypotheses tested in chapter one, from which
interpretation is made.
4.1 Hypothesis testing
In testing hypotheses, The Augmented Dickey-Fuller test statistic was used to carry out hypothesis
testing, using STATA to test for Stationarity by focusing on only two values of the result; Z(t)
and Mackinnon p-value for Z(t) and For a time-series data to be stationary, the Z(t) should;
• have a large negative number.
• p-value should be significant at least on 5% level.
If neither conditions are met in this test, the null hypothesis i.e. time series data is non-stationary,
cannot be rejected.
4.1.1 Research Hypothesis One
H0: Simple Malaria cases are not trended
Ha: Simple Malaria cases are trended
Calculation:
Dickey fuller test for simple malaria cases
dfuller simple, lags(0)
Dickey-Fuller test for unit root Number of obs = 83
31
Table 1 Dickey fuller test for simple malaria cases
---------- Interpolated Dickey-Fuller ---------
Test
Statistic
1%
Critical
Value
5%
Critical
Value
10% Critical
Value
Z(t
)
-
4.238
-3.534 -2.904 -2.587
Source: compiled by researcher from STATA
MacKinnon approximate p-value for Z(t) = 0.0006
The Zt value is a large negative value (-4.238) and the p-value is less than 0.05 (0.0006) , we fail
to reject the null hypothesis and we conclude that simple malaria occurrence is not trended.
Time series plot of simple Malaria cases
● The Y-axis represents the occurrence of simple Malaria cases.
● The X-axis represents time in months.
32
Figure 1 Time series plot for simple malaria cases
Source: compiled by researcher from STATA
4.1.2 Research Hypothesis Two
H0: Occurrence of Severe Malaria cases is not trended.
Ha: Occurrence of Severe Malaria cases is trended.
Calculation :
Dickey fuller test for severe malaria cases
dfuller severe, lags(0)
Dickey-Fuller test for unit root Number of obs = 83
33
Table 2 Dickey fuller test for severe malaria cases
---------- Interpolated Dickey-Fuller ---------
Test
Statisti
c
1%
Critical
Value
5% Critical
Value
10% Critical
Value
Z(t
)
-4.906 -3.534 2.587 -2.904 -
MacKinnon approximate p-value for Z(t) = 0.0000
Source: compiled by researcher from STATA
The Zt value is a large negative value (-4.906) and the p-value is less than 0.05 (0.000) , we fail to
reject the null hypothesis and we conclude that severe malaria occurrence is not trended.
Time series plot for Severe Malaria cases
● The Y-axis represents simple Malaria cases.
● The X-axis represents time in months.
34
Figure 2 Time series plot for severe malaria cases
Source: compiled by researcher from STATA
4.1.3 Research Hypothesis Three
H0: The occurrence of malaria cases is not trended.
Ha: ccurrence of malaria cases is trended.
Calculation:
35
Table 3 Dickey fuller test for total malaria cases
dfuller total , lags(0)
Dickey-Fuller test for unit root Number of observations = 83
---------- Interpolated Dickey-Fuller ---------
Test
Statisti
c
1%
Critical
Value
5%
Critical
Value
10% Critical
Value
Z(t
)
-4.282 -3.534 -2.587 -2.904
MacKinnon approximate p-value for Z(t) = 0.0005
Source: compiled by researcher from STATA
The Zt value is a large negative(-4.282) and the p-value is less than 0.05 (0.0005), we fail to reject
the null hypothesis and we conclude that malaria occurrence is not trended.
Figure SEQ Figure * ARABIC3 Time series plot for total malaria cases
36
Source: compiled by researcher from STATA
From the diagram above, it was observed that malaria cases have fallen and hit their lowest in
june 2018 with cases less than 700. The effect of seasons also affected the cases as dry seasons
recorded a large number of cases and wet seasons recorded a small number of malaria cases.
7
0
8
0
9
0
1
0
1
1
1
2
to
ta
Jul
-12
Jan
-14
Jul
-15
Jan
-17
Jul
-18t
37
Figure 4 Correlogram for simple malaria cases
Source: compiled by researcher from STATA
The above correlogram for malaria cases showed that only one lag is highly correlated and is
outside our confidence interval which determined our p to be one (p=1)
38
Figure 5 Partial correlogram for simple malaria cases
Source: compiled by researcher from STATA
The above correlogram for malaria cases showed that only one lag is highly correlated and is
outside our confidence interval which determined our p to be one (q=0)
39
4.2 Arima model for Simple Malaria cases
Figure 6
Source: compiled by researcher from STATA
From the ARIMA model above, there was significant high correlation in the series since the results
show that AR(1) coefficient is 0.614 and is highly significant since the first lag is significant since
the P value is less than the critical (P<0.05) .
40
41
Figure 7 Correlogram for severe malaria cases
Source: compiled by researcher from STATA
The above correlogram for malaria cases showed that only one lag is highly correlated and is
outside our confidence interval which determined our p to be one (p=1)
42
Figure 8 Partial correlogram for severe malaria cases
Source: compiled by researcher from STATA
The above partial correlogram for malaria cases showed that only two lags are highly correlated
and is outside our confidence interval which determined our p to be one (q=2).
43
4.3 Arima model for Severe Malaria cases
Figure 9
Source: compiled by researcher from STATA
44
From the ARIMA model above, there significant high correlation in the series since the results
show that AR(1) coefficient is -0.303, AR(2) coefficient is 0.377 and MA(1) coefficient is 1.00003
and all are highly significant the first lag is significant since the P value is less than the critical
(P<0.05) .
Figure 10 Correlogram for total malaria cases
Source: compiled by researcher from STATA
The above correlogram for malaria cases showed that only one lag is highly correlated and is
outside our confidence interval which determined our p to be one (p=1).
45
46
Figure 11 Partial correlogram for total malaria cases
Source: compiled by researcher from STATA
The above partial correlogram for malaria cases showed that only three lags are highly correlated
and is outside our confidence interval which determined our q to be zero (q=3).
47
4.4 Arima model for Total Malaria cases
Figure 12
Source: compiled by researcher from STATA
From the ARIMA model above, there significant high correlation in the series since the results
show that AR(1) coefficient is 0.616 and is highly significant the first lag is significant since the P
value is less than the critical (P<0.05) .
48
4.5 Diagnostics Tests
The Bartlett’s white noise test ascertains whether the obtained residuals are independent. Bartlett’s
white noise test was performed to determine whether the model selected is good for the data.
Regression analysis was later carried out to test the suitability of the estimated models for
forecasting and fit the model.
4.5.1 White noise testfor malaria cases by severity and total
Using the portmanteau white noise test for normality of the residuals yields the following results.
Table 4 White noise test output for normality of residual simple malaria cases
Portmanteau (Q) Statistic 6.4317
Prob >chi2(1) 0.0394
Basing on table 4.5 results of portmanteau white noise, P=0.0394<0.05. It can thus be concluded
that the residuals of simple malaria series are not independent.
Figure 13 Cumulative Periodogram white-noise test for simple malaria cases
But the Figure 4.30 above has a plot of the cumulative periodogram that doesn’t appear outside
the confidence interval which implies the fitted model is appropriate for forecasting.
49
Table 5 White noise test output for normality of severe malaria cases
Portmanteau (Q) Statistic 8.2645
Prob >chi2(1) 0.028
Basing on table 4.6 results of portmanteau white noise, P=0.028<0.05. It can thus be concluded
that the residuals of severe malaria series are independent.
Figure 14 Cumulative Periodogram White-Noise test for severe malaria cases
Figure 4.31 above has a plot of the cumulative periodogram that doesn’t appear outside the
confidence interval which implies that the fitted model is appropriate for forecasting.
Table 6 White noise test output for normality of total malaria cases
Portmanteau (Q) Statistic 7.6727
Prob >chi2(1) 0.0345
Basing on table 4.7 results of portmanteau white noise, P=0.0345<0.05. It can thus be concluded
that the residuals of total malaria cases series are not independent.
50
Figure 15 Cumulative Periodogram white-noise test for total malaria cases
But the Figure 4.32 above has a plot of the cumulative periodogram that doesn’t appear outside
the confidence interval which implies the fitted model is appropriate for forecasting.
4.6 Regressionanalysis
Table 7 regression analysis for simple malaria cases
Regression Statistics
Multiple R 0.121469
9
R Square 0.614754
94
Adjusted R
Square
0.622739
75
Standard Error 70.06910
25
Observations 84
ANOVA
51
df SS MS F Significan
ce F
Regression 1 6029.2048
24
6029.2
05
15.2280
24
0.0310314
61
Residual 82 402593.68
8
4909.6
79
Total 83 408622.89
29
Coefficie
nts
Standard
Error
t Stat P-value Lower
95%
Upper
95%
Lower
95.0%
Upper
95.0%
Intercept 484.8855
42
15.427878
7
31.429
18
1.68E-
47
454.19457
68
515.57
65
454.19
46
515.57
65
X Variable 1 -
0.349407
7
0.3153036
7
-
1.1081
6
0.27103
1
-
0.9766471
56
0.2778
32
-
0.9766
5
0.2778
32
Our model was simple malaria= 484.88 – 0.349t
From the table above it was observed that the coefficient of determination(R squared) is 61.4% which
meant that the model is a good fit and the probability value was 0.03 which is less than the critical 0.05
implying significance.
Table 8 regression analysis for severe malaria cases
Regression Statistics
Multiple R 0.011525
R Square 0.72133
Adjusted R
Square
0.73206
Standard Error 60.03489
Observations 84
ANOVA
52
df SS MS F Significan
ce F
Regression 1 39.264
07
39.264
07
22.0108
94
0.017127
Residual 82 295543
.4
3604.1
88
Total 83 295582
.7
Coefficien
ts
Standar
d Error
t Stat P-value Lower
95%
Upper
95%
Lower
95.0%
Upper
95.0%
Intercept 469.7421 13.218
54
35.536
62
1.41E-
51
443.4462 496.03
8
443.44
62
496.03
8
X Variable 1 -0.12819 0.2701
51
0.1043
74
0.01712
7
-0.50922 0.5656
13
-
0.5092
2
0.5656
13
Our model was severe malaria= 469.74 – 0.128t
From the table above it was observed that the coefficient of determination(R squared) is 72.1% which
meant that the model is a good fit and the probability value was 0.017 which is less than the critical 0.05
implying significance.
Table 9 regression analysis for total malaria cases
Regression Statistics
Multiple R 0.065907
R Square 0.824344
AdjustedR
Square
0.837798
StandardError 119.3451
Observations 84
53
ANOVA
df SS MS F Significan
ce F
Regression 1 5095.36
8
5095.36
8
0.35773
9
0.01413
Residual 82 116794
7
14243.2
5
Total 83 117304
2
Coefficien
ts
Standar
d Error
t Stat P-value Lower
95%
Upper
95%
Lower
95.0%
Upper
95.0%
Intercept 954.6277 26.2775
1
36.3286
9
2.56E-
52
902.3533 1006.90
2
902.353
3
1006.90
2
X Variable 1 -0.32121 0.53704 -
0.59811
0.04141
3
-1.38956 0.74713
4
-
1.38956
0.74713
4
Our model was severe malaria= 954.63 – 0.321t
From the table above it was observed that the coefficient of determination(R squared) is 82.4% which
meant that the model is a good fit and the probability value was 0.014 which is less than the critical 0.05
implying significance.
54
4.6 forecasting malaria cases by severity and total
Table 10 forecast for malaria cases
year Simple malaria cases Severe malaria cases Total malaria cases
January 2019 455.2 458.9 927.3
January 2020 451 457.3 923.5
January 2021 446.8 455.8 919.6
January 2022 442.6 454.3 915.8
January 2023 438.5 452.7 911.9
55
CHAPTER FIVE: SUMMARY, CONCLUSIONS AND RECOMMENDATIONS
5.0 Introduction
This chapter covers the summary, it further includes the conclusion based on the findings from the
study and presents the appropriate recommendations.
5.1 SUMMARY AND CONCLUSIONS
Findings from this research have highlighted a number of issues concerning malaria particularly
severe malaria and simple malaria.
5.1.1 Simple Malaria
It was found that simple malaria has been decreasing slightly over the past 7 years. Results show
that simple malaria occurrence is affected by seasonality. In Rwanda there are two seasons, dry
seasons that occur from June to mid September, then from December to February that record a
large number of malaria cases. The wet season starts from March to May, then from October to
November that records a slight decrease in malaria cases.
5.1.2 Severe Malaria
It was found that severe malaria has been decreasing slightly over the past 7 years. Results show
that simple malaria occurrence is affected by seasonality. In Rwanda there are two seasons, dry
seasons that occur from June to mid September, then from December to February that record a
56
large number of malaria cases. The wet season starts from March to May, then from October to
November that records a slight decrease in malaria cases.
5.1.3 Total Malaria
It was found that severe malaria has been decreasing slightly over the past 7 years. Results show
that simple malaria occurrence is affected by seasonality. In Rwanda there are two seasons, dry
seasons that occur from June to mid September, then from December to February that record a
large number of malaria cases. The wet season starts from March to May, then from October to
November that records a slight decrease in malaria cases.
5.2 RECOMMENDATIONS
The Government of Rwanda should be given credit for giving Malaria the attention it deserves,
However, a lot has to be done as regards this disease.
The following suggestions have been recommended according to the findings;
1. Many government policies have put much emphasis on treatment of Malaria by providing
medicine such as Coartem to mention but a few. However, preventive care should be
number one priority. People should be sensitized on the importance of mosquito nets,
indoor Residual Spraying .
2. Awareness on mosquito activity, factors that attract mosquitoes suchs as bushes and
swamps, the different seasons for mosquito activity should be provided through Education
and the media.
57
Table 11 DATA FROM RUBAVU DISTRICT HOSPITAL
t simple severe total
Jan-12 530 500 1030
Feb-12 500 426 926
Mar-
12 485 429 914
Apr-12 400 450 850
May-
12 450 495 945
Jun-12 540 554 1094
Jul-12 560 522 1082
Aug-
12 520 470 990
Sep-12 435 456 891
Oct-12 422 482 904
Nov-
12 367 464 831
Dec-12 389 437 826
Jan-13 416 473 889
Feb-13 381 420 801
58
Mar-
13 336 371 707
Apr-13 370 362 732
May-
13 445 393 838
Jun-13 458 420 878
Jul-13 537 522 1059
Aug-
13 488 450 938
Sep-13 425 370 795
Oct-13 451 400 851
Nov-
13 431 390 821
Dec-13 427 473 900
Jan-14 596 560 1156
Feb-14 538 470 1008
Mar-
14 516 458 974
Apr-14 490 520 1010
May-
14 523 539 1062
Jun-14 565 623 1188
Jul-14 524 472 996
Aug-
14 564 450 1014
Sep-14 441 502 943
Oct-14 519 462 981
Nov-
14 518 482 1000
Dec-14 424 449 873
Jan-15 472 448 920
59
Feb-15 434 378 812
Mar-
15 436 449 885
Apr-15 496 423 919
May-
15 541 455 996
Jun-15 560 554 1114
Jul-15 567 568 1135
Aug-
15 474 479 953
Sep-15 462 508 970
Oct-15 501 559 1060
Nov-
15 484 557 1041
Dec-15 461 535 996
Jan-16 448 472 920
Feb-16 378 434 812
Mar-
16 449 436 885
Apr-16 423 490 913
May-
16 455 430 885
Jun-16 564 560 1124
Jul-16 579 545 1124
Aug-
16 481 471 952
Sep-16 510 452 962
Oct-16 564 505 1069
Nov-
16 557 481 1038
60
Dec-16 535 456 991
Jan-17 564 596 1160
Feb-17 451 535 986
Mar-
17 468 508 976
Apr-17 527 479 1006
May-
17 549 521 1070
Jun-17 631 558 1189
Jul-17 487 531 1018
Aug-
17 460 567 1027
Sep-17 500 448 948
Oct-17 468 516 984
Nov-
17 482 513 995
Dec-17 313 400 713
Jan-18 420 432 852
Feb-18 371 362 733
Mar-
18 371 320 691
Apr-18 393 380 773
May-
18 455 430 885
Jun-18 545 510 1055
Jul-18 436 460 896
Aug-
18 353 415 768
Sep-18 396 440 836
Oct-18 390 425 815
61
Nov-
18 313 422 735
Dec-18 328 430 758
62
REFERENCES
assessing thesocial vulnerabilityto malaria in Rwanda.
Bizimana,J.-P.(2015).Assessingthe social vulnerabilitytomalaria.
Council,M.R. (2001).
ElvisAdam,A.M. (2017). time seriesanalysisof malariacasesinkasenaNankanamunicipality.
frameworkformalariaelimination.(2017).
guidelinesfortreatmentof malaria.(2015).
MOH. (n.d.).
National instituteof Statisticsof Rwanda.(2016, march).RwandaDemographicHealthsurvey.p.173.
(2018). PRESIDENT'SMALARIA INITIATIVEMalaria operationalplan. MOH.
SergioChicumbe,R.Z.(2019, january25). Communityknowledge andacceptance of indoorresidual
sprayiingformalariapreventioninMozambique.
Time seriesanalysisof MalariainKumasi usingARIMA modelstoforecastfuture inidence.(n.d.).
WHO. (n.d.).
WHO. (1997).
WHO. (2002).
WHO. (2003).
WHO. (2003).
WHO. (2014).
WIKIPEDIA.(2019).
63
worldmalariareport.(2018).
worlddmalariareport.(2017).

More Related Content

What's hot

Pandemic
Pandemic Pandemic
Pandemic
Leavitt Partners
 
gayzeras
gayzerasgayzeras
gayzeras
tassio jose
 
Controlling_Disease_Outbreaks-The_Changing_Role_of_Hospitals-PC
Controlling_Disease_Outbreaks-The_Changing_Role_of_Hospitals-PCControlling_Disease_Outbreaks-The_Changing_Role_of_Hospitals-PC
Controlling_Disease_Outbreaks-The_Changing_Role_of_Hospitals-PC
Dr. Raoul Nap, MD MSc PhD
 
Forecasting the peak and fading out of novel coronavirus of 2019
Forecasting the peak and fading out of novel coronavirus of 2019Forecasting the peak and fading out of novel coronavirus of 2019
Forecasting the peak and fading out of novel coronavirus of 2019
Islam Saeed
 
Bioinformatics in pandemic Script
Bioinformatics in pandemic ScriptBioinformatics in pandemic Script
Bioinformatics in pandemic Script
YOGESHHK
 
03 David Swayne (usa)
03 David Swayne (usa)03 David Swayne (usa)
03 David Swayne (usa)
Perez Eric
 
Report in phn
Report in phnReport in phn
Report in phn
Rosalie castro
 
Human-to-Human transmission of H7H7 in Holland 2003
Human-to-Human transmission of H7H7 in Holland 2003Human-to-Human transmission of H7H7 in Holland 2003
Human-to-Human transmission of H7H7 in Holland 2003
Harm Kiezebrink
 
Respiratory virus shedding in exhaled breath and efficacy of face masks
Respiratory virus shedding in exhaled breath and efficacy of face masksRespiratory virus shedding in exhaled breath and efficacy of face masks
Respiratory virus shedding in exhaled breath and efficacy of face masks
Valentina Corona
 
Swine Flu In US and Mexico
Swine Flu In US and MexicoSwine Flu In US and Mexico
Swine Flu In US and Mexico
Dr Neelesh Bhandari
 
AI transmission risks: Analysis of biosecurity measures and contact structure
AI transmission risks: Analysis of biosecurity measures and contact structureAI transmission risks: Analysis of biosecurity measures and contact structure
AI transmission risks: Analysis of biosecurity measures and contact structure
Harm Kiezebrink
 
Per contact probability of infection by Highly Pathogenic Avian Influenza
Per contact probability of infection by Highly Pathogenic Avian InfluenzaPer contact probability of infection by Highly Pathogenic Avian Influenza
Per contact probability of infection by Highly Pathogenic Avian Influenza
Harm Kiezebrink
 
Diseaese Eradication Past Present and Future
Diseaese Eradication Past Present and FutureDiseaese Eradication Past Present and Future
Diseaese Eradication Past Present and Future
Ehab Omrani
 
Introduction to epidemiology
Introduction to epidemiologyIntroduction to epidemiology
Introduction to epidemiology
Mohammad Ismail Zubair MD. MSc
 
Basic Concepts of PH
Basic Concepts of PHBasic Concepts of PH
Basic Concepts of PH
amitakashyap1
 
Wind mediated spread of LPAI
Wind mediated spread of LPAIWind mediated spread of LPAI
Wind mediated spread of LPAI
Harm Kiezebrink
 
Covid 19 ppt
Covid 19  pptCovid 19  ppt
Covid 19 ppt
TithiPurkait
 
s12936-015-0611-9
s12936-015-0611-9s12936-015-0611-9
s12936-015-0611-9
Elisabeth Baum
 
Different environmental drivers of H5N1 outbreaks in poultry and wild birds
Different environmental drivers of H5N1 outbreaks in poultry and wild birdsDifferent environmental drivers of H5N1 outbreaks in poultry and wild birds
Different environmental drivers of H5N1 outbreaks in poultry and wild birds
Harm Kiezebrink
 
Malaria Control Strategies among Rural Dwellers in a Typical Nigerian Setting
Malaria Control Strategies among Rural Dwellers in a Typical Nigerian SettingMalaria Control Strategies among Rural Dwellers in a Typical Nigerian Setting
Malaria Control Strategies among Rural Dwellers in a Typical Nigerian Setting
asclepiuspdfs
 

What's hot (20)

Pandemic
Pandemic Pandemic
Pandemic
 
gayzeras
gayzerasgayzeras
gayzeras
 
Controlling_Disease_Outbreaks-The_Changing_Role_of_Hospitals-PC
Controlling_Disease_Outbreaks-The_Changing_Role_of_Hospitals-PCControlling_Disease_Outbreaks-The_Changing_Role_of_Hospitals-PC
Controlling_Disease_Outbreaks-The_Changing_Role_of_Hospitals-PC
 
Forecasting the peak and fading out of novel coronavirus of 2019
Forecasting the peak and fading out of novel coronavirus of 2019Forecasting the peak and fading out of novel coronavirus of 2019
Forecasting the peak and fading out of novel coronavirus of 2019
 
Bioinformatics in pandemic Script
Bioinformatics in pandemic ScriptBioinformatics in pandemic Script
Bioinformatics in pandemic Script
 
03 David Swayne (usa)
03 David Swayne (usa)03 David Swayne (usa)
03 David Swayne (usa)
 
Report in phn
Report in phnReport in phn
Report in phn
 
Human-to-Human transmission of H7H7 in Holland 2003
Human-to-Human transmission of H7H7 in Holland 2003Human-to-Human transmission of H7H7 in Holland 2003
Human-to-Human transmission of H7H7 in Holland 2003
 
Respiratory virus shedding in exhaled breath and efficacy of face masks
Respiratory virus shedding in exhaled breath and efficacy of face masksRespiratory virus shedding in exhaled breath and efficacy of face masks
Respiratory virus shedding in exhaled breath and efficacy of face masks
 
Swine Flu In US and Mexico
Swine Flu In US and MexicoSwine Flu In US and Mexico
Swine Flu In US and Mexico
 
AI transmission risks: Analysis of biosecurity measures and contact structure
AI transmission risks: Analysis of biosecurity measures and contact structureAI transmission risks: Analysis of biosecurity measures and contact structure
AI transmission risks: Analysis of biosecurity measures and contact structure
 
Per contact probability of infection by Highly Pathogenic Avian Influenza
Per contact probability of infection by Highly Pathogenic Avian InfluenzaPer contact probability of infection by Highly Pathogenic Avian Influenza
Per contact probability of infection by Highly Pathogenic Avian Influenza
 
Diseaese Eradication Past Present and Future
Diseaese Eradication Past Present and FutureDiseaese Eradication Past Present and Future
Diseaese Eradication Past Present and Future
 
Introduction to epidemiology
Introduction to epidemiologyIntroduction to epidemiology
Introduction to epidemiology
 
Basic Concepts of PH
Basic Concepts of PHBasic Concepts of PH
Basic Concepts of PH
 
Wind mediated spread of LPAI
Wind mediated spread of LPAIWind mediated spread of LPAI
Wind mediated spread of LPAI
 
Covid 19 ppt
Covid 19  pptCovid 19  ppt
Covid 19 ppt
 
s12936-015-0611-9
s12936-015-0611-9s12936-015-0611-9
s12936-015-0611-9
 
Different environmental drivers of H5N1 outbreaks in poultry and wild birds
Different environmental drivers of H5N1 outbreaks in poultry and wild birdsDifferent environmental drivers of H5N1 outbreaks in poultry and wild birds
Different environmental drivers of H5N1 outbreaks in poultry and wild birds
 
Malaria Control Strategies among Rural Dwellers in a Typical Nigerian Setting
Malaria Control Strategies among Rural Dwellers in a Typical Nigerian SettingMalaria Control Strategies among Rural Dwellers in a Typical Nigerian Setting
Malaria Control Strategies among Rural Dwellers in a Typical Nigerian Setting
 

Similar to Dissertation final

Research papers -Elephantiasis
Research papers -ElephantiasisResearch papers -Elephantiasis
Research papers -Elephantiasis
Juliet Bulemela
 
Malaria In Nepal
Malaria In Nepal Malaria In Nepal
Malaria In Nepal
Anish Luitel
 
Epidemiology of Malaria & Dengue_Sagar Parajuli.pptx
Epidemiology of Malaria & Dengue_Sagar Parajuli.pptxEpidemiology of Malaria & Dengue_Sagar Parajuli.pptx
Epidemiology of Malaria & Dengue_Sagar Parajuli.pptx
SagarParajuli9
 
National Vector Borne Disease Control Program.pptx
National Vector Borne Disease Control Program.pptxNational Vector Borne Disease Control Program.pptx
National Vector Borne Disease Control Program.pptx
DR.SUMIT SABLE
 
Prevalence of Malaria Parasites Amongst Pregnant Women in Calabar Cross River...
Prevalence of Malaria Parasites Amongst Pregnant Women in Calabar Cross River...Prevalence of Malaria Parasites Amongst Pregnant Women in Calabar Cross River...
Prevalence of Malaria Parasites Amongst Pregnant Women in Calabar Cross River...
Healthcare and Medical Sciences
 
Prevalence and Predictors of Malaria Among HIV Infected Subjects Attending an...
Prevalence and Predictors of Malaria Among HIV Infected Subjects Attending an...Prevalence and Predictors of Malaria Among HIV Infected Subjects Attending an...
Prevalence and Predictors of Malaria Among HIV Infected Subjects Attending an...
Healthcare and Medical Sciences
 
4-11-11-768.pdf
4-11-11-768.pdf4-11-11-768.pdf
4-11-11-768.pdf
wibowo36
 
Abstracts Of The 20Th College Of Medicine Research Dissemination Conference
Abstracts Of The 20Th College Of Medicine Research Dissemination ConferenceAbstracts Of The 20Th College Of Medicine Research Dissemination Conference
Abstracts Of The 20Th College Of Medicine Research Dissemination Conference
Allison Thompson
 
Statistical analysis on household factors influencing annual episodes of malaria
Statistical analysis on household factors influencing annual episodes of malariaStatistical analysis on household factors influencing annual episodes of malaria
Statistical analysis on household factors influencing annual episodes of malaria
cimran15
 
BOAKYE GYAN (MEEK MILL)
BOAKYE GYAN (MEEK MILL)BOAKYE GYAN (MEEK MILL)
BOAKYE GYAN (MEEK MILL)
GyanBoakye
 
Epidemiological Perspective of Malaria_Sagar Parajuli.pptx
Epidemiological Perspective of Malaria_Sagar Parajuli.pptxEpidemiological Perspective of Malaria_Sagar Parajuli.pptx
Epidemiological Perspective of Malaria_Sagar Parajuli.pptx
SagarParajuli9
 
MALARIA DAY - 25- APRIL- 2022.pptx
MALARIA DAY - 25- APRIL- 2022.pptxMALARIA DAY - 25- APRIL- 2022.pptx
MALARIA DAY - 25- APRIL- 2022.pptx
AbhishekSamuel14
 
Malaria
MalariaMalaria
Dr Ogunsina Malaria Management.ppt
Dr Ogunsina Malaria Management.pptDr Ogunsina Malaria Management.ppt
Dr Ogunsina Malaria Management.ppt
Ogunsina1
 
Malaria
MalariaMalaria
Malaria
Mohammed Sami
 
GEOGRAPHY NCEA LEVEL 2: MALARIA - SPATIAL PATTERNS
GEOGRAPHY NCEA LEVEL 2: MALARIA - SPATIAL PATTERNSGEOGRAPHY NCEA LEVEL 2: MALARIA - SPATIAL PATTERNS
GEOGRAPHY NCEA LEVEL 2: MALARIA - SPATIAL PATTERNS
George Dumitrache
 
Knowledge of the Implementation of the Malaria Control Program in Four Health...
Knowledge of the Implementation of the Malaria Control Program in Four Health...Knowledge of the Implementation of the Malaria Control Program in Four Health...
Knowledge of the Implementation of the Malaria Control Program in Four Health...
YogeshIJTSRD
 
Malaria by Dr Sanaa Ibnouf
Malaria by Dr Sanaa IbnoufMalaria by Dr Sanaa Ibnouf
Malaria by Dr Sanaa Ibnouf
Dr Ghaiath Hussein
 
Evaluation of factors that influence Reoccurrence of Cholera epidemics in Bwe...
Evaluation of factors that influence Reoccurrence of Cholera epidemics in Bwe...Evaluation of factors that influence Reoccurrence of Cholera epidemics in Bwe...
Evaluation of factors that influence Reoccurrence of Cholera epidemics in Bwe...
PUBLISHERJOURNAL
 
National Vector Borne Disease Control Programme
National Vector Borne Disease Control ProgrammeNational Vector Borne Disease Control Programme
National Vector Borne Disease Control Programme
DrAnup Kumar
 

Similar to Dissertation final (20)

Research papers -Elephantiasis
Research papers -ElephantiasisResearch papers -Elephantiasis
Research papers -Elephantiasis
 
Malaria In Nepal
Malaria In Nepal Malaria In Nepal
Malaria In Nepal
 
Epidemiology of Malaria & Dengue_Sagar Parajuli.pptx
Epidemiology of Malaria & Dengue_Sagar Parajuli.pptxEpidemiology of Malaria & Dengue_Sagar Parajuli.pptx
Epidemiology of Malaria & Dengue_Sagar Parajuli.pptx
 
National Vector Borne Disease Control Program.pptx
National Vector Borne Disease Control Program.pptxNational Vector Borne Disease Control Program.pptx
National Vector Borne Disease Control Program.pptx
 
Prevalence of Malaria Parasites Amongst Pregnant Women in Calabar Cross River...
Prevalence of Malaria Parasites Amongst Pregnant Women in Calabar Cross River...Prevalence of Malaria Parasites Amongst Pregnant Women in Calabar Cross River...
Prevalence of Malaria Parasites Amongst Pregnant Women in Calabar Cross River...
 
Prevalence and Predictors of Malaria Among HIV Infected Subjects Attending an...
Prevalence and Predictors of Malaria Among HIV Infected Subjects Attending an...Prevalence and Predictors of Malaria Among HIV Infected Subjects Attending an...
Prevalence and Predictors of Malaria Among HIV Infected Subjects Attending an...
 
4-11-11-768.pdf
4-11-11-768.pdf4-11-11-768.pdf
4-11-11-768.pdf
 
Abstracts Of The 20Th College Of Medicine Research Dissemination Conference
Abstracts Of The 20Th College Of Medicine Research Dissemination ConferenceAbstracts Of The 20Th College Of Medicine Research Dissemination Conference
Abstracts Of The 20Th College Of Medicine Research Dissemination Conference
 
Statistical analysis on household factors influencing annual episodes of malaria
Statistical analysis on household factors influencing annual episodes of malariaStatistical analysis on household factors influencing annual episodes of malaria
Statistical analysis on household factors influencing annual episodes of malaria
 
BOAKYE GYAN (MEEK MILL)
BOAKYE GYAN (MEEK MILL)BOAKYE GYAN (MEEK MILL)
BOAKYE GYAN (MEEK MILL)
 
Epidemiological Perspective of Malaria_Sagar Parajuli.pptx
Epidemiological Perspective of Malaria_Sagar Parajuli.pptxEpidemiological Perspective of Malaria_Sagar Parajuli.pptx
Epidemiological Perspective of Malaria_Sagar Parajuli.pptx
 
MALARIA DAY - 25- APRIL- 2022.pptx
MALARIA DAY - 25- APRIL- 2022.pptxMALARIA DAY - 25- APRIL- 2022.pptx
MALARIA DAY - 25- APRIL- 2022.pptx
 
Malaria
MalariaMalaria
Malaria
 
Dr Ogunsina Malaria Management.ppt
Dr Ogunsina Malaria Management.pptDr Ogunsina Malaria Management.ppt
Dr Ogunsina Malaria Management.ppt
 
Malaria
MalariaMalaria
Malaria
 
GEOGRAPHY NCEA LEVEL 2: MALARIA - SPATIAL PATTERNS
GEOGRAPHY NCEA LEVEL 2: MALARIA - SPATIAL PATTERNSGEOGRAPHY NCEA LEVEL 2: MALARIA - SPATIAL PATTERNS
GEOGRAPHY NCEA LEVEL 2: MALARIA - SPATIAL PATTERNS
 
Knowledge of the Implementation of the Malaria Control Program in Four Health...
Knowledge of the Implementation of the Malaria Control Program in Four Health...Knowledge of the Implementation of the Malaria Control Program in Four Health...
Knowledge of the Implementation of the Malaria Control Program in Four Health...
 
Malaria by Dr Sanaa Ibnouf
Malaria by Dr Sanaa IbnoufMalaria by Dr Sanaa Ibnouf
Malaria by Dr Sanaa Ibnouf
 
Evaluation of factors that influence Reoccurrence of Cholera epidemics in Bwe...
Evaluation of factors that influence Reoccurrence of Cholera epidemics in Bwe...Evaluation of factors that influence Reoccurrence of Cholera epidemics in Bwe...
Evaluation of factors that influence Reoccurrence of Cholera epidemics in Bwe...
 
National Vector Borne Disease Control Programme
National Vector Borne Disease Control ProgrammeNational Vector Borne Disease Control Programme
National Vector Borne Disease Control Programme
 

Recently uploaded

Experts live - Improving user adoption with AI
Experts live - Improving user adoption with AIExperts live - Improving user adoption with AI
Experts live - Improving user adoption with AI
jitskeb
 
DSSML24_tspann_CodelessGenerativeAIPipelines
DSSML24_tspann_CodelessGenerativeAIPipelinesDSSML24_tspann_CodelessGenerativeAIPipelines
DSSML24_tspann_CodelessGenerativeAIPipelines
Timothy Spann
 
Intelligence supported media monitoring in veterinary medicine
Intelligence supported media monitoring in veterinary medicineIntelligence supported media monitoring in veterinary medicine
Intelligence supported media monitoring in veterinary medicine
AndrzejJarynowski
 
Everything you wanted to know about LIHTC
Everything you wanted to know about LIHTCEverything you wanted to know about LIHTC
Everything you wanted to know about LIHTC
Roger Valdez
 
06-12-2024-BudapestDataForum-BuildingReal-timePipelineswithFLaNK AIM
06-12-2024-BudapestDataForum-BuildingReal-timePipelineswithFLaNK AIM06-12-2024-BudapestDataForum-BuildingReal-timePipelineswithFLaNK AIM
06-12-2024-BudapestDataForum-BuildingReal-timePipelineswithFLaNK AIM
Timothy Spann
 
一比一原版(牛布毕业证书)牛津布鲁克斯大学毕业证如何办理
一比一原版(牛布毕业证书)牛津布鲁克斯大学毕业证如何办理一比一原版(牛布毕业证书)牛津布鲁克斯大学毕业证如何办理
一比一原版(牛布毕业证书)牛津布鲁克斯大学毕业证如何办理
74nqk8xf
 
4th Modern Marketing Reckoner by MMA Global India & Group M: 60+ experts on W...
4th Modern Marketing Reckoner by MMA Global India & Group M: 60+ experts on W...4th Modern Marketing Reckoner by MMA Global India & Group M: 60+ experts on W...
4th Modern Marketing Reckoner by MMA Global India & Group M: 60+ experts on W...
Social Samosa
 
My burning issue is homelessness K.C.M.O.
My burning issue is homelessness K.C.M.O.My burning issue is homelessness K.C.M.O.
My burning issue is homelessness K.C.M.O.
rwarrenll
 
06-04-2024 - NYC Tech Week - Discussion on Vector Databases, Unstructured Dat...
06-04-2024 - NYC Tech Week - Discussion on Vector Databases, Unstructured Dat...06-04-2024 - NYC Tech Week - Discussion on Vector Databases, Unstructured Dat...
06-04-2024 - NYC Tech Week - Discussion on Vector Databases, Unstructured Dat...
Timothy Spann
 
办(uts毕业证书)悉尼科技大学毕业证学历证书原版一模一样
办(uts毕业证书)悉尼科技大学毕业证学历证书原版一模一样办(uts毕业证书)悉尼科技大学毕业证学历证书原版一模一样
办(uts毕业证书)悉尼科技大学毕业证学历证书原版一模一样
apvysm8
 
一比一原版(UCSB文凭证书)圣芭芭拉分校毕业证如何办理
一比一原版(UCSB文凭证书)圣芭芭拉分校毕业证如何办理一比一原版(UCSB文凭证书)圣芭芭拉分校毕业证如何办理
一比一原版(UCSB文凭证书)圣芭芭拉分校毕业证如何办理
nuttdpt
 
The Ipsos - AI - Monitor 2024 Report.pdf
The  Ipsos - AI - Monitor 2024 Report.pdfThe  Ipsos - AI - Monitor 2024 Report.pdf
The Ipsos - AI - Monitor 2024 Report.pdf
Social Samosa
 
End-to-end pipeline agility - Berlin Buzzwords 2024
End-to-end pipeline agility - Berlin Buzzwords 2024End-to-end pipeline agility - Berlin Buzzwords 2024
End-to-end pipeline agility - Berlin Buzzwords 2024
Lars Albertsson
 
Udemy_2024_Global_Learning_Skills_Trends_Report (1).pdf
Udemy_2024_Global_Learning_Skills_Trends_Report (1).pdfUdemy_2024_Global_Learning_Skills_Trends_Report (1).pdf
Udemy_2024_Global_Learning_Skills_Trends_Report (1).pdf
Fernanda Palhano
 
一比一原版(UCSF文凭证书)旧金山分校毕业证如何办理
一比一原版(UCSF文凭证书)旧金山分校毕业证如何办理一比一原版(UCSF文凭证书)旧金山分校毕业证如何办理
一比一原版(UCSF文凭证书)旧金山分校毕业证如何办理
nuttdpt
 
Challenges of Nation Building-1.pptx with more important
Challenges of Nation Building-1.pptx with more importantChallenges of Nation Building-1.pptx with more important
Challenges of Nation Building-1.pptx with more important
Sm321
 
一比一原版(Harvard毕业证书)哈佛大学毕业证如何办理
一比一原版(Harvard毕业证书)哈佛大学毕业证如何办理一比一原版(Harvard毕业证书)哈佛大学毕业证如何办理
一比一原版(Harvard毕业证书)哈佛大学毕业证如何办理
zsjl4mimo
 
Global Situational Awareness of A.I. and where its headed
Global Situational Awareness of A.I. and where its headedGlobal Situational Awareness of A.I. and where its headed
Global Situational Awareness of A.I. and where its headed
vikram sood
 
一比一原版(Chester毕业证书)切斯特大学毕业证如何办理
一比一原版(Chester毕业证书)切斯特大学毕业证如何办理一比一原版(Chester毕业证书)切斯特大学毕业证如何办理
一比一原版(Chester毕业证书)切斯特大学毕业证如何办理
74nqk8xf
 
一比一原版(GWU,GW文凭证书)乔治·华盛顿大学毕业证如何办理
一比一原版(GWU,GW文凭证书)乔治·华盛顿大学毕业证如何办理一比一原版(GWU,GW文凭证书)乔治·华盛顿大学毕业证如何办理
一比一原版(GWU,GW文凭证书)乔治·华盛顿大学毕业证如何办理
bopyb
 

Recently uploaded (20)

Experts live - Improving user adoption with AI
Experts live - Improving user adoption with AIExperts live - Improving user adoption with AI
Experts live - Improving user adoption with AI
 
DSSML24_tspann_CodelessGenerativeAIPipelines
DSSML24_tspann_CodelessGenerativeAIPipelinesDSSML24_tspann_CodelessGenerativeAIPipelines
DSSML24_tspann_CodelessGenerativeAIPipelines
 
Intelligence supported media monitoring in veterinary medicine
Intelligence supported media monitoring in veterinary medicineIntelligence supported media monitoring in veterinary medicine
Intelligence supported media monitoring in veterinary medicine
 
Everything you wanted to know about LIHTC
Everything you wanted to know about LIHTCEverything you wanted to know about LIHTC
Everything you wanted to know about LIHTC
 
06-12-2024-BudapestDataForum-BuildingReal-timePipelineswithFLaNK AIM
06-12-2024-BudapestDataForum-BuildingReal-timePipelineswithFLaNK AIM06-12-2024-BudapestDataForum-BuildingReal-timePipelineswithFLaNK AIM
06-12-2024-BudapestDataForum-BuildingReal-timePipelineswithFLaNK AIM
 
一比一原版(牛布毕业证书)牛津布鲁克斯大学毕业证如何办理
一比一原版(牛布毕业证书)牛津布鲁克斯大学毕业证如何办理一比一原版(牛布毕业证书)牛津布鲁克斯大学毕业证如何办理
一比一原版(牛布毕业证书)牛津布鲁克斯大学毕业证如何办理
 
4th Modern Marketing Reckoner by MMA Global India & Group M: 60+ experts on W...
4th Modern Marketing Reckoner by MMA Global India & Group M: 60+ experts on W...4th Modern Marketing Reckoner by MMA Global India & Group M: 60+ experts on W...
4th Modern Marketing Reckoner by MMA Global India & Group M: 60+ experts on W...
 
My burning issue is homelessness K.C.M.O.
My burning issue is homelessness K.C.M.O.My burning issue is homelessness K.C.M.O.
My burning issue is homelessness K.C.M.O.
 
06-04-2024 - NYC Tech Week - Discussion on Vector Databases, Unstructured Dat...
06-04-2024 - NYC Tech Week - Discussion on Vector Databases, Unstructured Dat...06-04-2024 - NYC Tech Week - Discussion on Vector Databases, Unstructured Dat...
06-04-2024 - NYC Tech Week - Discussion on Vector Databases, Unstructured Dat...
 
办(uts毕业证书)悉尼科技大学毕业证学历证书原版一模一样
办(uts毕业证书)悉尼科技大学毕业证学历证书原版一模一样办(uts毕业证书)悉尼科技大学毕业证学历证书原版一模一样
办(uts毕业证书)悉尼科技大学毕业证学历证书原版一模一样
 
一比一原版(UCSB文凭证书)圣芭芭拉分校毕业证如何办理
一比一原版(UCSB文凭证书)圣芭芭拉分校毕业证如何办理一比一原版(UCSB文凭证书)圣芭芭拉分校毕业证如何办理
一比一原版(UCSB文凭证书)圣芭芭拉分校毕业证如何办理
 
The Ipsos - AI - Monitor 2024 Report.pdf
The  Ipsos - AI - Monitor 2024 Report.pdfThe  Ipsos - AI - Monitor 2024 Report.pdf
The Ipsos - AI - Monitor 2024 Report.pdf
 
End-to-end pipeline agility - Berlin Buzzwords 2024
End-to-end pipeline agility - Berlin Buzzwords 2024End-to-end pipeline agility - Berlin Buzzwords 2024
End-to-end pipeline agility - Berlin Buzzwords 2024
 
Udemy_2024_Global_Learning_Skills_Trends_Report (1).pdf
Udemy_2024_Global_Learning_Skills_Trends_Report (1).pdfUdemy_2024_Global_Learning_Skills_Trends_Report (1).pdf
Udemy_2024_Global_Learning_Skills_Trends_Report (1).pdf
 
一比一原版(UCSF文凭证书)旧金山分校毕业证如何办理
一比一原版(UCSF文凭证书)旧金山分校毕业证如何办理一比一原版(UCSF文凭证书)旧金山分校毕业证如何办理
一比一原版(UCSF文凭证书)旧金山分校毕业证如何办理
 
Challenges of Nation Building-1.pptx with more important
Challenges of Nation Building-1.pptx with more importantChallenges of Nation Building-1.pptx with more important
Challenges of Nation Building-1.pptx with more important
 
一比一原版(Harvard毕业证书)哈佛大学毕业证如何办理
一比一原版(Harvard毕业证书)哈佛大学毕业证如何办理一比一原版(Harvard毕业证书)哈佛大学毕业证如何办理
一比一原版(Harvard毕业证书)哈佛大学毕业证如何办理
 
Global Situational Awareness of A.I. and where its headed
Global Situational Awareness of A.I. and where its headedGlobal Situational Awareness of A.I. and where its headed
Global Situational Awareness of A.I. and where its headed
 
一比一原版(Chester毕业证书)切斯特大学毕业证如何办理
一比一原版(Chester毕业证书)切斯特大学毕业证如何办理一比一原版(Chester毕业证书)切斯特大学毕业证如何办理
一比一原版(Chester毕业证书)切斯特大学毕业证如何办理
 
一比一原版(GWU,GW文凭证书)乔治·华盛顿大学毕业证如何办理
一比一原版(GWU,GW文凭证书)乔治·华盛顿大学毕业证如何办理一比一原版(GWU,GW文凭证书)乔治·华盛顿大学毕业证如何办理
一比一原版(GWU,GW文凭证书)乔治·华盛顿大学毕业证如何办理
 

Dissertation final

  • 1. MAKERERE UNIVERSITY COLLEGE OF BUSINESS AND MANAGEMENT SCIENCES SCHOOL OF STATISTICS AND PLANNING TIME SERIES ANALYSIS OF MALARIA CASES IN RWANDA FOR THE PERIOD 2012-2018: A CASE STUDY OF RUBAVU HOSPITAL BY MUDAHERANWA AUGUSTINE KING 16/X/2336/EVE A DISSERTATION SUBMITTED TO THE SCHOOL OF STATISTICS AND PLANNING IN PARTIAL FULFILMENT OF THE REQUIREMENTS FOR THE AWARD OF DEGREE OF BACHELOR OF SCIENCE IN QUANTITATIVE ECONOMICS OF MAKERERE UNIVERSITY KAMPALA AUGUST 2019
  • 2. 2 DECLARATION I, MUDAHERANWA AUGUSTIN KING, declare that this work is original and has never been presented to any institution of higher learning or organization by any person for the award of any qualification. Signature …………………. Date …./…./…… MUDAHERANWA AUGUSTIN KING Student
  • 3. 3 APPROVAL This dissertation of MUDAHERANWA AUGUSTIN KING has been approved as partial fulfillment of the requirements for the award of the degree of Bachelor of Science in Quantitative Economics of Makerere University. Signature …………………………. Date ………………………………. James Wokadala, PhD School of Statistics and Planning
  • 4. 4 DEDICATION I dedicate this piece of work to my mother Uwera and my cousin late Kayitare in his memory.
  • 5. 5 ACKNOWLEDGMENT My Lord and God! You are worthy to be glorified and honored, for you created all things. Had it not been for your grace, this report would not be a success. Boundless thanks to many who in one way or the other assisted in the preparation of this report. First and foremost, to my family for the encouragement, support and cheerleading. Many thanks to my supervisor James Wokadala Ph.D. the Dean at the School of Statistics and Planning. His tireless and selfless dedication of time since the beginning of this research to its completion. My whole brain could function at its best because I was always challenged by his questions. Had it not been his constructive criticisms, comments, and corrections, this research would have been impossible. In a special way, I am really grateful to Rubavu district hospital especially the director of the Hospital Lt.Col. Kanyankore William who helped me get all the data I needed for this research project. I highly believe that this research will be of help to the hospital. Finally, I want to thank everyone who has been with me for this undergraduate course, directly or indirectly. I must say, am humbled for having met you. ABSTRACT
  • 6. 6 The main objective of the study was to establish the time-series properties of malaria cases in Rwanda. In this study, secondary data was collected from the hospital’s data records on malaria cases with respect to year and severity. The data collected was thereafter entered, analysed using Ms Excel and STATA. Tests of hypotheses using the Dickey-Fuller test at 95% confidence level were done to determine whether there was a trend in malaria incidence. An ARIMA model was then fitted in order to provide a more reliable forecast. The results from the study revealed that malaria cases are highly affected by seasons. In Rwanda, there are two seasons, dry seasons that occur from June to mid-September, then from December to February that record a large number of malaria cases. The wet season starts from March to May, then from October to November that records a slight decrease in malaria cases. It was also found out that malaria incidence was estimated to be decreasing in the future though at a slow rate. Arising from the study, two recommendations were proposed; First, preventive care should be a priority. People should be sensitized on the importance of mosquito nets, indoor Residual Spraying. Second, awareness of mosquito activity, factors that attract mosquitoes such as bushes and swamps, the different seasons for mosquito activity should be provided through education and media.
  • 7. 7 LIST OF ABBREVIATIONS DDT Dichlorodiphenyltrichloroethane IPTP Intermittent Preventive Treatment of Pregnant women IRS Indoor Residual Spraying ITNs Insecticide-Treated mosquito Nets MOH Ministry Of Health PMI President’s Malaria Initiative WHO World Health Organization
  • 8. 8 TABLE OF CONTENTS LIST OF TABLES viii CHAPTER ONE: INTRODUCTION 1 1.1 14 1.2 Error! Bookmark not defined. 1.3 16 1.5 16 1.6 16 CHAPTER TWO: LITERATURE REVIEW 5 2.1 INTRODUCTION 5 2.2 DEFINITION AND FACTS ABOUT MALARIA 5 CHAPTER THREE: METHODOLOGY 11 3.1 Data collection procedure 11 3.3Data editing 11 3.4Data analysis 11 3.5.1.Univariate analysis 11 3.5.2.Time Series analysis 11 CHAPTER FOUR: PRESENTATION, ANALYSIS, AND INTERPRETATION OF FINDINGS 14 4.0 Introduction 14 4.1 Hypothesis testing 14 4.1.1 Research Hypothesis One 14 Time series plot of simple Malaria cases 15 4.1.2 Research Hypothesis Two 16 Time series plot for Severe Malaria cases 17
  • 9. 9 4.1.3 Research Hypothesis Three 18 Time series plot for total malaria cases 20 Correlogram for simple malaria cases 21 Partial correlogram for simple malaria cases 22 4.2 Arima model for Simple Malaria cases 23 Correlogram for severe malaria cases 24 Partial correlogram for severe malaria cases 25 4.3 Arima model for Severe Malaria cases 26 Correlogram for total malaria cases 27 Partial correlogram for total malaria cases 28 CHAPTER FIVE: SUMMARY, CONCLUSIONS, AND RECOMMENDATIONS 30 5.0 Introduction 30 5.1 SUMMARY AND CONCLUSIONS 30 5.1.1 Simple Malaria 30 5.1.2 Severe Malaria 30 5.1.3 Total Malaria 30 5.2 RECOMMENDATIONS 31 REFERENCES 35
  • 10. 10
  • 11. 11 LIST OF FIGURES Figure 1 Timeseries plot for simple malaria cases 18 Figure 2 Timeseries plot for severe malaria cases 20 Figure 3 Time series plot for total malaria cases Error! Bookmark not defined. Figure 4 Correlogram for simple malaria cases 23 Figure 5 Partial correlogram for simple malaria cases 24 Figure 6 25 Figure 7 Correlogram for severe malaria cases 26 Figure 8 Partial correlogram for severe malaria cases 27 Figure 9 28 Figure 10 Correlogram for total malaria cases 29 Figure 11 Partial correlogram for total malaria cases 30 Figure 12 31 Figure 13 Cumulative Periodogram white-noise test for simple malaria cases 32 Figure 14 Cumulative Periodogram White-Noise test for severe malaria cases 33 Figure 15 Cumulative Periodogram white-noise test for total malaria cases 34
  • 12. 12 LIST OF TABLES Table 1 Dickey fuller test for simple malaria cases 17 Table 2 Dickey fuller test for severe malaria cases 19 Table 3 Dickey fuller test for total malaria cases 21 Table 4 White noise test output for normality of residual simple malaria cases 32 Table 5 White noise test output for normality of severe malaria cases 33 Table 6 White noise test output for normality of total malaria cases 33 Table 7 regression analysis for simple malaria cases 34 Table 8 regression analysis for severe malaria cases 35 Table 9 regression analysis for total malaria cases 36 Table 10 forecast for malaria cases 37 Table 11 DATA FROM RUBAVU DISTRICT HOSPITAL 39
  • 13. 13
  • 14. 14 CHAPTER ONE: INTRODUCTION 1.1 BACKGROUND TO THE STUDY The history of malaria stretches from its prehistoric origin as a zoonotic disease in the primates of Africa through to the 21st century. A widespread and potentially lethal human infectious disease, at its peak malaria infested every continent, except Antarctica. Its prevention and treatment have been targeted in science and medicine for hundreds of years. Since the discovery of the parasites which cause it, research attention has focused on their biology, as well as that of the mosquitoes which transmit the parasites. References to its unique, periodic fevers are found throughout recorded history beginning in the first millennium BCE in Greece and China. (WIKIPEDIA, 2019) For thousands of years, traditional herbal remedies have been used to treat malaria. The first effective treatment for malaria came from the bark of the cinchona tree, which contains quinine. After the link to mosquitoes and their parasites were identified in the early twentieth century, mosquito control measures such as widespread use of the insecticide DDT, swamp drainage, covering or oiling surface of open water sources, indoor residual spraying and use of insecticide- treated nets was initiated (WIKIPEDIA, 2019). Malaria researchers have won multiple noble prizes for their achievements, although the disease continues to afflict some 200 million patients each year, killing more than 600,000. Malaria is caused by Plasmodium parasites. The parasites are spread to people through the bites of infected female Anopheles mosquitoes, called "malaria vectors." There are 5 parasite species that cause malaria in humans, and 2 of these species – P. falciparum and P. vivax – pose the greatest threat (WIKIPEDIA, 2019). ● In 2017, P. falciparum accounted for 99.7% of estimated malaria cases in the WHO African Region, as well as in the majority of cases in the WHO regions of South-East Asia (62.8%), the Eastern Mediterranean (69%) and the Western Pacific (71.9%). ● P. vivax is the predominant parasite in the WHO Region of the Americas, representing 74.1% of malaria cases.
  • 15. 15 Malaria is an acute febrile illness. In a non-immune individual, symptoms usually appear 10–15 days after the infective mosquito bite. The first symptoms – fever, headache, and chills – may be mild and difficult to recognize as malaria. If not treated within 24 hours, P. falciparum malaria can progress to severe illness, often leading to death. 1.2 PROBLEM STATEMENT Since 2004 malaria interventions in Rwanda have resulted in a substantial decline in malaria incidence. However, this achievement is fragile as potentials for local malaria transmissions remain. The risk of getting malaria infection is partially explained by the social conditions of vulnerable populations (Bizimana, 2015) Vector control is the main way to prevent and reduce malaria transmission. If coverage of vector control interventions within a specific area is high enough, then a measure of protection will be conferred across the community. Transmission also depends on climatic conditions that may affect the number and survival of mosquitoes, such as rainfall patterns, temperature, and humidity. In many places, transmission is seasonal, with the peak during and just after the rainy season. Malaria epidemics can occur when climate and other conditions suddenly favor transmission in areas where people have little or no immunity to malaria. They can also occur when people with low immunity move into areas with intense malaria transmission, for instance to find work, or as refugees (WHO, 2002). Human immunity is another important factor, especially among adults in areas of moderate or intense transmission conditions. Partial immunity is developed over years of exposure, and while it never provides complete protection, it does reduce the risk that malaria infection will cause severe disease. For this reason, most malaria deaths in Africa occur in young children, whereas in areas with less transmission and low immunity, all age groups are at risk. Efforts have been made to reduce on the malaria incidence such as the PRESIDENT’S MALARIA INITIATIVE (PMI) which was launched in 2005 and implementation as a PMI focus country in 2007. More details will be available in the literature review.
  • 16. 16 despite all these efforts to intervene, no study has been conducted to address the problem of time series modeling which will can help the government and other concerned parties to make the necessary planning as far as malaria is concerned, which is the purpose of this study. 1.2 OBJECTIVES Main Objective ● The main objective of the study is to conduct a time series analysis of MALARIA cases in Rwanda. Specific objectives ● To establish the time-series properties of malaria cases ● To estimate the ARIMA model of the malaria cases ● To fit trends and forecast the malaria cases in RUBAVU hospital. 1.3 HYPOTHESES ● The occurrence of simple malaria is trended. ● The occurrence of severe malaria is trended. ● The occurrence of total malaria is trended. 1.4 SCOPE AND COVERAGE OF THE STUDY The study will cover simple and severe malaria cases that were registered in Gisenyi hospital for the period of January 2012 to December 2018. The study will go beyond descriptive analysis to a time series analysis of annual registration of malaria cases by type of malaria. 1.5 SIGNIFICANCE OF THE STUDY The study is relevant to the Government and Medical society at large who will use this model predictions to know how they can plan for the treatment, control and prevention of the
  • 17. 17 disease and how much money the Government and its development partners will spend in the future.
  • 18. 18 CHAPTER TWO: LITERATURE REVIEW 2.1 INTRODUCTION This chapter consists of previous interventions and research that was done related to the study. Most literature presented here concentrates on the epidemiology of malaria and its control measures. 2.2 DEFINITION AND FACTS ABOUT MALARIA Malaria also known as plasmodium infection is a disease caused by a plasmodium parasite transmitted by the bite of infected female anopheles mosquitoes. According to the World Health Organization (WHO), most malaria cases and deaths occur in sub-Saharan Africa. In Rwanda approximately 90% of Rwandans are at risk of malaria. Malaria is the leading cause of morbidity(condition of being diseased) and mortality in Rwanda according to WHO. In 2005 Rwanda reported 991,612 malaria cases (WHO, 2003) According to ministry of health (MOH), malaria cases in Rwanda rose at 68.6% in 2014 against 947,689 cases in 2013. The MOH attributed this increase in the number of malaria cases to poor quality of mosquito nets. According to the malaria operational plan financial year 2018, when the PMI was launched in 2005, the goal was to reduce malaria- related mortality by 50% across 15 high burden countries in sub-Saharan Africa through a rapid scale up of four proven and highly effective malaria prevention and treatment measures: ● Insecticide-treated mosquito nets(ITNs) ● Indoor residual spraying(IRS) ● Accurate diagnosis and prompt treatment with artemisinin-based combination therapies and Intermittent preventive treatment of pregnant women(IPTp)
  • 19. 19 So far 81% of households have at least one ITN (National Institute of Statistics of Rwanda, 2016). 73 percent of pregnant women age 15 to 49 slept under any net the night before the survey. (National Institute of Statistics of Rwanda, 2016) A study that was done in Mozambique showed that the majority of respondents perceived the effectiveness of the IRS as limited, a large proportion accepted the intervention to combat malaria due to diverse motivations. The findings suggest that trusted community leaders and spray mobilizers communicate with households that IRS kills the mosquitoes that cause malaria. (Sergio Chicumbe, 2019) Malaria is both curable and preventable with medication; however, a vaccine is not available. According to WHO, in 2012, there were approximately 207 million cases of malaria resulting in 627,000 deaths (WHO, 2014). The overwhelming majority that is 90% of these cases occur in Africa (Council, 2001). Most of the deaths occur in children. However, the rate of deaths in children has been reduced by 54% since 2000 (WHO, 2014). The countries with most confirmed cases are in sub-Saharan Africa and India (Time series analysis of Malaria in Kumasi using ARIMA models to forecast future incidence ). Moreover, malaria contributed to 2.05% to the total global death in 2000 and was responsible for 9% of all death in Africa (WHO, 2003). WHO also estimated that the cost of malaria in Africa was US$ 1.08 billion in 1995 and US$ 2 billion in 1997 (WHO, 1997). According to the WHO report, estimates of 3.3 billion people are at risk of malaria, of which 1.2 billion are at high risk. In a high-risk area, more than one malaria case occurs per 1000 population (WHO, 2014). 2005 edition of the daily graphic, it was reported that 2000 pregnant women and 15000 children below the age of five died of malaria. The ministry of health reported that a quarter of these cases of child mortality were attributed to malaria, which he said was responsible for 36% of all admissions in the country hospital over ten years (Elvis Adam, 2017) ● Malaria is a life-threatening disease caused by parasites that are transmitted to people through the bites of infected female Anopheles mosquitoes. It is preventable and curable. ● In 2017, there were an estimated 219 million cases of malaria in 87 countries. ● The estimated number of malaria deaths stood at 435 000 in 2017.
  • 20. 20 ● The WHO African Region carries a disproportionately high share of the global malaria burden. In 2017, the region was home to 92% of malaria cases and 93% of malaria deaths. ● Total funding for malaria control and elimination reached an estimated US$ 3.1 billion in 2017. Contributions from governments of endemic countries amounted to US$ 900 million, representing 28% of total funding. According to the latest World malaria report, released on November 2018, there were 219 million cases of malaria in 2017, up from 217 million cases in 2016. The estimated number of malaria deaths stood at 435 000 in 2017, a similar number to the previous year. The WHO African Region continues to carry a disproportionately high share of the global malaria burden. In 2017, the region was home to 92% of malaria cases and 93% of malaria deaths.In 2017, 5 countries accounted for nearly half of all malaria cases worldwide: Nigeria (25%), the Democratic Republic of the Congo (11%), Mozambique (5%), India (4%) and Uganda (4%) (world malaria report, 2018). Children under 5 years of age are the most vulnerable group affected by malaria; in 2017, they accounted for 61% (266 000) of all malaria deaths worldwide.In most cases, malaria is transmitted through the bites of female Anopheles mosquitoes. There are more than 400 different species of Anopheles mosquito; around 30 are malaria vectors of major importance. All of the important vector species bite between dusk and dawn. The intensity of transmission depends on factors related to the parasite, the vector, the human host, and the environment. Anopheles mosquitoes lay their eggs in water, which hatch into larvae, eventually emerging as adult mosquitoes. The female mosquitoes seek a blood meal to nurture their eggs. Each species of Anopheles mosquito has its own preferred aquatic habitat; for example, some prefer small, shallow collections of freshwater, such as puddles and hoof prints, which are abundant during the rainy season in tropical countries. Transmission is more intense in places where the mosquito lifespan is longer (so that the parasite has time to complete its development inside the mosquito) and where it prefers to bite humans rather than other animals. The long lifespan and strong human-biting habit of the African vector species is the main reason why approximately 90% of the world's malaria cases are in Africa.
  • 21. 21 WHO recommends protection for all people at risk of malaria with effective malaria vector control. Two forms of vector control – insecticide-treated mosquito nets and indoor residual spraying – are effective in a wide range of circumstances. Sleeping under an insecticide-treated net (ITN) can reduce contact between mosquitoes and humans by providing both a physical barrier and an insecticidal effect. Population-wide protection can result from the killing of mosquitoes on a large scale where there is high access and usage of such nets within a community. In 2017, about half of all people at risk of malaria in Africa were protected by an insecticide- treated net, compared to 29% in 2010. However, ITN coverage increased only marginally in the period 2015 to 2017. Indoor residual spraying (IRS) with insecticides is another powerful way to rapidly reduce malaria transmission. It involves spraying the inside of housing structures with an insecticide, typically once or twice per year. To confer significant community protection, IRS should be implemented at a high level of coverage (WIKIPEDIA, 2019). Since 2012, WHO has recommended seasonal malaria chemoprevention as an additional malaria prevention strategy for areas of the Sahel sub-region of Africa. The strategy involves the administration of monthly courses of amodiaquine plus sulfadoxine-pyrimethamine to all children under 5 years of age during the high transmission season. Since 2000, progress in malaria control has resulted primarily from expanded access to vector control interventions, particularly in sub-Saharan Africa. However, these gains are threatened by emerging resistance to insecticides among Anopheles mosquitoes. According to the latest World malaria report, 68 countries reported mosquito resistance to at least 1 of the 5 commonly-used insecticide classes in the period 2010-2017; among these countries, 57 reported resistance to 2 or more insecticide classes (world malaria report, 2017). Despite the emergence and spread of mosquito resistance to pyrethroids (the only insecticide class used in ITNs), insecticide-treated nets continue to provide a substantial level of protection in most
  • 22. 22 settings. This was evidenced in a large 5 country study coordinated by WHO between 2011 and 2016. While the findings of this study are encouraging, WHO continues to highlight the urgent need for new and improved tools in the global response to malaria. To prevent an erosion of the impact of core vector control tools, WHO also underscores the critical need for all countries with ongoing malaria transmission to develop and apply effective insecticide resistance management strategies (WHO, 2002). Early diagnosis and treatment of malaria reduces disease and prevents deaths. It also contributes to reducing malaria transmission. The best available treatment, particularly for P. falciparum malaria, is artemisinin-based combination therapy (ACT). WHO recommends that all cases of suspected malaria be confirmed using parasite-based diagnostic testing (either microscopy or rapid diagnostic test) before administering treatment. Results of parasitological confirmation can be available in 30 minutes or less. Treatment, solely on the basis of symptoms should only be considered when a parasitological diagnosis is not possible. More detailed recommendations are available in the "WHO Guidelines for the treatment of malaria", third edition, published on April 2015. At the World Health Assembly in May 2015, WHO launched the Strategy for malaria elimination in the Greater Mekong sub region (2015–2030), which was endorsed by all the countries in the sub region. Urging immediate action, the strategy calls for the elimination of all species of human malaria across the region by 2030, with priority action targeted to areas where multidrug-resistant malaria has taken root. Surveillance entails tracking of the disease and programmatic responses and taking action based on the data received. Currently, many countries with a high burden of malaria have weak surveillance systems and are not in a position to assess disease distribution and trends, making it difficult to optimize responses and respond to outbreaks. Effective surveillance is required at all points on the path to malaria elimination. Stronger malaria surveillance systems are urgently needed to enable a timely and effective malaria response in endemic regions, to prevent outbreaks and resurgences, to track progress, and to hold governments and the global malaria community accountable.Malaria elimination is defined as the interruption
  • 23. 23 of local transmission of a specified malaria parasite species in a defined geographical area as a result of deliberate activities. Malaria eradication is defined as the permanent reduction to zero of the worldwide incidence of malaria infection caused by human malaria parasites as a result of deliberate activities. Interventions are no longer required once eradication has been achieved (WHO, 1997). Countries that have achieved at least 3 consecutive years of 0 local cases of malaria are eligible to apply for the WHO certification of malaria elimination. In recent years, 9 countries have been certified by the WHO Director-General as having eliminated malaria: United Arab Emirates (2007), Morocco (2010), Turkmenistan (2010), Armenia (2011), Maldives (2015), Sri Lanka (2016), Kyrgyzstan (2016), Paraguay (2018) and Uzbekistan (2018). The WHO Framework for Malaria Elimination (2017) provides a detailed set of tools and strategies for achieving and maintaining elimination (framework for malaria elimination, 2017).
  • 24. 24 CHAPTER THREE: METHODOLOGY 3.1 Data collection procedure Quantitative data will be collected which will be purely secondary in nature. It will be collected from the RUBAVU Hospital. The data will be collected on the following variables; 1. severity 2. Year 3.2 Data sources Data was collected from the RUBAVU Hospital website and from the MALARIA registry of the hospital. It consists of a number of MALARIA cases in the registry for the past five years. 3.3 Data editing The data was entered into a Microsoft Excel spreadsheet, cross-checked for consistency, correctness and reliability to ensure that it is perfect before analysis can be done. 3.4 Data analysis The quantitative data were analyzed using STATA. The analysis will be done at uni-variate level. 3.5.1.Univariate analysis At the univariate level, data analysis was based on Box-Jenkins methodology for testing the distribution and forecasting the time series and was done in four stages. 3.5.2.Time Series analysis The time series analysis of Malaria cases will follow the Box -Jenkins Methodology.
  • 25. 25 Diagrammatic Illustration of the Box-Jenkins Methodology Stage 1: Identification Stage 2: Estimation Step 3: Diagnostic Check Choose one or more ARIMA models as candidates Estimate the parameters of the Model chosen in Step 1 Check the candidate Model for adequacy Forecast Is Model satisfactory? NoYes
  • 26. 26 First, the time series was summarized using line plots to provide an insight into the nature of the data. The data was then tested for stationarity as a requirement for Box-Jenkins criteria using the Augmented Dickey Fuller (ADF) test. In case the series were not stationary, further differencing was be done to achieve stationarity. Secondly, a series of ARIMA (Autoregressive Integrated Moving Average) models were fitted and investigated for suitability. The appropriate model lags were obtained by plotting the Autocorrelation Function (ACF) and Partial Autocorrelation Function (PACF) on the correlogram plot. The selected lags were tested to assess the invertibility condition for the AR and MA models and the white noise tests will be made to ascertain whether the variables are independent. Furthermore, using an appropriate model, the principle of parsimony was put into consideration thus the smallest number of coefficients were used to explain the data. Thirdly, the estimated model was used to make a forecast of malaria cases by severity and predicted series were plotted on a graph. Identification Identification process started with preliminary examinations of Malaria series to establish their stationary properties by observing the behavior of series using graphical plots. Where a trend was observed the series were differenced to make them stationary-oscillating about the mean. In addition, Autocorrelation (ACF) and Partial Correlation Function (PACF) plots for the series in level and in differenced from were examined. Identification of the appropriate ARIMA (p, d, q) structure followed from Johnston & Dinardo summarized in the table below; Table 3.2: Model Identification parameters Model Structure ACF PACF
  • 27. 27 AR(p) Damps out towards zero Cuts-off after lag p MA(q) Cuts-off after lag q Damps out towards zero ARIMA Damps out towards zero Decays-off towards The ARIMA Model Estimation The study followed ARIMA (p,d,q) process proposed by the Box and Jenkins (1976). Where p is the order of AR(p) process, q relates to the order of MA(q) process and d is the order of integration. The appropriate ARIMA (p,d,q) model was selected based on suitable AR(q) and MA(q) process obtained through an iterative process starting from maximum lag of 12 dictated data frequency and the procedure adopted from Meyler et at. (1998) and Alnaa & Abdul-Mumuni (2005). The standard ARIMA (p,d,q) model takes the form below: Yt = φtYt-1+ φ2Yt-2 …+φpYt-p + ϵt - θ1 ϵt-1 - θ2ϵt-2 …- θqϵt-q Where; Yt = First difference of malaria cases P = lag order of AR process component q = lag order of MA process component ϵt = error term at time t Yt, Yt-1, …. Yt-p = lagged difference malaria cases ϵt-1, ϵt-2, …, ϵt-q = lagged residuals φp, φ2…, φp, θ1, θ2, …, θq are parameters to be estimated.
  • 28. 28 Diagnostics Checking The Bartlett’s white noise test ascertains whether the obtained residuals are independent. Bartlett’s white noise test was performed to determine whether the model selected is good for the data. Regression analysis was later carried out to test the suitability of the estimated models for forecasting and fit the model. 3.5.3 Analytical Method A simple linear regression model using Microsoft Excel for univariate analysis was fitted to predict the malaria cases by severity in Rwanda as shown below; Y=Bo + BiXi + ϵi Where Y = number malaria cases Bo = constant term Xi = previous year ϵi = Error term at time i 3.5.4 Test ofSignificance The study adopted a 95% confidence level to determine the statistical significance of the independent variables in relation to the independent variables. The hypotheses were accepted if the p-value was less than the 5% level of significance and rejected if the p-value is greater than 5%. The adjusted R-squared and coefficients of determination showed how the variation in malaria cases is explained by malaria occurrence in the previous years . 3.6 Limitations There was limited data on malaria cases below year 2012 making current assumptions based on old data was difficult. Thus it would be better if there were more data in order to expand the years and forecasting Horizon.
  • 29. 29
  • 30. 30 CHAPTER FOUR: PRESENTATION, INTERPRETATION, AND DISCUSSION OF THE FINDINGS 4.0 Introduction In this chapter, data is presented, analysed and interpreted. Results are presented in various tables and graphs for visual analysis and descriptive statistics. The Augmented Dickey-Fuller test statistic was used to carry out hypothesis testing for the study hypotheses tested in chapter one, from which interpretation is made. 4.1 Hypothesis testing In testing hypotheses, The Augmented Dickey-Fuller test statistic was used to carry out hypothesis testing, using STATA to test for Stationarity by focusing on only two values of the result; Z(t) and Mackinnon p-value for Z(t) and For a time-series data to be stationary, the Z(t) should; • have a large negative number. • p-value should be significant at least on 5% level. If neither conditions are met in this test, the null hypothesis i.e. time series data is non-stationary, cannot be rejected. 4.1.1 Research Hypothesis One H0: Simple Malaria cases are not trended Ha: Simple Malaria cases are trended Calculation: Dickey fuller test for simple malaria cases dfuller simple, lags(0) Dickey-Fuller test for unit root Number of obs = 83
  • 31. 31 Table 1 Dickey fuller test for simple malaria cases ---------- Interpolated Dickey-Fuller --------- Test Statistic 1% Critical Value 5% Critical Value 10% Critical Value Z(t ) - 4.238 -3.534 -2.904 -2.587 Source: compiled by researcher from STATA MacKinnon approximate p-value for Z(t) = 0.0006 The Zt value is a large negative value (-4.238) and the p-value is less than 0.05 (0.0006) , we fail to reject the null hypothesis and we conclude that simple malaria occurrence is not trended. Time series plot of simple Malaria cases ● The Y-axis represents the occurrence of simple Malaria cases. ● The X-axis represents time in months.
  • 32. 32 Figure 1 Time series plot for simple malaria cases Source: compiled by researcher from STATA 4.1.2 Research Hypothesis Two H0: Occurrence of Severe Malaria cases is not trended. Ha: Occurrence of Severe Malaria cases is trended. Calculation : Dickey fuller test for severe malaria cases dfuller severe, lags(0) Dickey-Fuller test for unit root Number of obs = 83
  • 33. 33 Table 2 Dickey fuller test for severe malaria cases ---------- Interpolated Dickey-Fuller --------- Test Statisti c 1% Critical Value 5% Critical Value 10% Critical Value Z(t ) -4.906 -3.534 2.587 -2.904 - MacKinnon approximate p-value for Z(t) = 0.0000 Source: compiled by researcher from STATA The Zt value is a large negative value (-4.906) and the p-value is less than 0.05 (0.000) , we fail to reject the null hypothesis and we conclude that severe malaria occurrence is not trended. Time series plot for Severe Malaria cases ● The Y-axis represents simple Malaria cases. ● The X-axis represents time in months.
  • 34. 34 Figure 2 Time series plot for severe malaria cases Source: compiled by researcher from STATA 4.1.3 Research Hypothesis Three H0: The occurrence of malaria cases is not trended. Ha: ccurrence of malaria cases is trended. Calculation:
  • 35. 35 Table 3 Dickey fuller test for total malaria cases dfuller total , lags(0) Dickey-Fuller test for unit root Number of observations = 83 ---------- Interpolated Dickey-Fuller --------- Test Statisti c 1% Critical Value 5% Critical Value 10% Critical Value Z(t ) -4.282 -3.534 -2.587 -2.904 MacKinnon approximate p-value for Z(t) = 0.0005 Source: compiled by researcher from STATA The Zt value is a large negative(-4.282) and the p-value is less than 0.05 (0.0005), we fail to reject the null hypothesis and we conclude that malaria occurrence is not trended. Figure SEQ Figure * ARABIC3 Time series plot for total malaria cases
  • 36. 36 Source: compiled by researcher from STATA From the diagram above, it was observed that malaria cases have fallen and hit their lowest in june 2018 with cases less than 700. The effect of seasons also affected the cases as dry seasons recorded a large number of cases and wet seasons recorded a small number of malaria cases. 7 0 8 0 9 0 1 0 1 1 1 2 to ta Jul -12 Jan -14 Jul -15 Jan -17 Jul -18t
  • 37. 37 Figure 4 Correlogram for simple malaria cases Source: compiled by researcher from STATA The above correlogram for malaria cases showed that only one lag is highly correlated and is outside our confidence interval which determined our p to be one (p=1)
  • 38. 38 Figure 5 Partial correlogram for simple malaria cases Source: compiled by researcher from STATA The above correlogram for malaria cases showed that only one lag is highly correlated and is outside our confidence interval which determined our p to be one (q=0)
  • 39. 39 4.2 Arima model for Simple Malaria cases Figure 6 Source: compiled by researcher from STATA From the ARIMA model above, there was significant high correlation in the series since the results show that AR(1) coefficient is 0.614 and is highly significant since the first lag is significant since the P value is less than the critical (P<0.05) .
  • 40. 40
  • 41. 41 Figure 7 Correlogram for severe malaria cases Source: compiled by researcher from STATA The above correlogram for malaria cases showed that only one lag is highly correlated and is outside our confidence interval which determined our p to be one (p=1)
  • 42. 42 Figure 8 Partial correlogram for severe malaria cases Source: compiled by researcher from STATA The above partial correlogram for malaria cases showed that only two lags are highly correlated and is outside our confidence interval which determined our p to be one (q=2).
  • 43. 43 4.3 Arima model for Severe Malaria cases Figure 9 Source: compiled by researcher from STATA
  • 44. 44 From the ARIMA model above, there significant high correlation in the series since the results show that AR(1) coefficient is -0.303, AR(2) coefficient is 0.377 and MA(1) coefficient is 1.00003 and all are highly significant the first lag is significant since the P value is less than the critical (P<0.05) . Figure 10 Correlogram for total malaria cases Source: compiled by researcher from STATA The above correlogram for malaria cases showed that only one lag is highly correlated and is outside our confidence interval which determined our p to be one (p=1).
  • 45. 45
  • 46. 46 Figure 11 Partial correlogram for total malaria cases Source: compiled by researcher from STATA The above partial correlogram for malaria cases showed that only three lags are highly correlated and is outside our confidence interval which determined our q to be zero (q=3).
  • 47. 47 4.4 Arima model for Total Malaria cases Figure 12 Source: compiled by researcher from STATA From the ARIMA model above, there significant high correlation in the series since the results show that AR(1) coefficient is 0.616 and is highly significant the first lag is significant since the P value is less than the critical (P<0.05) .
  • 48. 48 4.5 Diagnostics Tests The Bartlett’s white noise test ascertains whether the obtained residuals are independent. Bartlett’s white noise test was performed to determine whether the model selected is good for the data. Regression analysis was later carried out to test the suitability of the estimated models for forecasting and fit the model. 4.5.1 White noise testfor malaria cases by severity and total Using the portmanteau white noise test for normality of the residuals yields the following results. Table 4 White noise test output for normality of residual simple malaria cases Portmanteau (Q) Statistic 6.4317 Prob >chi2(1) 0.0394 Basing on table 4.5 results of portmanteau white noise, P=0.0394<0.05. It can thus be concluded that the residuals of simple malaria series are not independent. Figure 13 Cumulative Periodogram white-noise test for simple malaria cases But the Figure 4.30 above has a plot of the cumulative periodogram that doesn’t appear outside the confidence interval which implies the fitted model is appropriate for forecasting.
  • 49. 49 Table 5 White noise test output for normality of severe malaria cases Portmanteau (Q) Statistic 8.2645 Prob >chi2(1) 0.028 Basing on table 4.6 results of portmanteau white noise, P=0.028<0.05. It can thus be concluded that the residuals of severe malaria series are independent. Figure 14 Cumulative Periodogram White-Noise test for severe malaria cases Figure 4.31 above has a plot of the cumulative periodogram that doesn’t appear outside the confidence interval which implies that the fitted model is appropriate for forecasting. Table 6 White noise test output for normality of total malaria cases Portmanteau (Q) Statistic 7.6727 Prob >chi2(1) 0.0345 Basing on table 4.7 results of portmanteau white noise, P=0.0345<0.05. It can thus be concluded that the residuals of total malaria cases series are not independent.
  • 50. 50 Figure 15 Cumulative Periodogram white-noise test for total malaria cases But the Figure 4.32 above has a plot of the cumulative periodogram that doesn’t appear outside the confidence interval which implies the fitted model is appropriate for forecasting. 4.6 Regressionanalysis Table 7 regression analysis for simple malaria cases Regression Statistics Multiple R 0.121469 9 R Square 0.614754 94 Adjusted R Square 0.622739 75 Standard Error 70.06910 25 Observations 84 ANOVA
  • 51. 51 df SS MS F Significan ce F Regression 1 6029.2048 24 6029.2 05 15.2280 24 0.0310314 61 Residual 82 402593.68 8 4909.6 79 Total 83 408622.89 29 Coefficie nts Standard Error t Stat P-value Lower 95% Upper 95% Lower 95.0% Upper 95.0% Intercept 484.8855 42 15.427878 7 31.429 18 1.68E- 47 454.19457 68 515.57 65 454.19 46 515.57 65 X Variable 1 - 0.349407 7 0.3153036 7 - 1.1081 6 0.27103 1 - 0.9766471 56 0.2778 32 - 0.9766 5 0.2778 32 Our model was simple malaria= 484.88 – 0.349t From the table above it was observed that the coefficient of determination(R squared) is 61.4% which meant that the model is a good fit and the probability value was 0.03 which is less than the critical 0.05 implying significance. Table 8 regression analysis for severe malaria cases Regression Statistics Multiple R 0.011525 R Square 0.72133 Adjusted R Square 0.73206 Standard Error 60.03489 Observations 84 ANOVA
  • 52. 52 df SS MS F Significan ce F Regression 1 39.264 07 39.264 07 22.0108 94 0.017127 Residual 82 295543 .4 3604.1 88 Total 83 295582 .7 Coefficien ts Standar d Error t Stat P-value Lower 95% Upper 95% Lower 95.0% Upper 95.0% Intercept 469.7421 13.218 54 35.536 62 1.41E- 51 443.4462 496.03 8 443.44 62 496.03 8 X Variable 1 -0.12819 0.2701 51 0.1043 74 0.01712 7 -0.50922 0.5656 13 - 0.5092 2 0.5656 13 Our model was severe malaria= 469.74 – 0.128t From the table above it was observed that the coefficient of determination(R squared) is 72.1% which meant that the model is a good fit and the probability value was 0.017 which is less than the critical 0.05 implying significance. Table 9 regression analysis for total malaria cases Regression Statistics Multiple R 0.065907 R Square 0.824344 AdjustedR Square 0.837798 StandardError 119.3451 Observations 84
  • 53. 53 ANOVA df SS MS F Significan ce F Regression 1 5095.36 8 5095.36 8 0.35773 9 0.01413 Residual 82 116794 7 14243.2 5 Total 83 117304 2 Coefficien ts Standar d Error t Stat P-value Lower 95% Upper 95% Lower 95.0% Upper 95.0% Intercept 954.6277 26.2775 1 36.3286 9 2.56E- 52 902.3533 1006.90 2 902.353 3 1006.90 2 X Variable 1 -0.32121 0.53704 - 0.59811 0.04141 3 -1.38956 0.74713 4 - 1.38956 0.74713 4 Our model was severe malaria= 954.63 – 0.321t From the table above it was observed that the coefficient of determination(R squared) is 82.4% which meant that the model is a good fit and the probability value was 0.014 which is less than the critical 0.05 implying significance.
  • 54. 54 4.6 forecasting malaria cases by severity and total Table 10 forecast for malaria cases year Simple malaria cases Severe malaria cases Total malaria cases January 2019 455.2 458.9 927.3 January 2020 451 457.3 923.5 January 2021 446.8 455.8 919.6 January 2022 442.6 454.3 915.8 January 2023 438.5 452.7 911.9
  • 55. 55 CHAPTER FIVE: SUMMARY, CONCLUSIONS AND RECOMMENDATIONS 5.0 Introduction This chapter covers the summary, it further includes the conclusion based on the findings from the study and presents the appropriate recommendations. 5.1 SUMMARY AND CONCLUSIONS Findings from this research have highlighted a number of issues concerning malaria particularly severe malaria and simple malaria. 5.1.1 Simple Malaria It was found that simple malaria has been decreasing slightly over the past 7 years. Results show that simple malaria occurrence is affected by seasonality. In Rwanda there are two seasons, dry seasons that occur from June to mid September, then from December to February that record a large number of malaria cases. The wet season starts from March to May, then from October to November that records a slight decrease in malaria cases. 5.1.2 Severe Malaria It was found that severe malaria has been decreasing slightly over the past 7 years. Results show that simple malaria occurrence is affected by seasonality. In Rwanda there are two seasons, dry seasons that occur from June to mid September, then from December to February that record a
  • 56. 56 large number of malaria cases. The wet season starts from March to May, then from October to November that records a slight decrease in malaria cases. 5.1.3 Total Malaria It was found that severe malaria has been decreasing slightly over the past 7 years. Results show that simple malaria occurrence is affected by seasonality. In Rwanda there are two seasons, dry seasons that occur from June to mid September, then from December to February that record a large number of malaria cases. The wet season starts from March to May, then from October to November that records a slight decrease in malaria cases. 5.2 RECOMMENDATIONS The Government of Rwanda should be given credit for giving Malaria the attention it deserves, However, a lot has to be done as regards this disease. The following suggestions have been recommended according to the findings; 1. Many government policies have put much emphasis on treatment of Malaria by providing medicine such as Coartem to mention but a few. However, preventive care should be number one priority. People should be sensitized on the importance of mosquito nets, indoor Residual Spraying . 2. Awareness on mosquito activity, factors that attract mosquitoes suchs as bushes and swamps, the different seasons for mosquito activity should be provided through Education and the media.
  • 57. 57 Table 11 DATA FROM RUBAVU DISTRICT HOSPITAL t simple severe total Jan-12 530 500 1030 Feb-12 500 426 926 Mar- 12 485 429 914 Apr-12 400 450 850 May- 12 450 495 945 Jun-12 540 554 1094 Jul-12 560 522 1082 Aug- 12 520 470 990 Sep-12 435 456 891 Oct-12 422 482 904 Nov- 12 367 464 831 Dec-12 389 437 826 Jan-13 416 473 889 Feb-13 381 420 801
  • 58. 58 Mar- 13 336 371 707 Apr-13 370 362 732 May- 13 445 393 838 Jun-13 458 420 878 Jul-13 537 522 1059 Aug- 13 488 450 938 Sep-13 425 370 795 Oct-13 451 400 851 Nov- 13 431 390 821 Dec-13 427 473 900 Jan-14 596 560 1156 Feb-14 538 470 1008 Mar- 14 516 458 974 Apr-14 490 520 1010 May- 14 523 539 1062 Jun-14 565 623 1188 Jul-14 524 472 996 Aug- 14 564 450 1014 Sep-14 441 502 943 Oct-14 519 462 981 Nov- 14 518 482 1000 Dec-14 424 449 873 Jan-15 472 448 920
  • 59. 59 Feb-15 434 378 812 Mar- 15 436 449 885 Apr-15 496 423 919 May- 15 541 455 996 Jun-15 560 554 1114 Jul-15 567 568 1135 Aug- 15 474 479 953 Sep-15 462 508 970 Oct-15 501 559 1060 Nov- 15 484 557 1041 Dec-15 461 535 996 Jan-16 448 472 920 Feb-16 378 434 812 Mar- 16 449 436 885 Apr-16 423 490 913 May- 16 455 430 885 Jun-16 564 560 1124 Jul-16 579 545 1124 Aug- 16 481 471 952 Sep-16 510 452 962 Oct-16 564 505 1069 Nov- 16 557 481 1038
  • 60. 60 Dec-16 535 456 991 Jan-17 564 596 1160 Feb-17 451 535 986 Mar- 17 468 508 976 Apr-17 527 479 1006 May- 17 549 521 1070 Jun-17 631 558 1189 Jul-17 487 531 1018 Aug- 17 460 567 1027 Sep-17 500 448 948 Oct-17 468 516 984 Nov- 17 482 513 995 Dec-17 313 400 713 Jan-18 420 432 852 Feb-18 371 362 733 Mar- 18 371 320 691 Apr-18 393 380 773 May- 18 455 430 885 Jun-18 545 510 1055 Jul-18 436 460 896 Aug- 18 353 415 768 Sep-18 396 440 836 Oct-18 390 425 815
  • 61. 61 Nov- 18 313 422 735 Dec-18 328 430 758
  • 62. 62 REFERENCES assessing thesocial vulnerabilityto malaria in Rwanda. Bizimana,J.-P.(2015).Assessingthe social vulnerabilitytomalaria. Council,M.R. (2001). ElvisAdam,A.M. (2017). time seriesanalysisof malariacasesinkasenaNankanamunicipality. frameworkformalariaelimination.(2017). guidelinesfortreatmentof malaria.(2015). MOH. (n.d.). National instituteof Statisticsof Rwanda.(2016, march).RwandaDemographicHealthsurvey.p.173. (2018). PRESIDENT'SMALARIA INITIATIVEMalaria operationalplan. MOH. SergioChicumbe,R.Z.(2019, january25). Communityknowledge andacceptance of indoorresidual sprayiingformalariapreventioninMozambique. Time seriesanalysisof MalariainKumasi usingARIMA modelstoforecastfuture inidence.(n.d.). WHO. (n.d.). WHO. (1997). WHO. (2002). WHO. (2003). WHO. (2003). WHO. (2014). WIKIPEDIA.(2019).