Respiratory virus shedding in exhaled breath and efficacy of face masks
•
0 likes•1,890 views

1) The study identified seasonal human coronaviruses, influenza viruses, and rhinoviruses in exhaled breath and coughs of children and adults with acute respiratory illness. 2) Surgical face masks significantly reduced detection of influenza virus RNA in respiratory droplets and coronavirus RNA in aerosols. There was also a trend toward reduced detection of coronavirus RNA in respiratory droplets. 3) The results indicate that surgical face masks could help prevent transmission of human coronaviruses and influenza viruses from symptomatic individuals.

Recommended
Recommended
More Related Content
What's hot
What's hot (20)
Similar to Respiratory virus shedding in exhaled breath and efficacy of face masks
Similar to Respiratory virus shedding in exhaled breath and efficacy of face masks (20)
More from Valentina Corona
More from Valentina Corona (20)
Recently uploaded
Recently uploaded (20)
Respiratory virus shedding in exhaled breath and efficacy of face masks
- 1. Brief Communication https://doi.org/10.1038/s41591-020-0843-2 1 WHO Collaborating Centre for Infectious Disease Epidemiology and Control, School of Public Health, Li Ka Shing Faculty of Medicine, The University of Hong Kong, Hong Kong, China. 2 Department of Microbiology, Li Ka Shing Faculty of Medicine, The University of Hong Kong, Hong Kong, China. 3 Department of Environmental Health, Harvard School of Public Health, Boston, MA, USA. 4 Department of Surgery, Queen Mary Hospital, Hong Kong, China. 5 Department of Mechanical Engineering, The University of Hong Kong, Hong Kong, China. 6 Department of Pathology, Hong Kong Baptist Hospital, Hong Kong, China. 7 Maryland Institute for Applied Environmental Health, School of Public Health, University of Maryland, College Park, MD, USA. 8 These authors jointly supervised this work: Donald K. Milton, Benjamin J. Cowling. ✉e-mail: bcowling@hku.hk We identified seasonal human coronaviruses, influenza viruses and rhinoviruses in exhaled breath and coughs of chil- dren and adults with acute respiratory illness. Surgical face masks significantly reduced detection of influenza virus RNA in respiratory droplets and coronavirus RNA in aerosols, with a trend toward reduced detection of coronavirus RNA in respi- ratory droplets. Our results indicate that surgical face masks could prevent transmission of human coronaviruses and influ- enza viruses from symptomatic individuals. Respiratory virus infections cause a broad and overlapping spec- trum of symptoms collectively referred to as acute respiratory virus illnesses (ARIs) or more commonly the ‘common cold’. Although mostly mild, these ARIs can sometimes cause severe disease and death1 . These viruses spread between humans through direct or indirect contact, respiratory droplets (including larger droplets that fall rapidly near the source as well as coarse aerosols with aerody- namic diameter >5 µm) and fine-particle aerosols (droplets and droplet nuclei with aerodynamic diameter ≤5 µm)2,3 . Although hand hygiene and use of face masks, primarily targeting contact and respiratory droplet transmission, have been suggested as important mitigation strategies against influenza virus transmission4 , little is known about the relative importance of these modes in the trans- mission of other common respiratory viruses2,3,5 . Uncertainties similarly apply to the modes of transmission of COVID-19 (refs. 6,7 ). Some health authorities recommend that masks be worn by ill individuals to prevent onward transmission (source control)4,8 . Surgical face masks were originally introduced to protect patients from wound infection and contamination from surgeons (the wearer) during surgical procedures, and were later adopted to protect healthcare workers against acquiring infection from their patients. However, most of the existing evidence on the filtering effi- cacy of face masks and respirators comes from in vitro experiments with nonbiological particles9,10 , which may not be generalizable to infectious respiratory virus droplets. There is little information on the efficacy of face masks in filtering respiratory viruses and reduc- ing viral release from an individual with respiratory infections8 , and most research has focused on influenza11,12 . Here we aimed to explore the importance of respiratory droplet and aerosol routes of transmission with a particular focus on coro- naviruses, influenza viruses and rhinoviruses, by quantifying the amount of respiratory virus in exhaled breath of participants with medically attended ARIs and determining the potential efficacy of surgical face masks to prevent respiratory virus transmission. Results We screened 3,363 individuals in two study phases, ultimately enrolling 246 individuals who provided exhaled breath samples (Extended Data Fig. 1). Among these 246 participants, 122 (50%) participants were randomized to not wearing a face mask during the first exhaled breath collection and 124 (50%) participants were randomized to wearing a face mask. Overall, 49 (20%) voluntarily provided a second exhaled breath collection of the alternate type. Infections by at least one respiratory virus were confirmed by reverse transcription PCR (RT–PCR) in 123 of 246 (50%) partici- pants. Of these 123 participants, 111 (90%) were infected by human (seasonal) coronavirus (n = 17), influenza virus (n = 43) or rhinovi- rus (n = 54) (Extended Data Figs. 1 and 2), including one participant co-infected by both coronavirus and influenza virus and another two participants co-infected by both rhinovirus and influenza virus. These 111 participants were the focus of our analyses. There were some minor differences in characteristics of the 111 participants with the different viruses (Table 1a). Overall, 24% of participants had a measured fever ≥37.8 °C, with patients with influ- enza more than twice as likely than patients infected with coronavi- rus and rhinovirus to have a measured fever. Coronavirus-infected participants coughed the most with an average of 17 (s.d. = 30) coughs during the 30-min exhaled breath collection. The profiles of the participants randomized to with-mask versus without-mask groups were similar (Supplementary Table 1). We tested viral shedding (in terms of viral copies per sample) in nasal swabs, throat swabs, respiratory droplet samples and aero- sol samples and compared the latter two between samples collected with or without a face mask (Fig. 1). On average, viral shedding was higher in nasal swabs than in throat swabs for each of coronavi- rus (median 8.1 log10 virus copies per sample versus 3.9), influenza virus (6.7 versus 4.0) and rhinovirus (6.8 versus 3.3), respectively. Viral RNA was identified from respiratory droplets and aerosols for all three viruses, including 30%, 26% and 28% of respiratory droplets and 40%, 35% and 56% of aerosols collected while not wearing a face mask, from coronavirus, influenza virus and rhino- virus-infected participants, respectively (Table 1b). In particular for coronavirus, we identified OC43 and HKU1 from both respiratory Respiratory virus shedding in exhaled breath and efficacy of face masks Nancy H. L. Leung 1 , Daniel K. W. Chu1 , Eunice Y. C. Shiu1 , Kwok-Hung Chan2 , James J. McDevitt3 , Benien J. P. Hau1,4 , Hui-Ling Yen 1 , Yuguo Li5 , Dennis K. M. Ip1 , J. S. Malik Peiris1 , Wing-Hong Seto1,6 , Gabriel M. Leung1 , Donald K. Milton7,8 and Benjamin J. Cowling 1,8 ✉ Nature Medicine | www.nature.com/naturemedicine
- 2. Brief Communication NATuRE MEDicinE droplets and aerosols, but only identified NL63 from aerosols and not from respiratory droplets (Supplementary Table 2 and Extended Data Fig. 3). We detected coronavirus in respiratory droplets and aerosols in 3 of 10 (30%) and 4 of 10 (40%) of the samples collected without face masks, respectively, but did not detect any virus in respiratory drop- lets or aerosols collected from participants wearing face masks, this difference was significant in aerosols and showed a trend toward reduced detection in respiratory droplets (Table 1b). For influenza virus, we detected virus in 6 of 23 (26%) and 8 of 23 (35%) of the Table 1a | Characteristics of individuals with symptomatic coronavirus, influenza virus or rhinovirus infection All who provided exhaled breath Coronavirus Influenza virus Rhinovirus (n = 246) (n = 17) (n = 43) (n = 54) n (%) n (%) n (%) n (%) Female 144 (59) 13 (76) 22 (51) 30 (56) Age group, years 11–17 12 (5) 0 (0) 8 (19) 4 (7) 18–34 114 (46) 10 (59) 11 (26) 24 (44) 35–50 79 (32) 2 (12) 16 (37) 18 (33) 51–64 35 (14) 4 (24) 8 (19) 5 (9) ≥ 65 6 (2) 1 (6) 0 (0) 3 (6) Chronic medical conditions Any 49 (20) 5 (29) 5 (12) 10 (19) Respiratory 18 (7) 0 (0) 4 (9) 3 (6) Influenza vaccination Ever 94 (38) 6 (35) 15 (35) 20 (37) Current season 23 (9) 2 (12) 1 (2) 4 (7) Previous season only 71 (29) 4 (24) 14 (33) 16 (30) Ever smoker 31 (13) 1 (6) 6 (14) 6 (11) Time since illness onset, h <24 22 (9) 0 (0) 5 (12) 2 (4) 24–48 100 (41) 9 (53) 13 (30) 25 (46) 48–72 85 (35) 8 (47) 18 (42) 20 (37) 72–96 39 (16) 0 (0) 7 (16) 7 (13) History of measured fever ≥37.8 °C 58 (24) 3 (18) 17 (40) 8 (15) Measured fever ≥37.8 °C at presentation 36 (15) 2 (12) 18 (42) 2 (4) Measured body temperature (˚C) at enrollment (mean, s.d.) 36.8 (0.8) 36.9 (0.8) 37.4 (0.9) 36.6 (0.7) Symptoms at presentation Fever 111 (45) 10 (59) 27 (63) 16 (30) Cough 198 (80) 15 (88) 40 (93) 44 (81) Sore throat 211 (86) 15 (88) 31 (72) 49 (91) Runny nose 200 (81) 17 (100) 36 (84) 48 (89) Headache 186 (76) 13 (76) 30 (70) 38 (70) Myalgia 176 (72) 12 (71) 31 (72) 34 (63) Phlegm 176 (72) 9 (53) 34 (79) 41 (76) Chest tightness 64 (26) 3 (18) 12 (28) 9 (17) Shortness of breath 103 (42) 6 (35) 14 (33) 25 (46) Chills 100 (41) 8 (47) 29 (67) 16 (30) Sweating 95 (39) 5 (29) 18 (42) 20 (37) Fatigue 218 (89) 16 (94) 38 (88) 48 (89) Vomiting 19 (8) 2 (12) 5 (12) 2 (4) Diarrhea 17 (7) 2 (12) 1 (2) 6 (11) Number of coughs during exhaled breath collection (mean, s.d.) 8 (14) 17 (30) 8 (11) 5 (9) Seasonal coronavirus (n = 17), seasonal influenza virus (n = 43) and rhinovirus (n = 54) infections were confirmed in individuals with acute respiratory symptoms by RT–PCR in any samples (nasal swab, throat swab, respiratory droplets and aerosols) collected. Nature Medicine | www.nature.com/naturemedicine
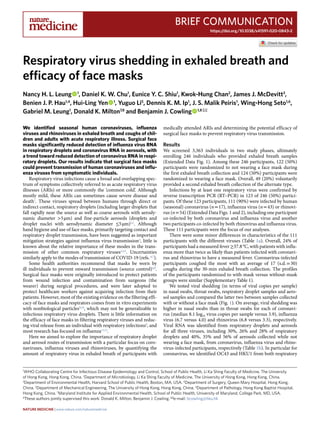
- 3. Brief CommunicationNATuRE MEDicinE 100 102 104 106 108 1010 Coronavirus Sample type Nasal swab Throat swab Droplet particles >5 µm, without mask Droplet particles >5 µm, with mask Aerosol particles ≤5 µm, without mask Aerosol particles ≤5 µm, with mask Sample type Nasal swab Throat swab Droplet particles >5 µm, without mask Droplet particles >5 µm, with mask Aerosol particles ≤5 µm, without mask Aerosol particles ≤5 µm, with mask Sample type Nasal swab Throat swab Droplet particles >5 µm, without mask Droplet particles >5 µm, with mask Aerosol particles ≤5 µm, without mask Aerosol particles ≤5 µm, with mask Viruscopiespersample 100 102 104 106 108 1010 Viruscopiespersample 100 102 104 106 108 1010 Viruscopiespersample P = 0.07 P = 0.02 Influenza virus a b c P = 0.01 P = 0.26 Rhinovirus P = 0.44 P = 0.12 Fig. 1 | Efficacy of surgical face masks in reducing respiratory virus shedding in respiratory droplets and aerosols of symptomatic individuals with coronavirus, influenza virus or rhinovirus infection. a–c, Virus copies per sample collected in nasal swab (red), throat swab (blue) and respiratory droplets collected for 30min while not wearing (dark green) or wearing (light green) a surgical face mask, and aerosols collected for 30min while not wearing (brown) or wearing (orange) a face mask, collected from individuals with acute respiratory symptoms who were positive for coronavirus (a), influenza virus (b) and rhinovirus (c), as determined by RT–PCR in any samples. P values for mask intervention as predictor of log10 virus copies per sample in an unadjusted univariate Tobit regression model which allowed for censoring at the lower limit of detection of the RT–PCR assay are shown, with significant differences in bold. For nasal swabs and throat swabs, all infected individuals were included (coronavirus, n=17; influenza virus, n=43; rhinovirus, n=54). For respiratory droplets and aerosols, numbers of infected individuals who provided exhaled breath samples while not wearing or wearing a surgical face mask, respectively were: coronavirus (n=10 and 11), influenza virus (n=23 and 28) and rhinovirus (n=36 and 32). A subset of participants provided exhaled breath samples for both mask interventions (coronavirus, n=4; influenza virus, n=8; rhinovirus, n=14). The box plots indicate the median with the interquartile range (lower and upper hinge) and ±1.5×interquartile range from the first and third quartile (lower and upper whiskers). Nature Medicine | www.nature.com/naturemedicine
- 4. Brief Communication NATuRE MEDicinE respiratory droplet and aerosol samples collected without face masks, respectively. There was a significant reduction by wearing face masks to 1 of 27 (4%) in detection of influenza virus in respira- tory droplets, but no significant reduction in detection in aerosols (Table 1b). Moreover, among the eight participants who had influ- enza virus detected by RT–PCR from without-mask aerosols, five were tested by viral culture and four were culture-positive. Among the six participants who had influenza virus detected by RT–PCR from with-mask aerosols, four were tested by viral culture and two were culture-positive. For rhinovirus, there were no significant dif- ferences between detection of virus with or without face masks, both in respiratory droplets and in aerosols (Table 1b). Conclusions were similar in comparisons of viral shedding (Table 1b). In addition, we found a significant reduction in viral shedding (Supplementary Table 2) in respiratory droplets for OC43 (Extended Data Fig. 4) and influenza B virus (Extended Data Fig. 5) and in aerosols for NL63 (Extended Data Fig. 4). We identified correlations between viral loads in different samples (Extended Data Figs. 6–8) and some evidence of declines in viral shedding by time since onset for influenza virus but not for coronavirus or rhinovirus (Extended Data Fig. 9). In univari- able analyses of factors associated with detection of respiratory viruses in various sample types, we did not identify significant association in viral shedding with days since symptom onset (Supplementary Table 3) for respiratory droplets or aerosols (Supplementary Tables 4–6). A subset of participants (72 of 246, 29%) did not cough at all dur- ing at least one exhaled breath collection, including 37 of 147 (25%) during the without-mask and 42 of 148 (28%) during the with-mask breath collection. In the subset for coronavirus (n = 4), we did not detect any virus in respiratory droplets or aerosols from any partici- pants. In the subset for influenza virus (n = 9), we detected virus in aerosols but not respiratory droplets from one participant. In the subset for rhinovirus (n = 17), we detected virus in respiratory drop- lets from three participants, and we detected virus in aerosols in five participants. Discussion Our results indicate that aerosol transmission is a potential mode of transmission for coronaviruses as well as influenza viruses and rhinoviruses. Published studies detected respiratory viruses13,14 such as influenza12,15 and rhinovirus16 from exhaled breath, and the detec- tion of SARS-CoV17 and MERS-CoV18 from air samples (without size fractionation) collected from hospitals treating patients with severe acute respiratory syndrome and Middle East respiratory syndrome, but ours demonstrates detection of human seasonal coronaviruses in exhaled breath, including the detection of OC43 and HKU1 from respiratory droplets and NL63, OC43 and HKU1 from aerosols. Our findings indicate that surgical masks can efficaciously reduce the emission of influenza virus particles into the environment in respiratory droplets, but not in aerosols12 . Both the previous and current study used a bioaerosol collecting device, the Gesundheit-II (G-II)12,15,19 , to capture exhaled breath particles and differentiated them into two size fractions, where exhaled breath coarse particles >5 μm (respiratory droplets) were collected by impaction with a 5-μm slit inertial Teflon impactor and the remaining fine particles ≤5 μm (aerosols) were collected by condensation in buffer. We also demonstrated the efficacy of surgical masks to reduce coronavi- rus detection and viral copies in large respiratory droplets and in aerosols (Table 1b). This has important implications for control of COVID-19, suggesting that surgical face masks could be used by ill people to reduce onward transmission. Among the samples collected without a face mask, we found that the majority of participants with influenza virus and coronavirus infection did not shed detectable virus in respiratory droplets or aerosols, whereas for rhinovirus we detected virus in aerosols in 19 of 34 (56%) participants (compared to 4 of 10 (40%) for influenza and 8 of 23 (35%) for coronavirus). For those who did shed virus in respiratory droplets and aerosols, viral load in both tended to be low (Fig. 1). Given the high collection efficiency of the G-II (ref. 19 ) and given that each exhaled breath collection was conducted for 30 min, this might imply that prolonged close contact would be required for transmission to occur, even if transmission was primar- ily via aerosols, as has been described for rhinovirus colds20 . Our results also indicate that there could be considerable heterogene- ity in contagiousness of individuals with coronavirus and influenza virus infections. The major limitation of our study was the large proportion of participants with undetectable viral shedding in exhaled breath for each of the viruses studied. We could have increased the sam- pling duration beyond 30 min to increase the viral shedding being captured, at the cost of acceptability in some participants. An alternative approach would be to invite participants to perform forced coughs during exhaled breath collection12 . However, it was the aim of our present study to focus on recovering respiratory Table 1b | Efficacy of surgical face masks in reducing respiratory virus frequency of detection and viral shedding in respiratory droplets and aerosols of symptomatic individuals with coronavirus, influenza virus or rhinovirus infection Droplet particles >5 μm Aerosol particles ≤5 μm Virus type Without surgical face mask With surgical face mask P Without surgical face mask With surgical face mask P Detection of virus No. positive/no. total (%) No. positive/no. total (%) No. positive/no. total (%) No. positive/no. total (%) Coronavirus 3 of 10 (30) 0 of 11 (0) 0.09 4 of 10 (40) 0 of 11 (0) 0.04 Influenza virus 6 of 23 (26) 1 of 27 (4) 0.04 8 of 23 (35) 6 of 27 (22) 0.36 Rhinovirus 9 of 32 (28) 6 of 27 (22) 0.77 19 of 34 (56) 12 of 32 (38) 0.15 Viral load (log10 virus copies per sample) Median (IQR) Median (IQR) Median (IQR) Median (IQR) Coronavirus 0.3 (0.3, 1.2) 0.3 (0.3, 0.3) 0.07 0.3 (0.3, 3.3) 0.3 (0.3, 0.3) 0.02 Influenza virus 0.3 (0.3, 1.1) 0.3 (0.3, 0.3) 0.01 0.3 (0.3, 3.0) 0.3 (0.3, 0.3) 0.26 Rhinovirus 0.3 (0.3, 1.3) 0.3 (0.3, 0.3) 0.44 1.8 (0.3, 2.8) 0.3 (0.3, 2.4) 0.12 P values for comparing the frequency of respiratory virus detection between the mask intervention were obtained by two-sided Fisher’s exact test and (two-sided) P values for mask intervention as predictor of log10 virus copies per sample were obtained by an unadjusted univariate Tobit regression model, which allowed for censoring at the lower limit of detection of the RT–PCR assay, with significant differences in bold. Undetectable values were imputed as 0.3 log10 virus copies per sample. IQR, interquartile range. Nature Medicine | www.nature.com/naturemedicine
- 5. Brief CommunicationNATuRE MEDicinE virus in exhaled breath in a real-life situation and we expected that some individuals during an acute respiratory illness would not cough much or at all. Indeed, we identified virus RNA in a small number of participants who did not cough at all during the 30-min exhaled breath collection, which would suggest drop- let and aerosol routes of transmission are possible from individu- als with no obvious signs or symptoms. Another limitation is that we did not confirm the infectivity of coronavirus or rhinovirus detected in exhaled breath. While the G-II was designed to preserve viability of viruses in aerosols, and in the present study we were able to identify infectious influenza virus in aerosols, we did not attempt to culture coronavirus or rhinovirus from the corresponding aero- sol samples. Online content Any methods, additional references, Nature Research reporting summaries, source data, extended data, supplementary informa- tion, acknowledgements, peer review information; details of author contributions and competing interests; and statements of data and code availability are available at https://doi.org/10.1038/s41591- 020-0843-2. Received: 2 March 2020; Accepted: 20 March 2020; Published: xx xx xxxx References 1. Nichols, W. G., Peck Campbell, A. J. & Boeckh, M. Respiratory viruses other than influenza virus: impact and therapeutic advances. Clin. Microbiol. Rev. 21, 274–290 (2008). 2. Shiu, E. Y. C., Leung, N. H. L. & Cowling, B. J. Controversy around airborne versus droplet transmission of respiratory viruses: implication for infection prevention. Curr. Opin. Infect. Dis. 32, 372–379 (2019). 3. Tellier, R., Li, Y., Cowling, B. J. & Tang, J. W. Recognition of aerosol transmission of infectious agents: a commentary. BMC Infect. Dis. 19, 101 (2019). 4. Xiao, J. et al. Nonpharmaceutical measures for pandemic influenza in nonhealthcare settings-personal protective and environmental measures. Emerg. Infect. Dis. https://doi.org/10.3201/eid2605.190994 (2020). 5. Kutter, J. S., Spronken, M. I., Fraaij, P. L., Fouchier, R. A. M. & Herfst, S. Transmission routes of respiratory viruses among humans. Curr. Opin. Virol. 28, 142–151 (2018). 6. Cowling, B. J. & Leung, G. M. Epidemiological research priorities for public health control of the ongoing global novel coronavirus (2019-nCoV) outbreak. Euro Surveill. https://doi.org/10.2807/1560-7917.ES.2020.25.6.2000110 (2020). 7. Han, Q., Lin, Q., Ni, Z. & You, L. Uncertainties about the transmission routes of 2019 novel coronavirus. Influenza Other Respir. Viruses https://doi. org/10.1111/irv.12735 (2020). 8. MacIntyre, C. R. & Chughtai, A. A. Facemasks for the prevention of infection in healthcare and community settings. BMJ 350, h694 (2015). 9. Ha’eri, G. B. & Wiley, A. M. The efficacy of standard surgical face masks: an investigation using “tracer particles”. Clin. Orthop. Relat. Res. 148, 160–162 (1980). 10. Patel, R. B., Skaria, S. D., Mansour, M. M. & Smaldone, G. C. Respiratory source control using a surgical mask: an in vitro study. J. Occup. Environ. Hyg. 13, 569–576 (2016). 11. Johnson, D. F., Druce, J. D., Birch, C. & Grayson, M. L. A quantitative assessment of the efficacy of surgical and N95 masks to filter influenza virus in patients with acute influenza infection. Clin. Infect. Dis. 49, 275–277 (2009). 12. Milton, D. K., Fabian, M. P., Cowling, B. J., Grantham, M. L. & McDevitt, J. J. Influenza virus aerosols in human exhaled breath: particle size, culturability, and effect of surgical masks. PLoS Pathog. 9, e1003205 (2013). 13. Huynh, K. N., Oliver, B. G., Stelzer, S., Rawlinson, W. D. & Tovey, E. R. A new method for sampling and detection of exhaled respiratory virus aerosols. Clin. Infect. Dis. 46, 93–95 (2008). 14. Stelzer-Braid, S. et al. Exhalation of respiratory viruses by breathing, coughing and talking. J. Med. Virol. 81, 1674–1679 (2009). 15. Yan, J. et al. Infectious virus in exhaled breath of symptomatic seasonal influenza cases from a college community. Proc. Natl Acad. Sci. USA 115, 1081–1086 (2018). 16. Tovey, E. R. et al. Rhinoviruses significantly affect day-to-day respiratory symptoms of children with asthma. J. Allergy Clin. Immunol. 135, 663–669 (2015). 17. Booth, T. F. et al. Detection of airborne severe acute respiratory syndrome (SARS) coronavirus and environmental contamination in SARS outbreak units. J. Infect. Dis. 191, 1472–1477 (2005). 18. Kim, S. H. et al. Extensive viable Middle East respiratory syndrome (MERS) coronavirus contamination in air and surrounding environment in MERS isolation wards. Clin. Infect. Dis. 63, 363–369 (2016). 19. McDevitt, J. J. et al. Development and performance evaluation of an exhaled-breath bioaerosol collector for influenza virus. Aerosol Sci. Technol. 47, 444–451 (2013). 20. Jennings, L. C. & Dick, E. C. Transmission and control of rhinovirus colds. Eur. J. Epidemiol. 3, 327–335 (1987). Publisher’s note Springer Nature remains neutral with regard to jurisdictional claims in published maps and institutional affiliations. © The Author(s), under exclusive licence to Springer Nature America, Inc. 2020 Nature Medicine | www.nature.com/naturemedicine
- 6. Brief Communication NATuRE MEDicinE Methods Study design. Participants were recruited year-round from March 2013 through May 2016 in a general outpatient clinic of a private hospital in Hong Kong. As routine practice, clinic staff screened all individuals attending the clinics for respiratory and any other symptoms regardless of the purpose of the visit at triage. Study staff then approached immediately those who reported at least one of the following symptoms of ARI for further screening: fever ≥37.8 °C, cough, sore throat, runny nose, headache, myalgia and phlegm. Individuals who reported ≥2 ARI symptoms, within 3 d of illness onset and ≥11 years of age were eligible to participate. After explaining the study to and obtaining informed consent from the participants, a rapid influenza diagnostic test, the Sofia Influenza A + B Fluorescent Immunoassay Analyzer (cat. no. 20218, Quidel), was used to identify influenza A or B virus infection as an incentive to participate. All participants provided a nasal swab for the rapid test and an additional nasal swab and a separate throat swab for subsequent virologic confirmation at the laboratory. All participants also completed a questionnaire to record basic information including age, sex, symptom severity, medication, medical conditions and smoking history. In the first phase of the study from March 2013 to February 2014 (‘Influenza Study’), the result of the rapid test was used to determine eligibility for further participation in the study and exhaled breath collection, whereas in the second phase of the study from March 2014 to May 2016 (‘Respiratory Virus Study’), the rapid test did not affect eligibility. Eligible participants were then invited to provide an exhaled breath sample for 30 min in the same clinic visit. Before exhaled breath collection, each participant was randomly allocated in a 1:1 ratio to either wearing a surgical face mask (cat. no. 62356, Kimberly-Clark) or not during the collection. To mimic the real-life situation, under observation by the study staff, participants were asked to attach the surgical mask themselves, but instruction on how to wear the mask properly was given when the participant wore the mask incorrectly. Participants were instructed to breathe as normal during the collection, but (natural) coughing was allowed and the number of coughs was recorded by study staff. Participants were then invited to provide a second exhaled breath sample of the alternate type (for example if the participant was first assigned to wearing a mask they would then provide a second sample without a mask), but most participants did not agree to stay for a second measurement because of time constraints. Participants were compensated for each 30-min exhaled breath collection with a supermarket coupon worth approximately US$30 and all participants were gifted a tympanic thermometer worth approximately US$20. Ethical approval. Written informed consent was obtained from all participants ≥18 years of age and written informed consent was obtained from parents or legal guardians of participants 11–17 years of age in addition to their own written informed consent. The study protocol was approved by the Institutional Review Board of The University of Hong Kong and the Clinical and Research Ethics Committee of Hong Kong Baptist Hospital. Collection of swabs and exhaled breath particles. Nasal swabs and throat swabs were collected separately, placed in virus transport medium, stored and transported to the laboratory at 2–8 °C and the virus transport medium was aliquoted and stored at −70 °C until further analysis. Exhaled breath particles were captured and differ entiated into two size fractions, the coarse fraction containing particles with aerody namic diameter >5 μm (referred to here as ‘respiratory droplets’), which included droplets up to approximately 100 µm in diameter and the fine fraction with particles ≤5 μm (referred to here as ‘aerosols’) by the G-II bioaerosol collecting device12,15,19 . In the G-II device, exhaled breath coarse particles >5 μm were collected by a 5-μm slit inertial Teflon impactor and the remaining fine particles ≤5 μm were condensed and collected into approximately 170 ml of 0.1% BSA/PBS. Both the impactor and the condensate were stored and transported to the laboratory at 2–8 °C. The virus on the impactor was recovered into 1 ml and the condensate was concentrated into 2 ml of 0.1% BSA/PBS, aliquoted and stored at −70 °C until further analysis. In a validation study, the G-II was able to recover over 85% of fine particles >0.05 µm in size and had comparable collection efficiency of influenza virus as the SKC BioSampler19 . Laboratory testing. Samples collected from the two studies were tested at the same time. Nasal swab samples were first tested by a diagnostic-use viral panel, xTAG Respiratory Viral Panel (Abbott Molecular) to qualitatively detect 12 common respiratory viruses and subtypes including coronaviruses (NL63, OC43, 229E and HKU1), influenza A (nonspecific, H1 and H3) and B viruses, respiratory syncytial virus, parainfluenza virus (types 1–4), adenovirus, human metapneumovirus and enterovirus/rhinovirus. After one or more of the candidate respiratory viruses was detected by the viral panel from the nasal swab, all the samples from the same participant (nasal swab, throat swab, respiratory droplets and aerosols) were then tested with RT–PCR specific for the candidate virus(es) for determination of virus concentration in the samples. Infectious influenza virus was identified by viral culture using MDCK cells as described previously21 , whereas viral culture was not performed for coronavirus and rhinovirus. Statistical analyses. The primary outcome of the study was virus generation rate in tidal breathing of participants infected by different respiratory viruses and the efficacy of face masks in preventing virus dissemination in exhaled breath, separately considering the respiratory droplets and aerosols. The secondary outcomes were correlation between viral shedding in nose swabs, throat swabs, respiratory droplets and aerosols and factors affecting viral shedding in respiratory droplets and aerosols. We identified three groups of respiratory viruses with the highest frequency of infection as identified by RT–PCR, namely coronavirus (including NL63, OC43, HKU1 and 229E), influenza virus and rhinovirus, for further statistical analyses. We defined viral shedding as log10 virus copies per sample and plotted viral shedding in each sample (nasal swab, throat swab, respiratory droplets and aerosols); the latter two were stratified by mask intervention. As a proxy for the efficacy of face masks in preventing transmission of respiratory viruses via respiratory droplet and aerosol routes, we compared the respiratory virus viral shedding in respiratory droplet and aerosol samples between participants wearing face masks or not, by comparing the frequency of detection with a two-sided Fisher’s exact test and by comparing viral load (defined as log10 virus copies per sample) by an unadjusted univariate Tobit regression model, which allowed for censoring at the lower limit of detection of the RT–PCR assay. We also used the unadjusted univariate Tobit regression to investigate factors affecting viral shedding in respiratory droplets and aerosols without mask use, for example age, days since symptom onset, previous influenza vaccination, current medication and number of coughs during exhaled breath collection. We investigated correlations between viral shedding in nasal swab, throat swab, respiratory droplets and aerosols with scatter-plots and calculated the Spearman’s rank correlation coefficient between any two types of samples. We imputed 0.3 log10 virus copies ml−1 for undetectable values before transformation to log10 virus copies per sample. All analyses were conducted with R v.3.6.0 (ref. 22 ) and the VGAM package v.1.1.1 (ref. 23 ). Reporting Summary. Further information on research design is available in the Nature Research Reporting Summary linked to this article. Data availability Anonymized raw data and R syntax to reproduce all the analyses, figures, tables and supplementary tables in the published article are available at: https://doi. org/10.5061/dryad.w9ghx3fkt. References 21. Chan, K. H., Peiris, J. S., Lim, W., Nicholls, J. M. & Chiu, S. S. Comparison of nasopharyngeal flocked swabs and aspirates for rapid diagnosis of respiratory viruses in children. J. Clin. Virol. 42, 65–69 (2008). 22. R: a language and environment for statistical computing (R Foundation for Statistical Computing, Vienna, Austria, 2019). 23. Yee, T. W. Vector Generalized Linear and Additive Models: with an Implementation in R (Springer, 2016). Acknowledgements This work was supported by the General Research Fund of the University Grants Committee (grant no. 765811), the Health and Medical Research Fund (grant no. 13120592) and a commissioned grant of the Food and Health Bureau and the Theme-based Research Scheme (project no. T11-705/14-N) of the Research Grants Council of the Hong Kong SAR Government. We acknowledge colleagues including R. O. P. Fung, A. K. W. Li, T. W. Y. Ng, T. H. C. So, P. Wu and Y. Xie for technical support in preparing and conducting this study and enrolling participants; J. K. M. Chan, S. Y. Ho, Y. Z. Liu and A. Yu for laboratory support; S. Ferguson, W. K. Leung, J. Pantelic, J. Wei and M. Wolfson for technical support in constructing and maintaining the G-II device; V. J. Fang, L. M. Ho and T. T. K. Lui for setting up the database; and C. W. Y. Cheung, L. F. K. Cheung, P. T. Y. Ching, A. C. H. Lai, D. W. Y. Lam, S. S. Y. Lo, A. S. K. Luk and other colleagues at the Outpatient Center and Infection Control Team of Hong Kong Baptist Hospital for facilitating this study. Author contributions All authors meet the International Committee of Medical Journal Editors criteria for authorship. The study protocol was drafted by N.H.L.L. and B.J.C. Data were collected by N.H.L.L., E.Y.C.S. and B.J.P.H. Laboratory testing was performed by D.K.W.C. and K.- H.C. Statistical analyses were conducted by N.H.L.L. N.H.L.L. and B.J.C. wrote the first draft of the manuscript, and all authors provided critical review and revision of the text and approved the final version. Competing interests B.J.C. consults for Roche and Sanofi Pasteur. The authors declare no other competing interests. Additional information Extended data is available for this paper at https://doi.org/10.1038/s41591-020-0843-2. Supplementary information is available for this paper at https://doi.org/10.1038/ s41591-020-0843-2. Correspondence and requests for materials should be addressed to B.J.C. Peer review information Alison Farrell was the primary editor on this article and managed its editorial process and peer review in collaboration with the rest of the editorial team. Reprints and permissions information is available at www.nature.com/reprints. Nature Medicine | www.nature.com/naturemedicine
- 7. Brief CommunicationNATuRE MEDicinE Extended Data Fig. 1 | Participant enrolment, randomization of mask intervention and identification of respiratory virus infection. Nature Medicine | www.nature.com/naturemedicine
- 8. Brief Communication NATuRE MEDicinE Extended Data Fig. 2 | Weekly number of respiratory virus infections identified by RT-PCR in symptomatic individuals who had provided exhaled breath samples (respiratory droplets and aerosols) during the study period. Blue, coronavirus; red, influenza virus; yellow, rhinovirus; green, other respiratory viruses including human metapneumovirus, parainfluenza virus, respiratory syncytial virus and adenovirus; white, no respiratory virus infection identified. Nature Medicine | www.nature.com/naturemedicine
- 9. Brief CommunicationNATuRE MEDicinE Extended Data Fig. 3 | Respiratory virus shedding in (a) nasal swab, (b) throat swab, (c) respiratory droplets and (d) aerosols in symptomatic individuals with coronavirus NL63, coronavirus OC43, coronavirus HKU1, influenza A and influenza B virus infection. For nasal swabs and throat swabs, all infected individuals identified by RT-PCR in any collected samples were included: coronavirus NL63 (n = 8), coronavirus OC43 (n = 5), coronavirus HKU1 (n = 4), influenza A virus (n = 31) and influenza B virus (n = 14). For respiratory droplets and aerosols, only infected individuals who provided exhaled breath samples while not wearing a surgical face mask were included: coronavirus NL63 (n = 3), coronavirus OC43 (n = 3), coronavirus HKU1 (n = 4), influenza A virus (n = 19) and influenza B virus (n = 6). The box plots indicate the median with the interquartile range (lower and upper hinge) and ± 1.5 × interquartile range from the first and third quartile (lower and upper whisker). Dark blue, coronavirus NL63; light blue, coronavirus OC43; brown, coronavirus HKU1; red, influenza A virus; orange, influenza B virus. Nature Medicine | www.nature.com/naturemedicine
- 10. Brief Communication NATuRE MEDicinE Extended Data Fig. 4 | See next page for caption. Nature Medicine | www.nature.com/naturemedicine
- 11. Brief CommunicationNATuRE MEDicinE Extended Data Fig. 4 | Efficacy of surgical face masks in reducing respiratory virus shedding in respiratory droplets and aerosols of symptomatic individuals with seasonal coronaviruses including (a) coronavirus NL63, (b) coronavirus OC43 and (c) coronavirus HKU1. The figure shows the virus copies per sample collected in nasal swab (red), throat swab (blue), respiratory droplets collected for 30 min while not wearing (dark green) or wearing (light green) a surgical face mask and aerosols collected for 30 min while not wearing (brown) or wearing (orange) a face mask, collected from individuals with acute respiratory symptoms who were positive for coronavirus NL63, coronavirus OC43 and coronavirus HKU1 as determined by RT-PCR in any samples. P values for mask intervention as predictor of log10 virus copies per sample in an unadjusted univariate Tobit regression model which allowed for censoring at the lower limit of detection of the RT-PCR assay are shown, with significant differences in bold. For nasal swabs and throat swabs, all infected individuals were included (coronavirus NL63, n = 8; coronavirus OC43, n = 5; coronavirus HKU1, n = 4). For respiratory droplets and aerosols, numbers of infected individuals who provided exhaled breath samples while not wearing or wearing a surgical face mask, respectively were: coronavirus NL63 (n = 3 and 5), coronavirus OC43 (n = 3 and 4), coronavirus HKU1 (n = 4 and 2). A subset of participants provided exhaled breath samples for both mask interventions (coronavirus NL63, n = 0; coronavirus OC43, n = 2; coronavirus HKU1, n = 2). Nature Medicine | www.nature.com/naturemedicine
- 12. Brief Communication NATuRE MEDicinE Extended Data Fig. 5 | Efficacy of surgical face masks in reducing respiratory virus shedding in respiratory droplets and aerosols of symptomatic individuals with seasonal influenza viruses including (a) influenza A and (b) influenza B virus. The figure shows the virus copies per sample collected in nasal swab (red), throat swab (blue), respiratory droplets collected for 30 min while not wearing (dark green) or wearing (light green) a surgical face mask and aerosols collected for 30 min while not wearing (brown) or wearing (orange) a face mask, collected from individuals with acute respiratory symptoms who were positive for influenza A and influenza B virus as determined by RT-PCR in any samples. P values for mask intervention as predictor of log10 virus copies per sample in an unadjusted univariate Tobit regression model which allowed for censoring at the lower limit of detection of the RT-PCR assay are shown, with significant differences in bold. For nasal swabs and throat swabs, all infected individuals were included (influenza A virus, n = 31; influenza B virus, n = 14). For respiratory droplets and aerosols, numbers of infected individuals who provided exhaled breath samples while not wearing or wearing a surgical face mask, respectively were: influenza A virus (n = 19 and 19), influenza B virus (n = 6 and 10). A subset of participants provided exhaled breath samples for both mask interventions (influenza A virus, n = 7; influenza B virus, n = 2). Nature Medicine | www.nature.com/naturemedicine
- 13. Brief CommunicationNATuRE MEDicinE Extended Data Fig. 6 | Correlation of coronavirus viral shedding between different samples (nasal swab, throat swab, respiratory droplets and aerosols) in symptomatic individuals with seasonal coronavirus infection. For nasal swabs and throat swabs, all infected individuals were included (n = 17). For respiratory droplets and aerosols, only infected individuals who provided exhaled breath samples while not wearing a surgical face mask were included (n = 10). r, the Spearman’s rank correlation coefficient. Nature Medicine | www.nature.com/naturemedicine
- 14. Brief Communication NATuRE MEDicinE Extended Data Fig. 7 | Correlation of influenza viral shedding between different samples (nasal swab, throat swab, respiratory droplets and aerosols) in symptomatic individuals with seasonal influenza infection. For nasal swabs and throat swabs, all infected individuals were included (n = 43). For respiratory droplets and aerosols, only infected individuals who provided exhaled breath samples while not wearing a surgical face mask were included (n = 23). r, the Spearman’s rank correlation coefficient. Nature Medicine | www.nature.com/naturemedicine
- 15. Brief CommunicationNATuRE MEDicinE Extended Data Fig. 8 | Correlation of rhinovirus viral shedding between different samples (nasal swab, throat swab, respiratory droplets and aerosols) in symptomatic individuals with rhinovirus infection. For nasal swabs and throat swabs, all infected individuals were included (n = 54). For respiratory droplets and aerosols, only infected individuals who provided exhaled breath samples while not wearing a surgical face mask were included (n = 36). r, the Spearman’s rank correlation coefficient. Nature Medicine | www.nature.com/naturemedicine
- 16. Brief Communication NATuRE MEDicinE Extended Data Fig. 9 | See next page for caption. Nature Medicine | www.nature.com/naturemedicine
- 17. Brief CommunicationNATuRE MEDicinE Extended Data Fig. 9 | Respiratory virus shedding in respiratory droplets and aerosols stratified by days from symptom onset for (a) coronavirus, (b) influenza virus or (c) rhinovirus. The figures shows the virus copies per sample collected in nasal swab (red), throat swab (blue), respiratory droplets (dark green) and aerosols (brown) collected for 30 min while not wearing a surgical face mask, stratified by the number of days from symptom onset on which the respiratory droplets and aerosols were collected. For nasal swabs and throat swabs, all infected individuals were included (coronavirus, n = 17; influenza virus, n = 43; rhinovirus, n = 54). For respiratory droplets and aerosols, numbers of infected individuals who provided exhaled breath samples while not wearing or wearing a surgical face mask, respectively were: coronavirus (n = 10 and 11), influenza virus (n = 23 and 28), rhinovirus (n = 36 and 32). A subset of participants provided exhaled breath samples for both mask interventions (coronavirus, n = 4; influenza virus, n = 8; rhinovirus, n = 14). The box plots indicate the median with the interquartile range (lower and upper hinge) and ± 1.5 × interquartile range from the first and third quartile (lower and upper whisker). Nature Medicine | www.nature.com/naturemedicine
- 18. 1 natureresearch|reportingsummaryOctober2018 Corresponding author(s): Benjamin John Cowling Last updated by author(s): Mar 4, 2020 Reporting Summary Nature Research wishes to improve the reproducibility of the work that we publish. This form provides structure for consistency and transparency in reporting. For further information on Nature Research policies, see Authors & Referees and the Editorial Policy Checklist. Statistics For all statistical analyses, confirm that the following items are present in the figure legend, table legend, main text, or Methods section. n/a Confirmed The exact sample size (n) for each experimental group/condition, given as a discrete number and unit of measurement A statement on whether measurements were taken from distinct samples or whether the same sample was measured repeatedly The statistical test(s) used AND whether they are one- or two-sided Only common tests should be described solely by name; describe more complex techniques in the Methods section. A description of all covariates tested A description of any assumptions or corrections, such as tests of normality and adjustment for multiple comparisons A full description of the statistical parameters including central tendency (e.g. means) or other basic estimates (e.g. regression coefficient) AND variation (e.g. standard deviation) or associated estimates of uncertainty (e.g. confidence intervals) For null hypothesis testing, the test statistic (e.g. F, t, r) with confidence intervals, effect sizes, degrees of freedom and P value noted Give P values as exact values whenever suitable. For Bayesian analysis, information on the choice of priors and Markov chain Monte Carlo settings For hierarchical and complex designs, identification of the appropriate level for tests and full reporting of outcomes Estimates of effect sizes (e.g. Cohen's d, Pearson's r), indicating how they were calculated Our web collection on statistics for biologists contains articles on many of the points above. Software and code Policy information about availability of computer code Data collection No software was used. Data analysis All analyses were conducted with R version 3.6.0 and the VGAM package 1.1.1. For manuscripts utilizing custom algorithms or software that are central to the research but not yet described in published literature, software must be made available to editors/reviewers. We strongly encourage code deposition in a community repository (e.g. GitHub). See the Nature Research guidelines for submitting code & software for further information. Data Policy information about availability of data All manuscripts must include a data availability statement. This statement should provide the following information, where applicable: - Accession codes, unique identifiers, or web links for publicly available datasets - A list of figures that have associated raw data - A description of any restrictions on data availability Anonymized raw data and R syntax to reproduce all the analyses, figures, tables and supplementary tables in the published article are available at: [Dryad link pending]. Field-specific reporting Please select the one below that is the best fit for your research. If you are not sure, read the appropriate sections before making your selection. Life sciences Behavioural & social sciences Ecological, evolutionary & environmental sciences
- 19. 2 natureresearch|reportingsummaryOctober2018 For a reference copy of the document with all sections, see nature.com/documents/nr-reporting-summary-flat.pdf Life sciences study design All studies must disclose on these points even when the disclosure is negative. Sample size We estimated a priori the sample size to be 300 participants. The primary outcome of the study was the reduction in the exhaled virus concentration of normal tidal breathing by wearing face mask in terms of total virus by RT-PCR as a proxy for infectious virus particle. We expected that a 1-log reduction in exhaled virus particle by face mask intervention would have a clinically relevant effect in reducing the probability of transmission. Except for influenza, there was no quantitative data available from exhaled breath samples from respiratory virus- infected individuals before the present study. If the standard deviation of exhaled virus concentration was 1 log copies/ml (Milton et al., PLoS Pathog 2013), we would detect a difference of >1 log copies/ml in the mask vs control group as long as we have >15 participants with a specific respiratory virus. For example, if our study included 23 participants with rhinovirus detectable in exhaled breath without a mask, we will have 80% power and 0.05 significance level to identify differences in viral shedding in aerosols of 1.28 log10 copies associated with the use of face masks, assuming a standard deviation of 1.54 log10 copies based on data from nasal and throat swab (Lu et al., J Clin Microbiol 2008). We expected from 300 individuals with ARI, at least 150 to have a respiratory virus, and at least 20-30 to have each of rhinovirus, coronavirus, adenovirus and parainfluenza plus small numbers of other respiratory viruses, assuming the Viral Panel would detect respiratory viruses in 60% of participants including 10% by influenza (since we partly recruited during the influenza seasons) and the other 50% made up of rhinovirus, coronavirus, adenovirus and parainfluenza virus. Data exclusions As described in the Results section and Supplementary Figure 1, only participants who provided exhaled breath samples and randomized to mask intervention were included; and final analyses were performed only for participants with either coronavirus, influenza virus or rhinovirus infection, which had sufficient sample size for comparison between mask intervention. Replication Samples from a subset of participants identified with a coronavirus, influenza or rhinovirus infection were re-tested by RT-PCR with consistent results. R syntax is available to reproduce all the analyses, figures, tables and supplementary tables in the published article. Randomization Prior to the exhaled breath collection, each participant was randomly allocated in a 1:1 ratio to either wearing a surgical face mask or not during the exhaled breath collection using a computer-generated sequence. The allocation was concealed to the study stuff performing the exhaled breath collection before allocation of the mask intervention. Blinding Blinding to the participant and the study stuff for the mask intervention was not possible. The study staff performing the statistical analyses was also involved in the data collection. We expected there would be minimal bias due to unblinding since data collection for questionnaires was done before randomization to mask intervention, and viral load from a sample measured by RT-PCR is an objective measurement. Reporting for specific materials, systems and methods We require information from authors about some types of materials, experimental systems and methods used in many studies. Here, indicate whether each material, system or method listed is relevant to your study. If you are not sure if a list item applies to your research, read the appropriate section before selecting a response. Materials & experimental systems n/a Involved in the study Antibodies Eukaryotic cell lines Palaeontology Animals and other organisms Human research participants Clinical data Methods n/a Involved in the study ChIP-seq Flow cytometry MRI-based neuroimaging Eukaryotic cell lines Policy information about cell lines Cell line source(s) Madin-Darby Canine Kidney (MDCK) cells Authentication European Collection of Authenticated Cell Cultures. Mycoplasma contamination We confirm that all cell lines tested negative for mycoplasma contamination. Commonly misidentified lines (See ICLAC register) Nil
- 20. 3 natureresearch|reportingsummaryOctober2018 Human research participants Policy information about studies involving human research participants Population characteristics As described in the Results section, Table 1a and Supplementary Table 1, there were some differences in characteristics of participants with the different viruses. Overall, most participants were younger adults and 5% were age 11-17 years, but there were more children with influenza virus and no children in the subgroup with coronavirus infection. Overall, 59% were female, but there were more females among the subgroup with coronavirus infection. The majority of participants did not have underlying medical conditions and overall 9% had received influenza vaccination for the current season but only 2% among those with influenza virus infection. The majority of participants were sampled within 24–48 or 48–72 hours of illness onset. 24% of participants had a measured fever ≥37.8ºC, with influenza patients more than twice as likely than coronavirus and rhinovirus- infected patients to have a measured fever. Coronavirus-infected participants coughed the most with an average of 17 (SD 30) coughs during the 30-minute exhaled breath collection. The profile of the participants randomized to with-mask vs without-mask groups were similar. Recruitment As described in the Methods section, participants were recruited year-round from March 2013 through May 2016 in a general outpatient clinic of a private hospital in Hong Kong. As routine practice, clinic staff screened all individuals attending the clinics for respiratory and any other symptoms regardless of the purpose of the visit at the triage. Study staff then approached immediately those who reported at least one of the following symptoms of acute respiratory illness (ARI) for further screening: fever≥37.8ºC, cough, sore throat, runny nose, headache, myalgia and phlegm. Individuals who reported ≥2 ARI symptoms, within 3 days of illness onset and ≥11 years of age were eligible to participate. Ethics oversight As described in the Methods section, the study protocol was approved by the Institutional Review Board of The University of Hong Kong and the Clinical and Research Ethics Committee of Hong Kong Baptist Hospital. Note that full information on the approval of the study protocol must also be provided in the manuscript. Clinical data Policy information about clinical studies All manuscripts should comply with the ICMJE guidelines for publication of clinical research and a completed CONSORT checklist must be included with all submissions. Clinical trial registration The present study was not registered in clinical trials registries, as it was a laboratory-based study of detection of viruses in exhaled breath and the effect of wearing surgical facemasks on virus detection. It was not a Phase II/III clinical trial. Study protocol Not available in clinical trials registries (as above). Study protocol will be made available to editors and peer reviewers if requested. Data collection As described in the Methods section, participants were recruited year-round from March 2013 through March 2016 in a general outpatient clinic of a private hospital in Hong Kong. Data collection for questionnaires and exhaled breath sample collection was done face-to-face with the participant by trained study staff at the same clinic on the day of participant enrolment. Outcomes As pre-specified in the study protocol, the primary outcomes of the study were the virus generation rate in the tidal breathing of participants infected by different respiratory viruses, and the efficacy of face mask in preventing virus dissemination in exhaled breath especially at the aerosol fraction. As pre-specified in the study protocol, one of the secondary outcomes was to provide indirect evidence for relative importance of different transmission routes of influenza and other respiratory viruses. In this regard, in the present manuscript we examined the correlation between viral shedding in nose swabs, throat swabs, respiratory droplets and aerosols, and factors affecting viral shedding in respiratory droplets and aerosols. As described in the Discussion section in the present manuscript about the limitation of our study, there was large proportion of participants with undetectable viral shedding in exhaled breath for each of the viruses studied, and therefore we were unable to examine the exhaled respiratory virus reduction proportion by chi-squared test, nor the exhaled respiratory virus reduction volume (i.e. viral load) by t-test and linear regression as pre-specified in the study protocol. Instead, we have used Fisher’s exact test and Tobit regression for the same purposes respectively.