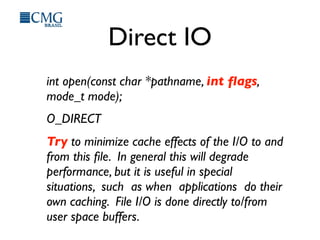
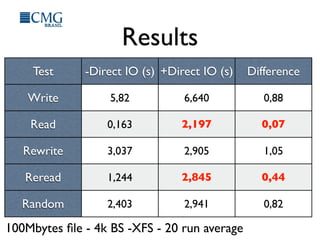
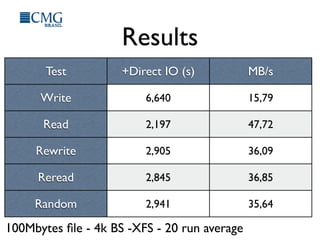
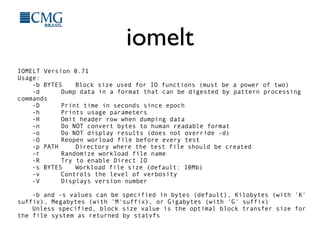
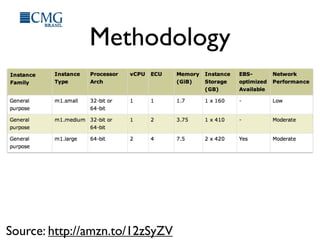
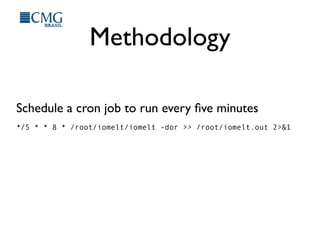
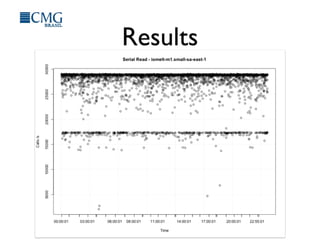
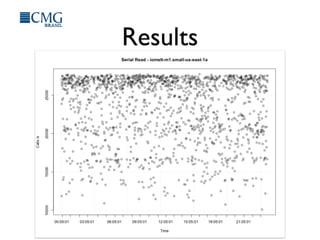
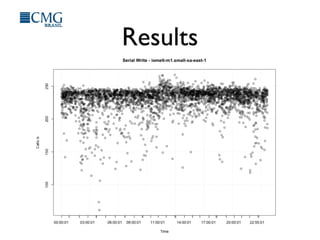
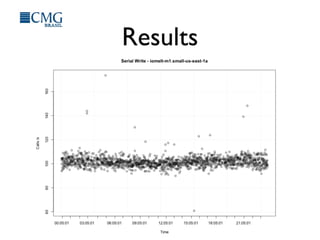
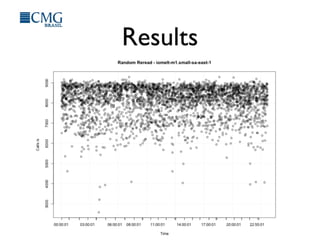
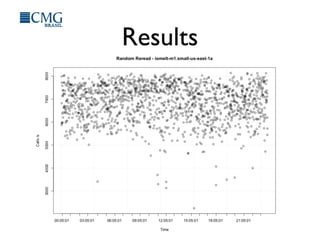
Disk IO Benchmarking in
shared multi-tenant
environments
Rodrigo Campos
camposr@gmail.com - @xinu
Agenda
• Considerations about IO performance
benchmarks
• Some available tools
• Problems
• Proposed solution & results
• Conclusions
Considerations
How most people think it is...
Process
Disk
Considerations
Private / single-tenant system
Process
Disk
Kernel IO Interface
Disk Controller Disk Controller Disk Controller
DiskDisk
Considerations
Private / single-tenant system
Process
Disk
Kernel IO Interface
Disk Controller Disk Controller Disk Controller
DiskDisk
Cache
Cache
Cache
Considerations
Shared multi-
tenant system
(simplified view)
Caches... Caches
Everywhere
Process Kernel
Virtualization
Layer
KernelNetwork Interface
Process
Kernel
IO Interface
Disk Controller
Process
Kernel
IO Interface
Disk Controller
Process
Kernel
IO Interface
Disk Controller
Process Kernel
Process Kernel
Disk Disk Disk
Disk Controller
SSD
Disk
Controller
Disk
Disk
Controller
Disk
• Linux Buffers & Caches
• Buffers: Filesystem Metadata + Active in-flight pages
• Caches: File contents
• Kernel Tunables (pdflush)
• /proc/sys/vm/...
Some available tools
• Too many to name but some are popular:
• iozone, fio, dd, hdparm, bonnie++
• http://bitly.com/bundles/o_4p62vc3lid/4
Problems
Most published benchmarks measured the environment
only once, at a single point in time!
Problems
Some tools have become so complex that is now almost
impossible to reproduce results consistently
Proposed solution
• Create a simple yet effective tool to
measure performance
• Define a reproducible methodology for
long-term testing
Language
• Need for access to low-
level system calls
• Low abstraction level
• Choice: C
Requisites
•Keep it simple!
• One process
• One thread
• One workload file
What it does?
• Serial Write
• Serial Read
• Random Rewrite
• Random Read
• Mixed Random Read & Write
Mitigating buffers
• It is impossible to avoid buffering at all
levels in a non-proprietary system
• But we can use posix_fadvise & Direct IO
to mitigate local kernel buffers
posix_fadvise
int posix_fadvise(int fd, off_t offset, off_t len, int
advice);
“Programs can use posix_fadvise() to
announce an intention to access file data in a
specific pattern in the future, thus allowing the
kernel to perform appropriate optimizations.”
posix_fadvise
POSIX_FADV_DONTNEED attempts to free
cached pages associated with the specified
region.
posix_fadvise
/* *TRY* to minimize buffer cache effect */
/* There's no guarantee that the file will be
removed from buffer cache though */
/* Keep in mind that buffering will happen at
some level */
if (fadvise == true)
{
rc = posix_fadvise(fd, 0, 0,
POSIX_FADV_DONTNEED);
...
posix_fadvise
Test DONTNEED NORMAL Difference
Write
Read
Rewrite
Reread
Random
5,82 6,05 0,96
0,163 0,017 9,59
3,037 2,993 1,01
1,244 0,019 65,47
2,403 1,559 1,54
100Mbytes file - 4k BS -XFS - 20 run average
posix_fadvise
Test DONTNEED NORMAL Difference
Write
Read
Rewrite
Reread
Random
5,82 6,05 0,96
0,163 0,017 9,59
3,037 2,993 1,01
1,244 0,019 65,47
2,403 1,559 1,54
100Mbytes file - 4k BS -XFS - 20 run average
6,0 GB/s
5,2 GB/s
Transfer Rates
• SSD transfer rates typically range from
100MB/s to 600MB/s
• Something is wrong...
Synchronous IO
int open(const char *pathname, int flags,
mode_t mode);
O_SYNC
The file is opened for synchronous I/O. Any
write(2)s on the resulting file descriptor will
block the calling process until the data has been
physically written to the underlying hardware.
But see NOTES below.
Direct IO
int open(const char *pathname, int flags,
mode_t mode);
O_DIRECT
Try to minimize cache effects of the I/O to and
from this file. In general this will degrade
performance, but it is useful in special
situations, such as when applications do their
own caching. File I/O is done directly to/from
user space buffers.
Direct IO
flags = O_RDWR | O_CREAT | O_TRUNC | O_SYNC;
if (directIO == true)
{
myWarn(3,__FUNCTION__, "Will try to enable
Direct IO");
flags = flags| O_DIRECT;
}
Notes below
Most Linux file systems don't actually
implement the POSIX O_SYNC semantics,
which require all metadata updates of a write to
be on disk on returning to userspace, but only
the O_DSYNC semantics, which require only
actual file data and meta-data necessary to
retrieve it to be on disk by the time the system
call returns.
Results
Test -Direct IO (s) +Direct IO (s) Difference
Write
Read
Rewrite
Reread
Random
5,82 6,640 0,88
0,163 2,197 0,07
3,037 2,905 1,05
1,244 2,845 0,44
2,403 2,941 0,82
100Mbytes file - 4k BS -XFS - 20 run average
Results
Test +Direct IO (s) MB/s
Write
Read
Rewrite
Reread
Random
6,640 15,79
2,197 47,72
2,905 36,09
2,845 36,85
2,941 35,64
100Mbytes file - 4k BS -XFS - 20 run average
iomelt
IOMELT Version 0.71
Usage:
-b BYTES Block size used for IO functions (must be a power of two)
-d Dump data in a format that can be digested by pattern processing
commands
-D Print time in seconds since epoch
-h Prints usage parameters
-H Omit header row when dumping data
-n Do NOT convert bytes to human readable format
-o Do NOT display results (does not override -d)
-O Reopen worload file before every test
-p PATH Directory where the test file should be created
-r Randomize workload file name
-R Try to enable Direct IO
-s BYTES Workload file size (default: 10Mb)
-v Controls the level of verbosity
-V Displays version number
-b and -s values can be specified in bytes (default), Kilobytes (with 'K'
suffix), Megabytes (with 'M'suffix), or Gigabytes (with 'G' suffix)
Unless specified, block size value is the optimal block transfer size for
the file system as returned by statvfs
iomelt
• Available at http://iomelt.com
• Fork it on GitHub:
• https://github.com/camposr/iomelt
• Artistic License 2.0
• http://opensource.org/licenses/artistic-license-2.0
Methodology
How to measure the performance of
several instance types on different
regions for long periods of time?
Methodology
1. Create a single AMI
1.1.Update Kernel, compiler and libraries
2. Replicate it in several regions and different
instance types:
2.1.m1.small
2.2.m1.medium
2.3.m1.large
Methodology
Source: http://amzn.to/12zSyZV
Methodology
Schedule a cron job to run every five minutes
*/5 * * 8 * /root/iomelt/iomelt -dor >> /root/iomelt.out 2>&1
Results
Results
Results
Results
Results
Results
Results
For a complete list of results:
http://bit.ly/19L9xm2
Conclusions
• Shared multi-tenant environments create
new challenges for performance analysis
• Traditional benchmark methodologies are
not suitable for these environments
• Excessive versatility in most available tools
make it hard to get reproducible
measurements
Conclusions
• Performance (in)consistency must be
considered when designing systems that
will run in the cloud
• “What you don’t know might hurt you”

Disk IO Benchmarking in shared multi-tenant environments

  • 1.
    Disk IO Benchmarkingin shared multi-tenant environments Rodrigo Campos camposr@gmail.com - @xinu
  • 2.
    Agenda • Considerations aboutIO performance benchmarks • Some available tools • Problems • Proposed solution & results • Conclusions
  • 3.
    Considerations How most peoplethink it is... Process Disk
  • 4.
    Considerations Private / single-tenantsystem Process Disk Kernel IO Interface Disk Controller Disk Controller Disk Controller DiskDisk
  • 5.
    Considerations Private / single-tenantsystem Process Disk Kernel IO Interface Disk Controller Disk Controller Disk Controller DiskDisk Cache Cache Cache
  • 6.
    Considerations Shared multi- tenant system (simplifiedview) Caches... Caches Everywhere Process Kernel Virtualization Layer KernelNetwork Interface Process Kernel IO Interface Disk Controller Process Kernel IO Interface Disk Controller Process Kernel IO Interface Disk Controller Process Kernel Process Kernel Disk Disk Disk Disk Controller SSD Disk Controller Disk Disk Controller Disk
  • 7.
    • Linux Buffers& Caches • Buffers: Filesystem Metadata + Active in-flight pages • Caches: File contents
  • 8.
    • Kernel Tunables(pdflush) • /proc/sys/vm/...
  • 9.
    Some available tools •Too many to name but some are popular: • iozone, fio, dd, hdparm, bonnie++ • http://bitly.com/bundles/o_4p62vc3lid/4
  • 10.
    Problems Most published benchmarksmeasured the environment only once, at a single point in time!
  • 11.
    Problems Some tools havebecome so complex that is now almost impossible to reproduce results consistently
  • 12.
    Proposed solution • Createa simple yet effective tool to measure performance • Define a reproducible methodology for long-term testing
  • 13.
    Language • Need foraccess to low- level system calls • Low abstraction level • Choice: C
  • 14.
    Requisites •Keep it simple! •One process • One thread • One workload file
  • 15.
    What it does? •Serial Write • Serial Read • Random Rewrite • Random Read • Mixed Random Read & Write
  • 16.
    Mitigating buffers • Itis impossible to avoid buffering at all levels in a non-proprietary system • But we can use posix_fadvise & Direct IO to mitigate local kernel buffers
  • 17.
    posix_fadvise int posix_fadvise(int fd,off_t offset, off_t len, int advice); “Programs can use posix_fadvise() to announce an intention to access file data in a specific pattern in the future, thus allowing the kernel to perform appropriate optimizations.”
  • 18.
    posix_fadvise POSIX_FADV_DONTNEED attempts tofree cached pages associated with the specified region.
  • 19.
    posix_fadvise /* *TRY* tominimize buffer cache effect */ /* There's no guarantee that the file will be removed from buffer cache though */ /* Keep in mind that buffering will happen at some level */ if (fadvise == true) { rc = posix_fadvise(fd, 0, 0, POSIX_FADV_DONTNEED); ...
  • 20.
    posix_fadvise Test DONTNEED NORMALDifference Write Read Rewrite Reread Random 5,82 6,05 0,96 0,163 0,017 9,59 3,037 2,993 1,01 1,244 0,019 65,47 2,403 1,559 1,54 100Mbytes file - 4k BS -XFS - 20 run average
  • 21.
    posix_fadvise Test DONTNEED NORMALDifference Write Read Rewrite Reread Random 5,82 6,05 0,96 0,163 0,017 9,59 3,037 2,993 1,01 1,244 0,019 65,47 2,403 1,559 1,54 100Mbytes file - 4k BS -XFS - 20 run average 6,0 GB/s 5,2 GB/s
  • 22.
    Transfer Rates • SSDtransfer rates typically range from 100MB/s to 600MB/s • Something is wrong...
  • 23.
    Synchronous IO int open(constchar *pathname, int flags, mode_t mode); O_SYNC The file is opened for synchronous I/O. Any write(2)s on the resulting file descriptor will block the calling process until the data has been physically written to the underlying hardware. But see NOTES below.
  • 24.
    Direct IO int open(constchar *pathname, int flags, mode_t mode); O_DIRECT Try to minimize cache effects of the I/O to and from this file. In general this will degrade performance, but it is useful in special situations, such as when applications do their own caching. File I/O is done directly to/from user space buffers.
  • 25.
    Direct IO flags =O_RDWR | O_CREAT | O_TRUNC | O_SYNC; if (directIO == true) { myWarn(3,__FUNCTION__, "Will try to enable Direct IO"); flags = flags| O_DIRECT; }
  • 26.
    Notes below Most Linuxfile systems don't actually implement the POSIX O_SYNC semantics, which require all metadata updates of a write to be on disk on returning to userspace, but only the O_DSYNC semantics, which require only actual file data and meta-data necessary to retrieve it to be on disk by the time the system call returns.
  • 27.
    Results Test -Direct IO(s) +Direct IO (s) Difference Write Read Rewrite Reread Random 5,82 6,640 0,88 0,163 2,197 0,07 3,037 2,905 1,05 1,244 2,845 0,44 2,403 2,941 0,82 100Mbytes file - 4k BS -XFS - 20 run average
  • 28.
    Results Test +Direct IO(s) MB/s Write Read Rewrite Reread Random 6,640 15,79 2,197 47,72 2,905 36,09 2,845 36,85 2,941 35,64 100Mbytes file - 4k BS -XFS - 20 run average
  • 29.
    iomelt IOMELT Version 0.71 Usage: -bBYTES Block size used for IO functions (must be a power of two) -d Dump data in a format that can be digested by pattern processing commands -D Print time in seconds since epoch -h Prints usage parameters -H Omit header row when dumping data -n Do NOT convert bytes to human readable format -o Do NOT display results (does not override -d) -O Reopen worload file before every test -p PATH Directory where the test file should be created -r Randomize workload file name -R Try to enable Direct IO -s BYTES Workload file size (default: 10Mb) -v Controls the level of verbosity -V Displays version number -b and -s values can be specified in bytes (default), Kilobytes (with 'K' suffix), Megabytes (with 'M'suffix), or Gigabytes (with 'G' suffix) Unless specified, block size value is the optimal block transfer size for the file system as returned by statvfs
  • 30.
    iomelt • Available athttp://iomelt.com • Fork it on GitHub: • https://github.com/camposr/iomelt • Artistic License 2.0 • http://opensource.org/licenses/artistic-license-2.0
  • 31.
    Methodology How to measurethe performance of several instance types on different regions for long periods of time?
  • 32.
    Methodology 1. Create asingle AMI 1.1.Update Kernel, compiler and libraries 2. Replicate it in several regions and different instance types: 2.1.m1.small 2.2.m1.medium 2.3.m1.large
  • 33.
  • 34.
    Methodology Schedule a cronjob to run every five minutes */5 * * 8 * /root/iomelt/iomelt -dor >> /root/iomelt.out 2>&1
  • 35.
  • 36.
  • 37.
  • 38.
  • 39.
  • 40.
  • 41.
    Results For a completelist of results: http://bit.ly/19L9xm2
  • 42.
    Conclusions • Shared multi-tenantenvironments create new challenges for performance analysis • Traditional benchmark methodologies are not suitable for these environments • Excessive versatility in most available tools make it hard to get reproducible measurements
  • 43.
    Conclusions • Performance (in)consistencymust be considered when designing systems that will run in the cloud • “What you don’t know might hurt you”