Download as PDF, PPTX


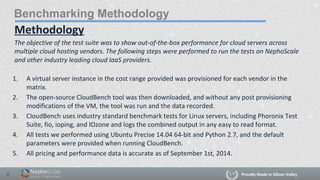
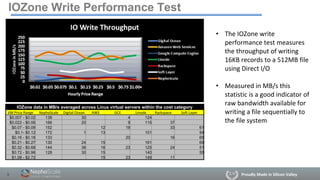
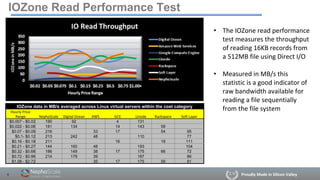
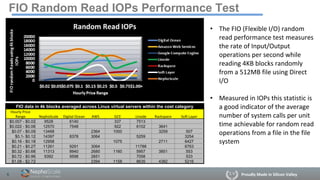
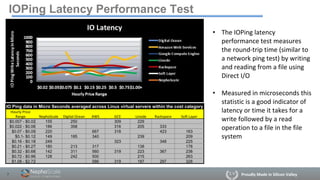
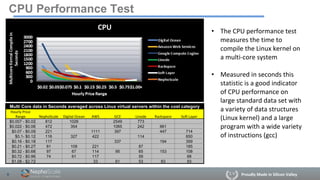
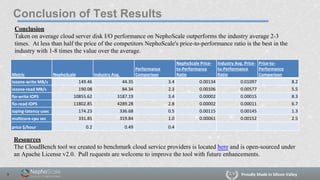

The document summarizes the results of a benchmarking test performed on NephoScale and other major cloud hosting providers using industry standard Linux performance tests. The tests measured disk and CPU performance across different price categories. On average, NephoScale outperformed competitors on disk performance metrics like IOzone and FIO by 2-3 times, while having a price-to-performance ratio that was 1-8 times better than industry averages, providing the best value. A conclusion states that NephoScale offers the best price-performance ratio in the industry for cloud servers.


![Oracle Open World 2014: Lies, Damned Lies, and I/O Statistics [ CON3671]](https://cdn.slidesharecdn.com/ss_thumbnails/thursday115ionfs-141107125307-conversion-gate02-thumbnail.jpg?width=640&height=640&fit=bounds)