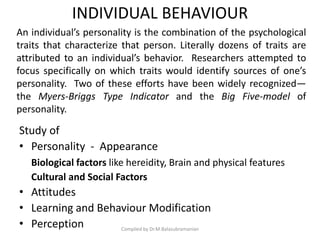
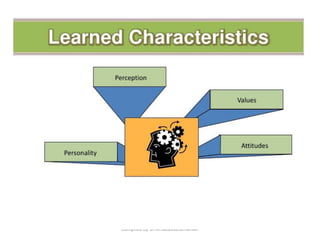
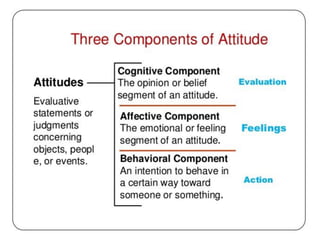
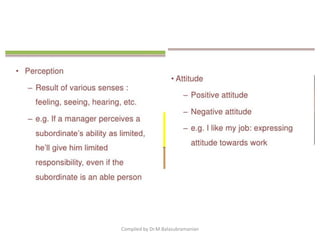
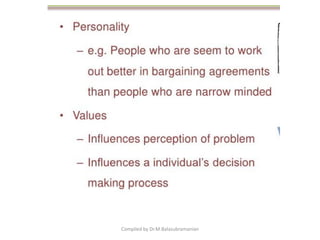
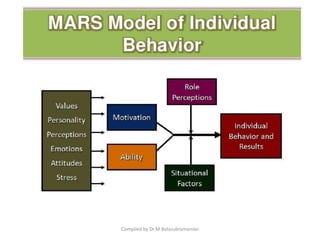
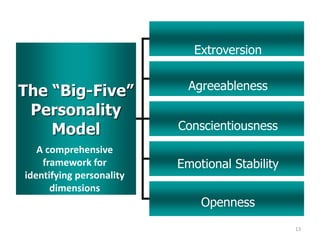
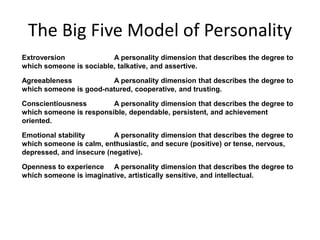
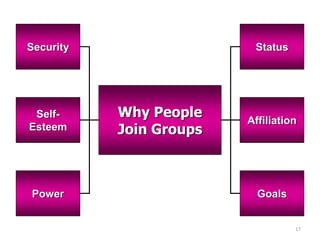
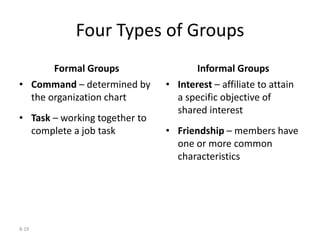
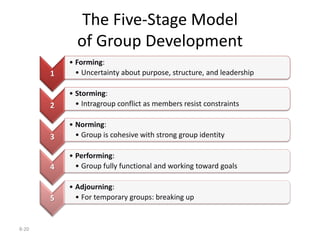
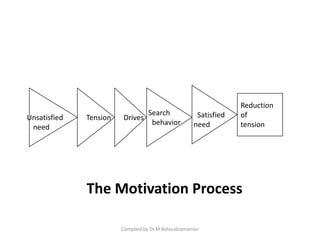
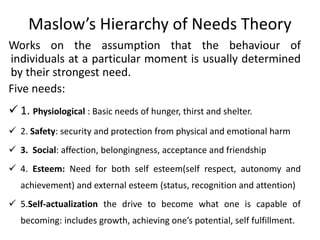
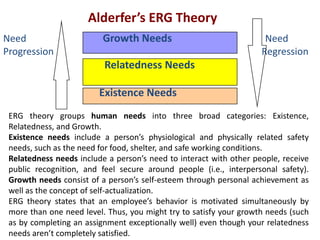
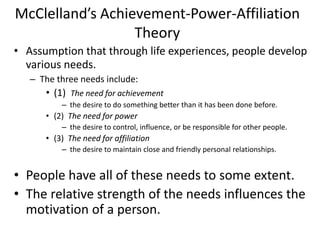
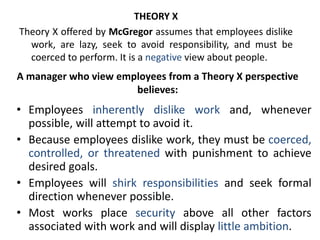
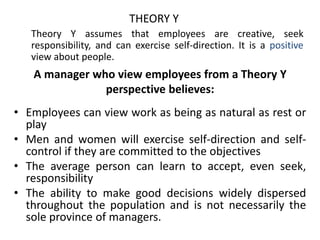
This document discusses various theories and models related to individual and group behavior in management. It begins by explaining factors that influence individual behavior such as personality, attitudes, learning, and perception. It then discusses the MARS model of individual behavior which considers motivation, abilities, role perceptions, and situational factors. Later, it covers cognitive dissonance theory and the Myers-Briggs Type Indicator and Big Five models for assessing personality traits. The document also examines foundations of group behavior including types of groups, stages of group development, and properties such as roles, norms, status, size, and cohesiveness. It concludes by summarizing several theories of motivation including Maslow's hierarchy of needs, ERG theory, and Her


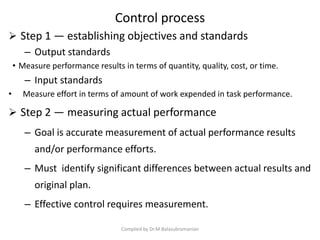
![PERT/CPM
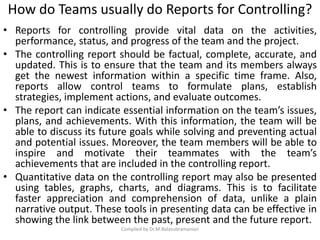
S.NO PERT CPM
1. The term PERT means Programme
evaluation and review technique
CPM means critical path
method
2 PERT is a probabilistic model CPM is a deterministic model
3 PERT model deals with uncertainty CPM model deals with
certainty
4 Time taken to complete the project
is highly uncertain
Time taken to complete the
project is certain
5 There are three types of time
estimates .They are pessimistic ,
optimistic and most likely time .
te=[ tp+4tm+to/6]
There is only one time assigned
.](https://image.slidesharecdn.com/directing-170424145412/85/Directing-as-a-function-of-Management-125-320.jpg)


![Chapter2[2]](https://cdn.slidesharecdn.com/ss_thumbnails/chapter22-120815082010-phpapp02-thumbnail.jpg?width=640&height=640&fit=bounds)


