This document summarizes a study analyzing local climate change in Rio Branco, Brazil due to deforestation. The researchers used Landsat thermal band data and a land cover classification map to model temperature anomalies as distance from forest increases. They found some relationship between distance and temperature anomalies, but the direction and amount were not uniform, warranting further inquiry. The study aimed to test whether deforested areas have higher temperatures than forested areas when correcting for elevation differences.
Dr Jerome O Connell - presentation made at various conferences throughout Europe as part of PhD which was funded by the EPA under the STRIVE Research Programme 2007-2013 (2007-PhD-ET-2)
Improving scientific graphics of climate (change) dataZachary Labe
Creating visuals of data is a critical part of our jobs as scientists. We use figures for journal publications, presentations, posters, and science communication. This week we'll discuss a framework for making better figures, particularly in the climate sciences. I will also give examples of what not to do, and how we can improve these figures moving forward. e
Climate Signals in CESM1 Single-Forcing Large Ensembles Revealed by Explainab...Zachary Labe
26th Annual CESM Workshop - Machine Learning: CESM-Related Efforts
In this study, we use an explainable artificial intelligence met hod to identify climate signals that are found in a new set of single-forcing large ensembles from CESM1. To compare patterns between simulations, we adopt an artificial neural network (ANN) that predicts the year from input maps of near-surface temperature. We find that the North Atlantic Ocean is an important region for the ANN to make its prediction, especially for the simulation forced without time-evolving industrial aerosols.
Interannual and decadal variations of Antarctic ice shelves using multi-mission satellite radar altimetry, and links with oceanic and atmospheric forcings
Surface and soil moisture monitoring, estimations, variations, and retrievalsJenkins Macedo
This presentation explored five leading articles in the remotely sensed and in situ surface and soil moisture monitoring, estimations, variations, and retrievals for global environmental change. The presentation gives insight to the purpose of each study, subjects of investigations, methods used to collect and analyze data sets, results and implications, and conclusions. This project is in fulfillment of the course on remote sensing for global environmental change and precedes our preview on water resources monitoring. This project was conducted by Christina Geller, 5th year accelerated graduate student in Geographic Information Systems for Development, and Environment and Jenkins Macedo, 2nd year graduate students in Environmental Science and Policy at the Department of International Development, Community, and Environment (IDCE) at Clark University. All academic materials used in this study were appropriately referenced (see bibliography for details).
Listed are few questions related to the content, process, and structure for each paper explored in this presentation and the questions are meant to facilitate in-class discussions. Discussions were facilitated by Richard Maclean and Jenkins Macedo.
This a presentation for Wireless Sensor Network WSN application. The work described in this presentation is one of the successful implementation of WSN. The paper is readily available online.
Using explainable machine learning to evaluate climate change projectionsZachary Labe
5 October 2023…
Atmosphere and Ocean Climate Dynamics Seminar (Presentation): Using explainable machine learning to evaluate climate change projections, Yale University, New Haven, CT. Remote Presentation.
References...
Labe, Z.M., E.A. Barnes, and J.W. Hurrell (2023). Identifying the regional emergence of climate patterns in the ARISE-SAI-1.5 simulations. Environmental Research Letters, DOI:10.1088/1748-9326/acc81a, https://iopscience.iop.org/article/10.1088/1748-9326/acc81a
Transcript: Selling digital books in 2024: Insights from industry leaders - T...BookNet Canada
The publishing industry has been selling digital audiobooks and ebooks for over a decade and has found its groove. What’s changed? What has stayed the same? Where do we go from here? Join a group of leading sales peers from across the industry for a conversation about the lessons learned since the popularization of digital books, best practices, digital book supply chain management, and more.
Link to video recording: https://bnctechforum.ca/sessions/selling-digital-books-in-2024-insights-from-industry-leaders/
Presented by BookNet Canada on May 28, 2024, with support from the Department of Canadian Heritage.
UiPath Test Automation using UiPath Test Suite series, part 3DianaGray10
Welcome to UiPath Test Automation using UiPath Test Suite series part 3. In this session, we will cover desktop automation along with UI automation.
Topics covered:
UI automation Introduction,
UI automation Sample
Desktop automation flow
Pradeep Chinnala, Senior Consultant Automation Developer @WonderBotz and UiPath MVP
Deepak Rai, Automation Practice Lead, Boundaryless Group and UiPath MVP
Essentials of Automations: Optimizing FME Workflows with ParametersSafe Software
Are you looking to streamline your workflows and boost your projects’ efficiency? Do you find yourself searching for ways to add flexibility and control over your FME workflows? If so, you’re in the right place.
Join us for an insightful dive into the world of FME parameters, a critical element in optimizing workflow efficiency. This webinar marks the beginning of our three-part “Essentials of Automation” series. This first webinar is designed to equip you with the knowledge and skills to utilize parameters effectively: enhancing the flexibility, maintainability, and user control of your FME projects.
Here’s what you’ll gain:
- Essentials of FME Parameters: Understand the pivotal role of parameters, including Reader/Writer, Transformer, User, and FME Flow categories. Discover how they are the key to unlocking automation and optimization within your workflows.
- Practical Applications in FME Form: Delve into key user parameter types including choice, connections, and file URLs. Allow users to control how a workflow runs, making your workflows more reusable. Learn to import values and deliver the best user experience for your workflows while enhancing accuracy.
- Optimization Strategies in FME Flow: Explore the creation and strategic deployment of parameters in FME Flow, including the use of deployment and geometry parameters, to maximize workflow efficiency.
- Pro Tips for Success: Gain insights on parameterizing connections and leveraging new features like Conditional Visibility for clarity and simplicity.
We’ll wrap up with a glimpse into future webinars, followed by a Q&A session to address your specific questions surrounding this topic.
Don’t miss this opportunity to elevate your FME expertise and drive your projects to new heights of efficiency.
"Impact of front-end architecture on development cost", Viktor TurskyiFwdays
I have heard many times that architecture is not important for the front-end. Also, many times I have seen how developers implement features on the front-end just following the standard rules for a framework and think that this is enough to successfully launch the project, and then the project fails. How to prevent this and what approach to choose? I have launched dozens of complex projects and during the talk we will analyze which approaches have worked for me and which have not.
Search and Society: Reimagining Information Access for Radical FuturesBhaskar Mitra
The field of Information retrieval (IR) is currently undergoing a transformative shift, at least partly due to the emerging applications of generative AI to information access. In this talk, we will deliberate on the sociotechnical implications of generative AI for information access. We will argue that there is both a critical necessity and an exciting opportunity for the IR community to re-center our research agendas on societal needs while dismantling the artificial separation between the work on fairness, accountability, transparency, and ethics in IR and the rest of IR research. Instead of adopting a reactionary strategy of trying to mitigate potential social harms from emerging technologies, the community should aim to proactively set the research agenda for the kinds of systems we should build inspired by diverse explicitly stated sociotechnical imaginaries. The sociotechnical imaginaries that underpin the design and development of information access technologies needs to be explicitly articulated, and we need to develop theories of change in context of these diverse perspectives. Our guiding future imaginaries must be informed by other academic fields, such as democratic theory and critical theory, and should be co-developed with social science scholars, legal scholars, civil rights and social justice activists, and artists, among others.
Smart TV Buyer Insights Survey 2024 by 91mobiles.pdf91mobiles
91mobiles recently conducted a Smart TV Buyer Insights Survey in which we asked over 3,000 respondents about the TV they own, aspects they look at on a new TV, and their TV buying preferences.
Kubernetes & AI - Beauty and the Beast !?! @KCD Istanbul 2024Tobias Schneck
As AI technology is pushing into IT I was wondering myself, as an “infrastructure container kubernetes guy”, how get this fancy AI technology get managed from an infrastructure operational view? Is it possible to apply our lovely cloud native principals as well? What benefit’s both technologies could bring to each other?
Let me take this questions and provide you a short journey through existing deployment models and use cases for AI software. On practical examples, we discuss what cloud/on-premise strategy we may need for applying it to our own infrastructure to get it to work from an enterprise perspective. I want to give an overview about infrastructure requirements and technologies, what could be beneficial or limiting your AI use cases in an enterprise environment. An interactive Demo will give you some insides, what approaches I got already working for real.
Accelerate your Kubernetes clusters with Varnish CachingThijs Feryn
A presentation about the usage and availability of Varnish on Kubernetes. This talk explores the capabilities of Varnish caching and shows how to use the Varnish Helm chart to deploy it to Kubernetes.
This presentation was delivered at K8SUG Singapore. See https://feryn.eu/presentations/accelerate-your-kubernetes-clusters-with-varnish-caching-k8sug-singapore-28-2024 for more details.
FIDO Alliance Osaka Seminar: Passkeys at Amazon.pdf
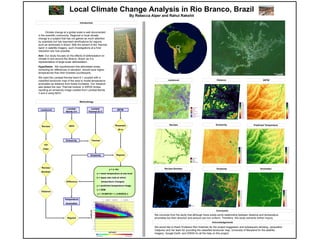
Effects of Deforestation
1. y = a +bx a = mean temperature at sea level b = lapse rate (rate at which temperature changes) y = predicted temperature image x = DEM y = 19.069720 + (- 0.004833) x Local Climate Change Analysis in Rio Branco, Brazil By Rebecca Alper and Rahul Rakshit Reclass Boolean Anomalies Greybody Reclass Predicted Temperature SRTM Distance Landcover Emissivity Introduction Conclusion Methodology Acknowledgements Climate change at a global scale is well documented in the scientific community. Regional or local climate change is a subject that has not gained as much attention by scientists but has important ramifications for regions such as rainforests in Brazil. With the advent of the ‘thermal band’ in satellite imagery, such investigations at a finer resolution are now possible. Aim: Our study focuses on the effects of deforestation on climate in and around Rio Branco, Brazil, as it is representative of large-scale deforestation. Hypothesis: We hypothesized that deforested areas, correcting for differences in elevation, should have higher temperatures than their forested counterparts. We used the Landsat thermal band 6.1 coupled with a classified landcover map of the area to model temperature anomalies as distance from forest increases. Our research also tested the new ‘Thermal module’ in IDRISI Andes, inputting an emissivity image created from Landsat Bands 3 and 4 using NDVI. We conclude from the study that although there exists some relationship between distance and temperature anomalies but their direction and amount are non uniform. Therefore, this study warrants further inquiry. We would like to thank Professor Ron Eastman for the project suggestion and subsequent advising, Jacqueline Vadjunec and her team for providing the classified landcover map, University of Maryland for the satellite imagery, Google Earth, and IDRISI for all the help on this project. Landcover Landsat Thermal (6.1) SRTM Difference 7X7 Filter Reclass Boolean Landsat Bands 3:4 NDVI Emissivity Thermal Greybody Resample 30 m Regress Distance Reclass Temperature Anomalies Regress ANOMALIES DISTANCE