Download to read offline
![temperature changes from simulations with estimated historical
changes in these factors: (i) combined human and natural ex-
ternal forcings (ALL); (ii) anthropogenic forcings only (ANT);
(iii) combined solar and volcanic forcing only (NAT); (iv) solar
forcing only (SOL); and (v) volcanic forcing only (VOL). We also
analyze integrations with the following: (vi) estimated changes
in solar and volcanic forcing over the past 1,000 y (P1000);
(vii) no changes in external influences (CTL); and (viii) 21st cen-
tury changes in greenhouse gases and anthropogenic aerosols (16)
specified according to Representative Concentration Pathway
8.5 (RCP8.5).
We compare simulation output with observed atmospheric
temperature changes inferred from satellite-based Microwave
Sounding Units (MSUs). Our focus is on zonally averaged
temperature changes for three broad layers of the atmosphere:
the lower stratosphere (TLS), the mid- to upper troposphere
(TMT), and the lower troposphere (TLT) (1). We use observa-
tional MSU information from two different groups: Remote
Sensing Systems (RSS) (17) and the University of Alabama at
Huntsville (UAH) (18). An important aspect of our fingerprint
study is its use of additional estimates of observational un-
certainty provided by the RSS group (17) (SI Appendix).
Two processing choices facilitate the comparison of models
and observations. First, we calculate synthetic MSU temper-
atures from CMIP-5 simulations, so that modeled and observed
layer-averaged temperatures are vertically weighted in a similar
way (10). Second, we splice together temperature information
from the ALL and RCP8.5 simulations. The latter are initiated
from the end of the ALL simulations, which was generally in
December 2005 (SI Appendix). Splicing makes it possible to
compare modeled and observed temperature changes over the
full observed satellite record. We refer to these spliced simu-
lations as “ALL+8.5.” (The ANT, NAT, VOL, and SOL inte-
grations also end in December 2005. Unlike the ALL simulation,
they cannot be spliced with RCP8.5 results without introducing
a discontinuity in forcing.)
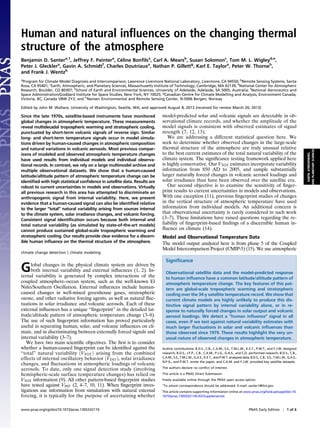
Global-Mean Temperature Changes
Fig. 1 shows the multimodel average changes in global-mean
atmospheric temperature in the NAT and ALL+8.5 simulations.
In both types of numerical experiment, the stratosphere warms
and the troposphere cools after major volcanic eruptions (1, 4–8,
19, 20). The abrupt TLS warming signals (Fig. 1A) are due to the
absorption of incoming solar radiation and outgoing long-wave
radiation by volcanic aerosols injected into the stratosphere (21).
Stratospheric volcanic aerosols also reduce the clear-sky solar
radiation received at Earth’s surface, leading to surface and
tropospheric cooling. Because of the large thermal inertia of the
oceanic mixed layer, the recovery of tropospheric temperature
from volcanically induced cooling can take up to a decade (Fig. 1
B and C). The removal of volcanic aerosols and the recovery of
lower stratospheric temperature is more rapid (∼2 y).
The ALL+8.5 simulations exhibit sustained cooling of the
lower stratosphere and warming of the troposphere over the past
60 y (Fig. 1). The decrease in TLS is primarily a response to
human-caused stratospheric ozone depletion, with a smaller
contribution from anthropogenic changes in other greenhouse
gases (GHGs) (19, 22, 23). Tropospheric warming is mainly driven
by anthropogenic GHG increases (1, 2, 8, 23, 24). In contrast, the
NAT runs do not produce large, multidecadal temperature changes
(Fig. 1 and SI Appendix, Figs. S1 and S2).
After removing the climatological seasonal cycle, lower strato-
spheric temperature anomalies exhibit a large (post-1970) residual
seasonal cycle in the ALL+8.5 simulation, but not in the NAT
integration (Fig. 1A). This residual seasonality arises because of
the pronounced impact of stratospheric ozone depletion on the
seasonal cycle of TLS, particularly at high latitudes in the Southern
Hemisphere (25, 26) (SI Appendix, Fig. S3).
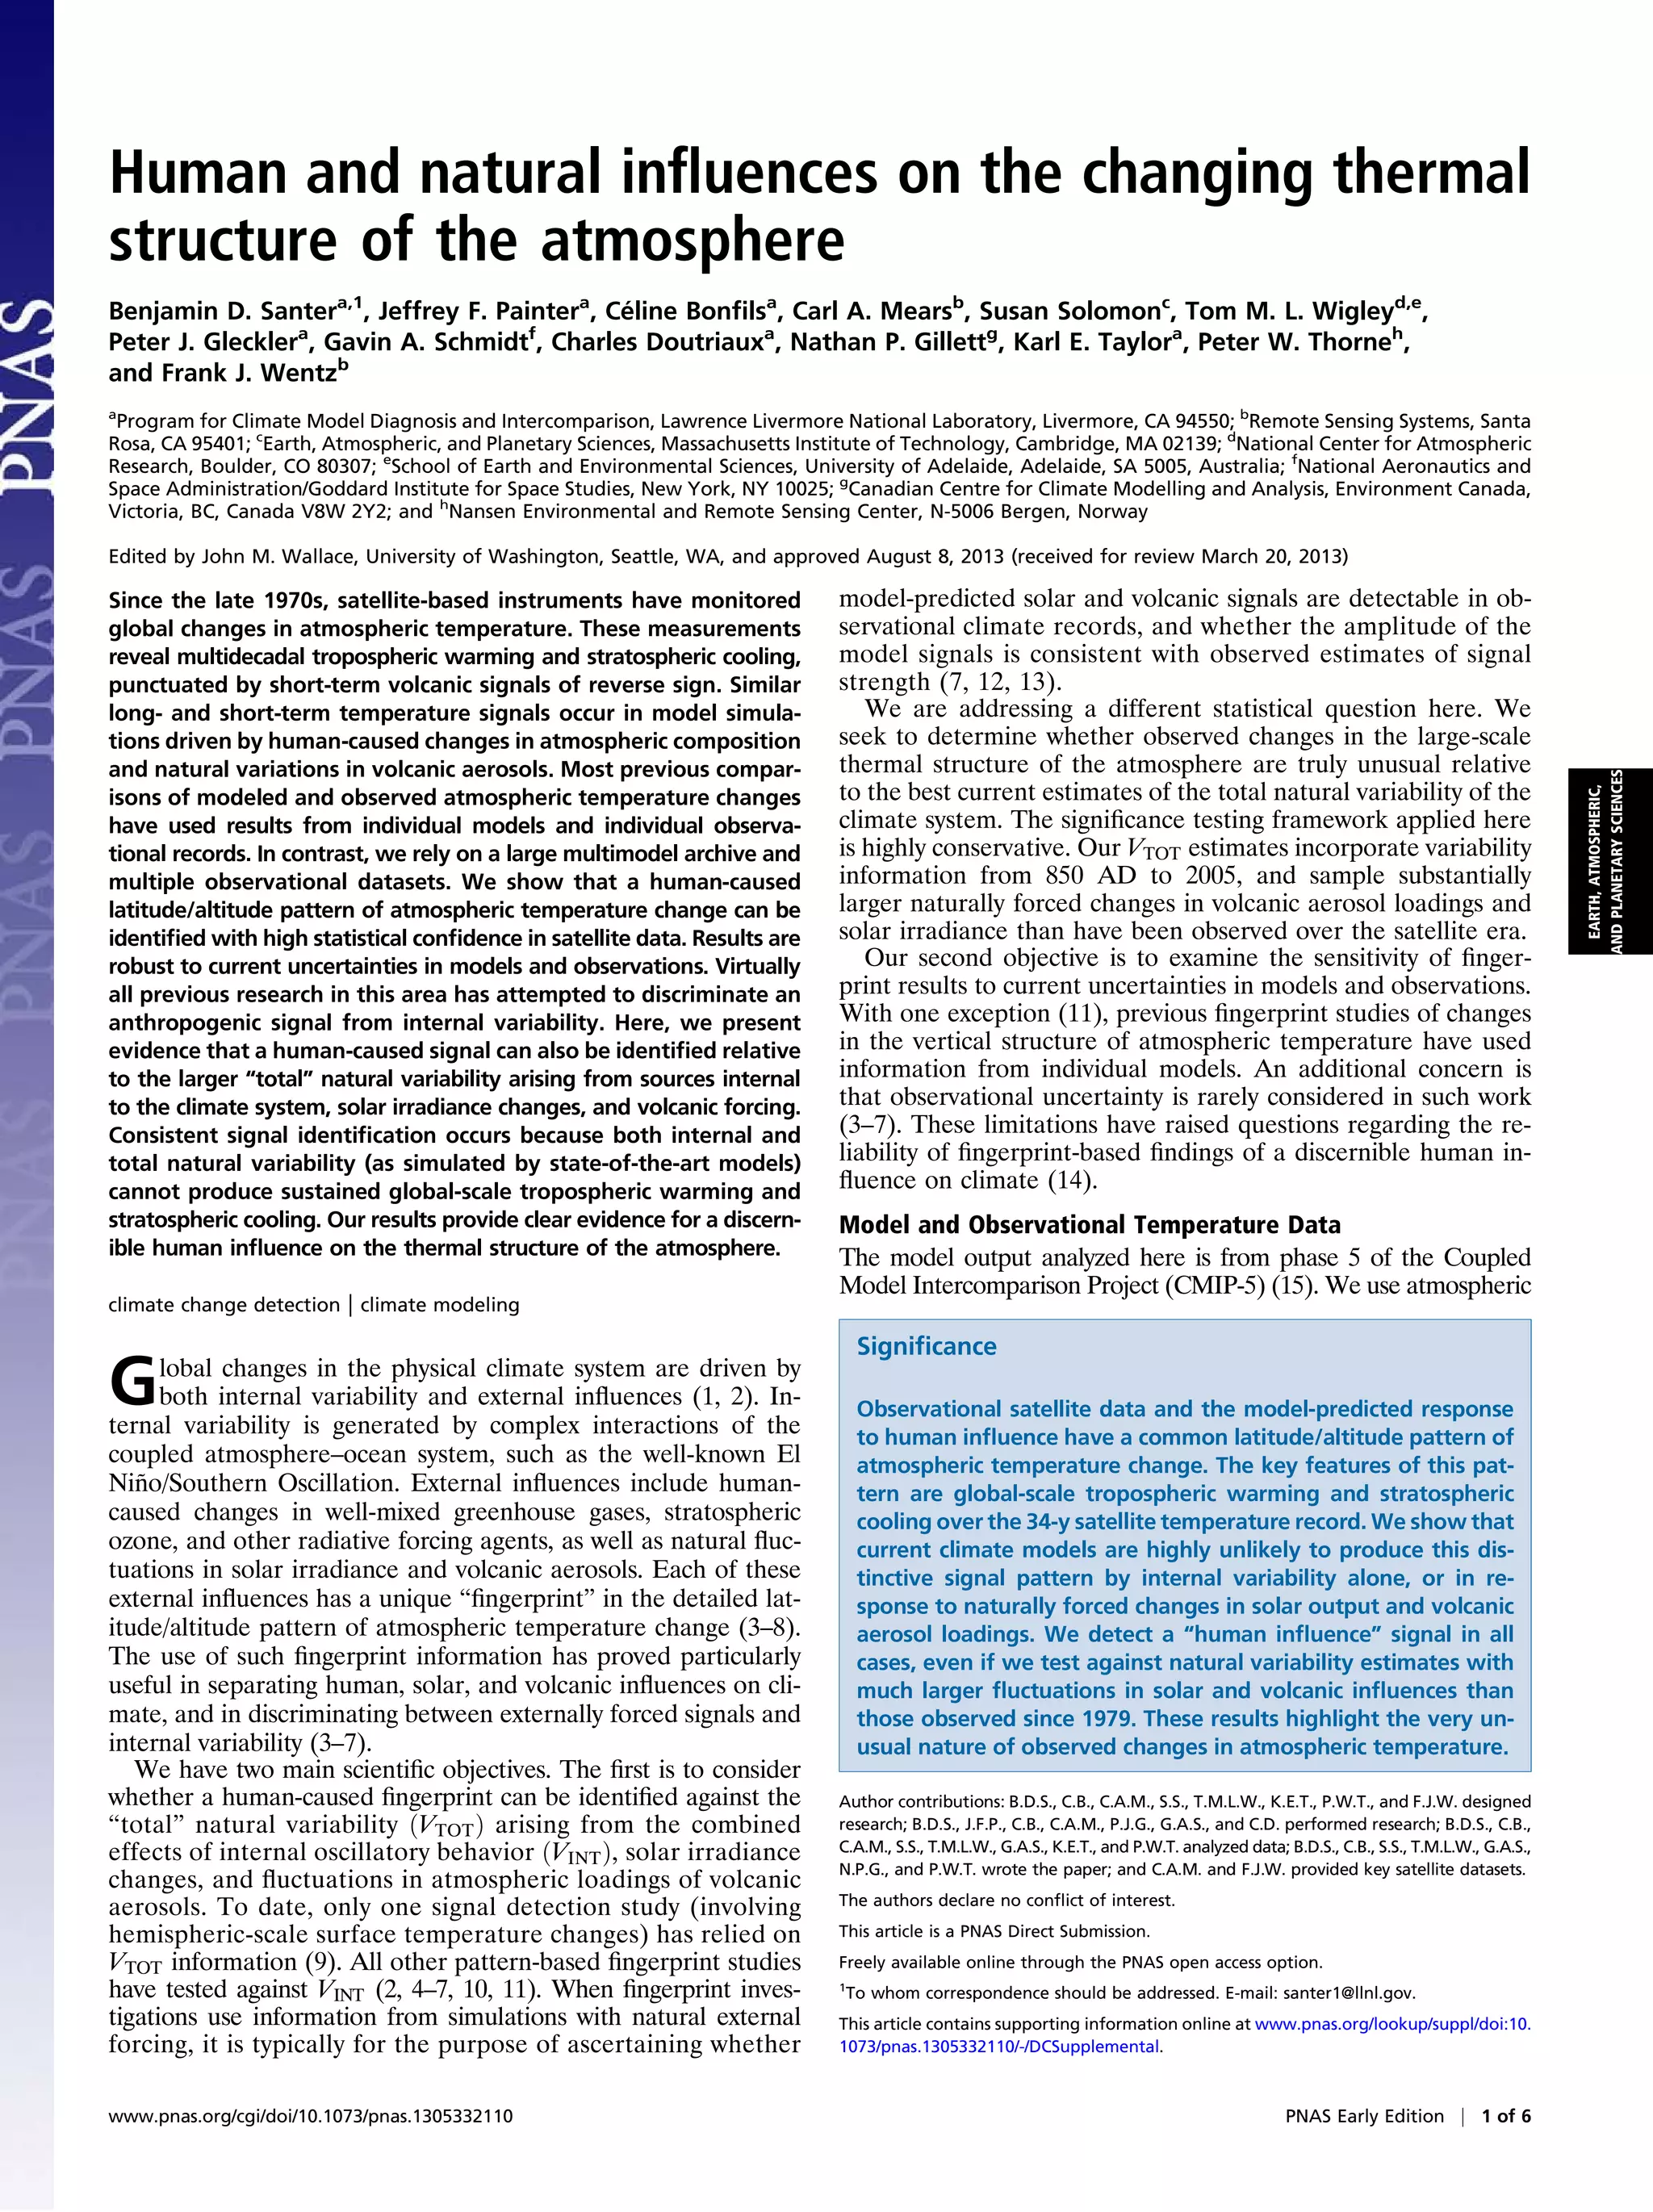
Latitude/Altitude Patterns of Temperature Change
Fig. 2 shows the vertical structure of zonal-mean atmospheric
temperature trends in the observations and the ALL+8.5, ANT,
NAT, VOL, and SOL simulations. Because we perform our
subsequent fingerprint analysis in “MSU space,” with only three
atmospheric layers (TLS, TMT, and TLT), we use the same
MSU space here for visual display of temperature trends. This
provides a vertically smoothed picture of temperature changes
over the satellite era, while still preserving the principal large-
scale features of externally forced signals. [The contouring al-
gorithm used to generate Fig. 2 interpolates temperature in-
formation between vertical layers, and between 58 latitude bands
(see legend of Fig. 2).]
The ALL+8.5 and ANT multimodel averages (Fig. 2 A and D)
and the observations (Fig. 2 H and I) are characterized by similar
patterns of large-scale tropospheric warming and lower strato-
spheric cooling. In the ALL+8.5 simulations, the most pronounced
intermodel differences in temperature trends are in the vicinity of
the Antarctic ozone hole (Fig. 2B and SI Appendix, Fig. S4), where
internal variability is large (10), and there are appreciable inter-
model differences in historical ozone forcing (27).
If we use the ratio R1 as a measure of the size of the multimodel
average ALL+8.5 trend relative to the intermodel SD of ALL+8.5
temperature trends, this metric exceeds two over substantial
portions of the troposphere and lower stratosphere (Fig. 2C). The
R1 results demonstrate that the ALL+8.5 pattern of tropospheric
warming and stratospheric cooling is robust to current uncer-
tainties in external forcings and model temperature responses.
-2
-1
0
1
2
3
4
TLSanomaly(
o
C)
A
Lower stratosphere
Atmospheric Temperature Changes in CMIP-5 Simulations
-1
-0.5
0
0.5
1
1.5
2
TMTanomaly(
o
C)
B Mid- to upper troposphere
Model average (ALL+8.5) +/- 2 sigma
Model average (NAT) +/- 2 sigma
Model average (NAT)
Model average (ALL+8.5)
1860 1880 1900 1920 1940 1960 1980 2000
-1
-0.5
0
0.5
1
1.5
2
TLTanomaly(
o
C)
C Lower troposphere
Fig. 1. Time series of simulated monthly mean near-global anomalies in the
temperature of the lower stratosphere (TLS), the mid- to upper troposphere
(TMT), and the lower troposphere (TLT) (A–C). Model results are from spliced
historical/RCP8.5 simulations with combined anthropogenic and natural ex-
ternal forcing (ALL+8.5) and from simulations with natural external forcing
only (NAT). The bold lines denote the ALL+8.5 and NAT multimodel aver-
ages, calculated with 20 and 16 CMIP-5 models (respectively). Temperatures
are averaged over 82.5°N–82.5°S for TLS and TMT, and over 82.5°N–70°S for
TLT. Anomalies are defined with respect to climatological monthly means
over 1861–1870. The shaded envelopes are the multimodel averages ± 2 × sðtÞ,
where sðtÞ is the “between model” SD of the 20 (ALL+8.5) and 16 (NAT) en-
semble-mean anomaly time series. To aid visual discrimination of the over-
lapping ALL+8.5 and NAT envelopes, the boundaries of the ALL+8.5 envelope
are indicated by dotted orange lines.
2 of 6 | www.pnas.org/cgi/doi/10.1073/pnas.1305332110 Santer et al.](https://image.slidesharecdn.com/humanandnaturalinfluencesonthechangingthermalstructureoftheatmosphere-130921205628-phpapp01/85/Human-and-natural_influences_on_the_changing_thermal_structure_of_the_atmosphere-2-320.jpg)
![Anthropogenic forcing makes the largest contribution to the
ALL+8.5 temperature-change pattern (Fig. 2 A and D–G). The
NAT contribution is relatively small, but augments the anthro-
pogenic signal. Over 1979–2005, the NAT contribution is domi-
nated by volcanic effects, which generate a slight warming trend in
the troposphere and a small cooling trend in the stratosphere (SI
Appendix, Fig. S5). Because there is little or no trend in solar ir-
radiance over the satellite era, the simulated solar signal is weak.
It is difficult to make more rigorous quantitative comparisons
of the temperature changes in the ALL+8.5, ANT, NAT, SOL,
and VOL simulations. This difficulty arises because of (i) “be-
tween experiment” differences in the number of models and real-
izations available for estimating multimodel averages (SI Appendix);
and (ii) “between model” differences in external forcings (27) and
climate sensitivity (28). The information provided in Fig. 2, how-
ever, represents our current best multimodel estimate of the
patterns and relative sizes of anthropogenically and naturally
forced atmospheric temperature changes over the satellite era.
Leading Signal and Noise Patterns
We use a standard fingerprint method (29) to compare model-
predicted vertical patterns of zonal-mean atmospheric temper-
ature change with satellite observations (SI Appendix). The
searched-for fingerprint is the climate-change signal in response
to a set of external forcings. Here, the fingerprint is defined as the
first empirical orthogonal function (EOF) of Sðx; h; tÞ, the multi-
model average of zonal-mean synthetic MSU temperature changes
in the ANT or ALL+8.5 simulations. [The double overbar in
Sðx; h; tÞ indicates two averaging steps: an average over ANT or
ALL+8.5 realizations of an individual model (if multiple real-
izations are available) and an average over models.]
Zonal-Mean Atmospheric Temperature Trends in CMIP-5 Models and Observations
-0.3 -0.2 -0.1 0 0.1 0.2 0.3
-0.25 -0.15 -0.05 0.05 0.15 0.25
A ALL+8.5 (model average trend) B ALL+8.5 (trend uncertainty) C ALL+8.5 (ratio R1)
-0.25 -0.15 -0.05 0.05 0.15 0.25
-0.3 -0.2 -0.1 0.0 0.1 0.2 0.3
0.06 0.12 0.18 0.24 0.3 0.36
0.03 0.09 0.15 0.21 0.27 0.33 0.39
-2.5 -1.5 -0.5 0.5 1.5 2.5
-3 -2 -1 0 1 2 3
D ANT NAT VOL
SOL RSS v3.3 UAH v5.4
R1 (dimensionless)
E F
G H I
Fig. 2. Zonal-mean atmospheric temperature trends in CMIP-5 models (A and D–G) and observations (H and I). Trends were calculated after first regridding
model and observational TLS, TMT, and TLT anomaly data to a 58 × 58 latitude/longitude grid, and then computing zonal averages. Results are plotted in “MSU
space,” at the approximate peaks of the TLS, TMT, and TLT global-mean MSU weighting functions (74, 595, and 740 hPa, respectively). Trends in the RSS and
UAH observations and the ALL+8.5 simulations are for the 408 months from January 1979 to December 2012. For the shorter ANT, NAT, VOL, and SOL
simulations, trends are over January 1979 to December 2005. The ALL+8.5, ANT, NAT, VOL, and SOL trends are multimodel averages, computed with 20, 8, 16,
2, and 3 models (respectively). B shows a simple measure of model uncertainty in the ALL+8.5 trends: sðx,hÞ, the intermodel SD of the 20 individual ensemble-
mean trends. The ratio R1 in C is the ALL+8.5 multimodel average trend in A, bðx,hÞ, divided by sðx,hÞ in B.
Santer et al. PNAS Early Edition | 3 of 6
EARTH,ATMOSPHERIC,
ANDPLANETARYSCIENCES](https://image.slidesharecdn.com/humanandnaturalinfluencesonthechangingthermalstructureoftheatmosphere-130921205628-phpapp01/85/Human-and-natural_influences_on_the_changing_thermal_structure_of_the_atmosphere-3-320.jpg)
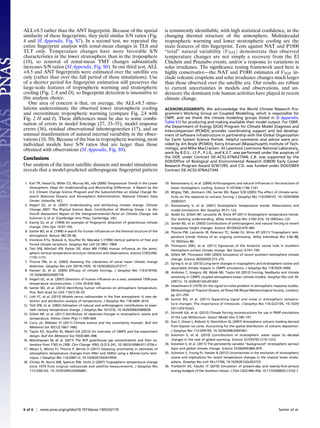
![As in the observations (Fig. 2 H and I), both the ANT and
ALL+8.5 fingerprints show spatially coherent warming of the
troposphere and cooling of the lower stratosphere (Fig. 3 A and B).
The similarity of the ANT and ALL+8.5 fingerprints arises because
model trends in atmospheric temperature over the past 30–60 y
are primarily driven by anthropogenic influences, with only a small
contribution from solar and volcanic forcing (Figs. 1 and 2).
Before presenting the results of our fingerprint analysis, we
first examine the major modes of internal and total natural
variability (Fig. 3 C–K). These are characterized by the leading
EOFs calculated from the CTL, NAT, and P1000 simulations (SI
Appendix). In the first EOF of the CTL simulations, temperature
changes in the tropics and extratropics are negatively correlated
(Fig. 3C). The leading mode in the NAT and P1000 simulations
used to estimate VTOT (Fig. 3 F and I) captures both the strato-
spheric warming and tropospheric cooling in response to large
volcanic eruptions and part of the internal variability manifest in
CTL EOF 1 (Fig. 3C). The natural variability modes in Fig. 3 C–K
lack the pattern of global-scale tropospheric warming and
stratospheric cooling that is evident in the observations (Fig. 2 H
and I) and the ANT and ALL+8.5 fingerprints (Fig. 3 A and B).
Fingerprint Results
We consider next the detectability of the ANT fingerprint. If the
amplitude of the fingerprint pattern Fðx; hÞ is increasing in
Oðx; h; tÞ, the time-varying observations, there will be a positive
trend in cfF; OgðtÞ, the covariance statistic that measures the
spatial similarity between Fðx; hÞ and Oðx; h; tÞ (SI Appendix). [The
indices x, h, and t are (respectively) over the total number of lat-
itude bands, atmospheric layers, and time (in years).] These “sig-
nal trends,” bðLÞ, are a function of the analysis period L, which
spans lengths of 10–34 y (i.e., from 1979–1988 to 1979–2012).
As L increases, the spatial similarity between Oðx; h; tÞ and the
ANT fingerprint decreases initially due to the stratospheric
warming and tropospheric cooling caused by the 1991 Pinatubo
eruption (Fig. 4A). This reduces the magnitude of bðLÞ values.
Leading Signal and Natural Variability Modes in CMIP-5 Models
EOF loading
-1.2 -0.8 -0.4 0 0.4 0.8 1.2
-1.0 -0.6 -0.2 0.2 0.6 1.0
A ANT signal EOF1 (90.14%)
B ALL+8.5 signal EOF1 (87.11%)
CTL noise EOF1 (31.85%) CTL noise EOF2 (23.21%) CTL noise EOF3 (17.31%)
NAT noise EOF1 (34.72%) NAT noise EOF2 (18.38%) NAT noise EOF3 (15.3%)
P1000 noise EOF1 (48.84%) P1000 noise EOF2 (15.73%) P1000 noise EOF3 (12.07%)
D E
F G H
I J K
C
Fig. 3. Leading signal and natural variability modes for the vertical structure of atmospheric temperature change in CMIP-5 simulations. All signal and
natural variability modes were calculated after first transforming annual-mean synthetic TLS, TMT, and TLT data to a common 58 × 58 latitude/longitude grid,
and then computing zonal averages. The leading signal modes are the first EOFs of the multimodel atmospheric temperature changes in the ANT and ALL+8.5
simulations (A and B, respectively). Multimodel averages were calculated over 1861–2012 for the ALL+8.5 case, and over 1861–2005 for the shorter ANT
simulations, using results from 20 ALL+8.5 models and 8 ANT models. The leading natural variability modes are EOFs 1, 2, and 3 of the 20 concatenated
preindustrial control runs (CTL; C–E), the 16 concatenated simulations with estimates of historical changes in solar and volcanic forcing over 1850–2005 (NAT;
F–H), and the 6 concatenated integrations with natural external forcing over 850–1700 (P1000; I–K). The percentage variance explained by each mode is given
in parentheses. See SI Appendix for further analysis details.
4 of 6 | www.pnas.org/cgi/doi/10.1073/pnas.1305332110 Santer et al.](https://image.slidesharecdn.com/humanandnaturalinfluencesonthechangingthermalstructureoftheatmosphere-130921205628-phpapp01/85/Human-and-natural_influences_on_the_changing_thermal_structure_of_the_atmosphere-4-320.jpg)
![During the recovery phase after Pinatubo, signal trends increase
until L = 20 years. Subsequently, following the large tropospheric
warming caused by the 1997/1998 El Niño, the amplitude of bðLÞ
gradually decreases. This decrease is due to changes in observed
rates of stratospheric cooling and troposphere warming (10, 30).
The crux of the fingerprint identification problem is to assess
whether these signal trends are statistically significant. We use
signal-to-noise (S/N) ratios to make this determination. To es-
timate the denominator of the S/N ratio, we require “null” (no
signal) distributions for trends of length L years. Conventionally,
these distributions are obtained using internal variability in-
formation from many L-year segments of CTL simulations.
Here, we also consider the additional variability arising from
solar and volcanic forcing, which we estimate using both the
NAT integrations and the longer P1000 runs. This gives us three
different sets of natural variability estimates and S/N ratios (Fig.
4 B and C; green, blue, and red curves).
We obtain “no signal” distributions by comparing Fðx; hÞ with
Nðx; h; tÞ, the temperature changes from the concatenated CTL,
NAT, or P1000 integrations. This yields long time series of the
pattern similarity statistic cfF; NgðtÞ, from which the null dis-
tributions can be calculated for varying trend lengths. These
distributions have means close to zero and standard deviations
sðLÞ that decrease by a factor of roughly 5 as L increases from
10 to 34 y (Fig. 4B).
The S/N ratio that we use for assessing the statistical signifi-
cance of signal trends is simply given by bðLÞ=sðLÞ (Fig. 4C). [For
L = 10, therefore, bðLÞ is calculated over 1979–1988, and sðLÞ is
computed from the distribution of nonoverlapping 10-y trends in
cfF; NgðtÞ.] S/N ratios generally increase with longer analysis
periods, primarily because of the decrease in sðLÞ with larger
values of L. With CTL noise, S/N ratios for signal trends com-
puted over 1979–2012 are invariably significant at the 1% level or
better, and range from 8.4 to 10.7, depending on the choice of
observational dataset.
Consider next the S/N results for tests against VTOT. The NAT
simulations provide estimates of how atmospheric temperature
might have evolved in the absence of human intervention, but in
the presence of stochastic temperature changes arising from in-
ternal variability and deterministic changes caused by solar and
volcanic forcing. One possible significance testing strategy is to
restrict our estimate of VTOT to the period of overlap between
the NAT runs and the satellite data sets (1979–2005). This strategy
has two disadvantages: (i) we have only 16 NAT models with
samples of naturally forced temperature change over 1979–2005;
and (ii) each of these samples includes only two major volcanic
eruptions (El Chichón and Pinatubo).
Here, we estimate VTOT over 1861–2005, and thus do not re-
quire that the simulated and observed evolution of volcanic forc-
ing is identical. By using this longer period, we include the effects
of four additional major eruptions in the presatellite era (Krakatau
in 1883, Soufrière/Pelée/Santa Maria in 1902, Novarupta in 1912,
and Agung in 1963) and obtain many more samples of the tem-
perature response to volcanic forcing. This increase in sample size
is advantageous in assessing the likelihood of obtaining the observed
signal trends by total natural variability alone.
As expected, trends computed from the NAT simulations are
generally larger than those obtained from the CTL runs (Fig. 4B).
This holds for all timescales examined here. Despite the increase
in the size of the denominator, S/N ratios remain highly signifi-
cant for signal trends calculated over the full satellite record,
ranging from 3.7 to 4.8 (Fig. 4C). It is unlikely that these values
are spuriously inflated by a systematic underestimate of total
natural variability in the CMIP-5 models analyzed here (10).
Although there are large uncertainties in the solar and vol-
canic forcings used in the six P1000 runs (31), these simulations
provide our best current estimates of the magnitude and patterns
of naturally forced atmospheric temperature change over the
period from 850 to 1849 (SI Appendix, Fig. S6). As in the case of
the NAT simulations, we use P1000 VTOT estimates to determine
whether an anthropogenic fingerprint can be identified relative to
total natural variability levels that are substantially larger than
those actually sampled over the satellite era.
In addition to solar and volcanic forcing, the P1000 simu-
lations include anthropogenic changes in GHGs and land use
(31). To avoid appreciable anthropogenic contamination, VTOT
values were calculated using synthetic MSU temperatures for
850–1700 only. This period contains at least two massive volcanic
eruptions—an unknown eruption in 1259, and Kuwae in 1452.
Each event is estimated to have produced larger stratospheric
sulfate aerosol loadings than those of any eruption during the
NAT simulation period (32). This explains why the P1000 levels
of total natural variability are consistently higher than those
computed with NAT simulations (Fig. 4B). Even with these very
large P1000 VTOT values, we still obtain ubiquitous detection of
an anthropogenic fingerprint in the observations, with S/N ratios
ranging from 2.5 to 3.2 for 34-y trends (Fig. 4C).
Sensitivity Tests
We performed a number of additional sensitivity studies to ex-
plore the robustness of these results. The first involved use of the
1990 1995 2000 2005 2010
Last year of L-year linear trend in signal
0
0.1
0.2
0.3
0.4
0.5
Trendinc{F,O}(t)
RSS 5-95 percentiles
RSS v3.3
UAH v5.5
Signal Trends, Noise Trends, and S/N Ratios
Zonal-mean TLS, TMT, and TLT. ANT fingerprint (1861-2005)
10 15 20 25 30
Length of noise trend (years)
0
0.1
0.2
0.3
0.4
0.5
Trendinc{F,N}(t)
Std. deviation of noise trends
CTL noise
NAT noise
P1000 noise
1990 1995 2000 2005 2010
Last year of L-year linear trend in signal
0
2
4
6
8
10
S/Nratio
S/N ratio
RSS v3.3 (CTL noise)
UAH v5.5 (CTL noise)
RSS v3.3 (NAT noise)
UAH v5.5 (NAT noise)
RSS v3.3 (P1000 noise)
UAH v5.5 (P1000 noise)
1% significance threshold
Signal trends
A
B
C
Fig. 4. Results from the S/N analysis of simulated and observed changes in
zonal-mean TLS, TMT, and TLT. Signal time series provide information on the
similarity between the time-invariant ANT fingerprint pattern (Fig. 3A) and
the time-varying observed patterns of zonal-mean atmospheric temperature
change. Values of bðLÞ, the L-year trends in these signal time series, are
plotted in A. Noise time series indicate the level of similarity between the
ANT fingerprint and the CTL, NAT, and P1000 estimates of variability. B
shows sðLÞ, the SD of the distribution of nonoverlapping L-year trends in the
CTL, NAT, and P1000 noise time series. The S/N ratio between bðLÞ and sðLÞ is
given in C. The thin solid lines in C are the S/N ratios for signal trends
obtained with the RSS 5–95 percentiles. The nominal 1% significance level
assumes a Gaussian distribution of noise trends. The ANT fingerprint was
calculated using the multimodel average zonal-mean changes in atmo-
spheric temperature over 1861–2005 (SI Appendix). Signal and noise trends in
A and B have units of cfF,Og=decade and cfF,Ng=decade, respectively.
Santer et al. PNAS Early Edition | 5 of 6
EARTH,ATMOSPHERIC,
ANDPLANETARYSCIENCES](https://image.slidesharecdn.com/humanandnaturalinfluencesonthechangingthermalstructureoftheatmosphere-130921205628-phpapp01/85/Human-and-natural_influences_on_the_changing_thermal_structure_of_the_atmosphere-5-320.jpg)

This document analyzes human and natural influences on changing atmospheric temperature patterns based on climate model simulations and satellite observations. The key findings are: 1) Both climate model simulations including human factors and satellite data show widespread tropospheric warming and stratospheric cooling over the past several decades. 2) These temperature changes are unlikely to be due to internal variability or natural external factors alone, based on comparisons to model runs with only natural forcings. 3) The observed temperature pattern matches that expected from increased greenhouse gases more closely than patterns from alternative forcings, providing evidence of a human influence on atmospheric temperatures.


![Getting Started with Apache Spark: Big Data Made Simple [Free Meetup]](https://cdn.slidesharecdn.com/ss_thumbnails/apachesparkgettingstarted-260203175547-8361bcc3-thumbnail.jpg?width=640&height=640&fit=bounds)


