SlideShare a Scribd company logo
1 of 10
Download to read offline
Characterizing Pre-Fire Vegetation As Fire Fuel in the 2002 Williams
Fire, San Dimas Experimental Forest, California
Geography 592, SDSU
ABSTRACT
Analysis of whether
certain types of
vegetation classes
are associated with
higher intensity
thermal features as
frontline fire fuel,
and to compare
temperature
gradients between
the front and rear
fire fuel areas.
Lisa Hill
May 10, 2016
Hill, 1
Objectives
The San Dimas Experimental Forest (SDEF) is managed by the USDA Forest Service (USFS) as a
field laboratory, containing chaparral and other Mediterranean-type plant communities. To measure the
thermal radiance of wildland fires, the USFS utilizes the Firemapper ® system that accurately samples
emitted thermal-infrared heat. Firemapper wildland fire images were orthorectified and assembled into
georeferenced mosaics. Image spatial resolution ranged from 5 to 9 meters, and aerial repeat-pass
images were taken on September 23, 2002 between 14:00 to 15:15 Pacific Time Standard (PST). The
Firemapper images were overlaid on high altitude color infrared subset images to identify the
vegetation fire front, in addition to thermal features within and behind the fire front.
The objective of this study is to identify whether certain types of vegetation classes are associated with
higher intensity thermal features as frontline fire fuel, and to compare temperature gradients between
the front and rear fire fuel areas. Within ERDAS Imagine 2013, I utilized an unsupervised classification
process to map vegetation classes within fronting spreading zones of the 2002 Williams Fire in the
SDEF, and assessed the intensity values in thermal infrared images of selected fire spread events
which occurred on September 23, 2002. These were compared and analyzed within ArcMap 10.3 using
the Zonal Statistics as Table tool.
Imagery
A three band color infrared aerial photographic image of 1 meter nominal spatial resolution was
obtained from the United States Geologic Survey (glovis.usgs.gov), and then orthorectified using
ground control points obtained through visual assessment of ArcMap base map imagery. The aerial
thermal infrared (ATIR) images had been orthorectified by the Center for Earth Systems Analysis
Research (CESAR) at San Diego State University, and provided a reasonable level of alignment with
the color infrared image.
Software Used
ERDAS Imagine 2013
ArcMap 10.3.1
Methods
Two subsets from the USGS aerial color infrared image frame were selected to identify the vegetation
fuel prior to the 2002 Williams fire area within the SDEF (Images 6b1.img and 8b1.img). Two sites were
selected in the study area based on their fire spread, topography contour and variety of vegetation in
Hill, 2
the area. Using ERDAS Imagine, each orthorectified CIR image represented below was subset to
provide a smaller image that matched to the specific fire paths identified by the selected USFS fire
image mosaics (created by Pete Coulter, SDSU Geography Technical Staff).
Site 1 - Ortho_subset_1.img 8b1.img Site 2 - Ortho_subset_2.img of 6b1.img
Covering Big Dalton Reservoir, North of Big Dalton Reservoir, SDEF
San Dimas Experimental Forest (SDEF)
The two CIR subset images were classified to identify vegetation and other land cover types within the
2002 Williams fire path. The classes included subshrub, shrub, tree, herbaceous, soil, and built
materials. An unsupervised classification process was utilized. I analyzed a 2000 Google Earth image
within ERDAS Imagine in order to identify vegetation as subshrub, shrub, tree, herbaceous, and soil
with paved streets and concrete areas. Subshrub and herbaceous were combined into one class due to
the limited image spatial resolution which prevented identification and separation of these vegetation
types. The following unsupervised classification steps were completed for each subset image:
(1) Using ERDAS Imagine, selected the ISODATA algorithm choosing 10 iterations and 36 clusters
for each subset image’s spectral-radiometric feature, and selected minimum spectral distance to
assign clusters or each candidate pixel. Number of ISODATA iterations and clusters selected
were based on reviewing prior Firemapping studies, class labs and recommendation from SDSU
Geography remote sensing staff.
(2) Within the spectral-radiometric feature space of the CIR image chose minimum pixel selection
(20) threshold level and minimum cluster size (>.05%).
Hill, 3
(3) Using ArcMap 10.3, added the CIR subset images and pixels clusters were classified according
to 7 cluster classes (zero classification (0)), soil (1), subshrub/herbaceous (2), shrub (3), tree (4),
water (5), built (6), and reclassify (7). Vegetation cluster class labeling was based on visual
interpretation of the original CIR imagery in correspondence with the location of pixels for each
cluster class.
(4) Assigned appropriate information class names or labels to the cluster classes. The assignment
of cluster names (cluster labeling) required familiarity with the area of interest.
(5) Once classes were assigned values in ERDAS Imagine, unidentified (“reclassified”) complex
clusters were reclassified into 15 different clusters using an approach called “cluster-busting”
(using a multiple phase approach) by running the unclassified pixels through ISODATA again.
This resulted in a vegetation class map of each study site.
(6) Within ArcMap, identified and examined the reliability of the vegetation classification using
“heads up” visible interpretation based on the original CIR subset image and overlaid the
vegetation class map on the ArcMap World Map layer.
(7) Overlaid selected USFS fire mosaic images to identify fire intensity based on the vegetation land
classifications identified. These fire mosaics demonstrate the fire path occurred from 2:16 to 2:50
on September 23, 2002.
(8) Applied color density slice to fire mosaics to identify heat intensity based on DN’s and vegetation
classes that assisted in identifying fire frontline and backline fuel composition. Roads, built
surfaces and water were also classified to identify unburned areas.
(9) Within ArcMap 10.3 using the Zonal Statistics as Table tool, calculated the pixel count and
median Celsius temperature for fire front line and back line polygon sampling areas to estimate
Sites 1 and 2 specific vegetation class temperatures and their sampling DN density.
Results
A conjecture was made that certain types of vegetation might burn more intensely than other
vegetation, based on the higher DN’s that would also show up in the density slice layer. Red colors
represented the highest heat within front fire line, with light yellow to white colors representing the
coolest temperatures in the rear fire line. In Image 1, the fire is moving right to left toward the blue area
(water within the Big Dalton Reservoir). Site 1 (Ortho_subset_1.img 8b1.img) covers the Big Dalton
Reservoir and Site 2 (Ortho_subset_2.img of 6b1.img) lies directly to the northeast of the reservoir.
Hill, 4
Classes within the vegetation map layer were color identified as:
1 - Soil
2 – Sub-shrub (herbaceous and sub-shrubbery)
3 – Shrub
4 – Trees
5 – Water
6 – Built (roads, concrete)
Site 1 - Overlay fire image at 2:16 PM Site 2 - Overlay fire image at 2:30 PM
Big Dalton Reservoir Area, SDEF Northeast of Big Dalton Reservoir
Fire mosaic layer with density slice (white to red color range) overlaid on classified vegetation map.
Multicolored rectangle polygons within fire mosaic layer identifies sampling areas to measure fire
temperature in Celsius.
Hill, 5
Site 1 - Overlay fire image at 2:43 PM
Big Dalton Reservoir, SDEF
Site 1 - Overlay fire image at 2:50 PM Site 2 – Overlay fire image at 2:50 PM
Big Dalton Reservoir, SDEF Northeast of Big Dalton Reservoir
Hill, 6
Flickering the fire mosaics over the vegetation image layer indicated subshrub provided the greatest
concentration of fuel source, followed by shrub and trees. To identify the vegetation type that yielded
the highest heat response (in DNs), I used the Raster Statistics Table tool in ArcMap on selected hot
spots in both images. Median DN values within the vegetation polygons were measured in degrees
Celsius
Statistical Analysis
Within the fire mosaics, certain areas were selected toward the front and rear of the fire line as polygon
samples (see attached Frontline and Backline Fire Mosaic Table). Although the front line highest
temperature registered for shrub and trees indicated the highest median temperatures, the majority of
fire fuel available came from sub-shrubbery. The back fire line polygons indicated the soil retained
hotter median values. These results may indicate smoldering coals and debris with left over from
vegetation fuel still burning (subshrub, shrub and trees).
Hill, 7
Hill, 8
Conclusion
From the Unsupervised Classification vegetation map and the statistical tables, it appears trees and
shrubs provide fire fuel that can generate the highest heat. However, based on the DN pixel
concentration shown in the prior table and by vegetation identification from Google imagery, the
greatest concentration of fire fuel provided appears to be from subshrub vegetation. Although subshrub
provides a greater availability of fuel source, subshrub does not appear to generate as hot of a fire
compared to measured trees and shrub temperatures. Reviewing the table data, frontline areas
indicated front line fire temperatures ranging from 157° to 307° Celsius, and back fire line temperatures
between 61° to 167° Celsius. Site 1 Clip 16 does not seem to coincide with the other site area
measurements, which could be due to site temperature selection error. Results and interpretations of
the fire intensity patterns within different vegetation types could also be affected by individual growth
form map accuracy, as well as geometric misalignment between both image sets.
Remote sensing images at higher resolution of the fire line area before the 2002 Williams fire would
improve identification of key fuel fire species. Also, consideration and analysis of the wind,
concentration of exposed soil and topography influences must be taken into account and were not
analyzed in this project. This analysis aids in identifying how different types of vegetation fueled the
2002 San Dimas fire, however further analysis is required of topography, wind, soil moisture, and daily
temperature within the study area.
Hill, 9
References
ArcMap 10.3 World Map
USFS Williams Fire JPEG map - http://www.fireimaging.com/homepage.html
Stow, D. A., Riggan, P. J., Storey, E. J., & Coulter, L. L. (2014). Measuring fire spread rates from repeat
pass airborne thermal infrared imagery. Remote Sensing Letters, 5(9), 803-812.

More Related Content

What's hot

Remote Sensing of Urban Heat Islands
Remote Sensing of Urban Heat IslandsRemote Sensing of Urban Heat Islands
Remote Sensing of Urban Heat IslandsChristopher Martin
 
MA Thesis Presentation
MA Thesis PresentationMA Thesis Presentation
MA Thesis Presentationbcmitche
 
Measuring water from Sky: Basin-wide ET monitoring and application
Measuring water from Sky: Basin-wide ET monitoring and applicationMeasuring water from Sky: Basin-wide ET monitoring and application
Measuring water from Sky: Basin-wide ET monitoring and applicationIwl Pcu
 
IRJET - Prediction of Ground Water Level based on Machine Learning
IRJET - Prediction of Ground Water Level based on Machine LearningIRJET - Prediction of Ground Water Level based on Machine Learning
IRJET - Prediction of Ground Water Level based on Machine LearningIRJET Journal
 
Luedeling long term trials for climate change research
Luedeling long term trials for climate change researchLuedeling long term trials for climate change research
Luedeling long term trials for climate change researchWorld Agroforestry (ICRAF)
 
Fire is not fire: the next generation of TERN fire remote sensing datasets
Fire is not fire: the next generation of TERN fire remote sensing datasetsFire is not fire: the next generation of TERN fire remote sensing datasets
Fire is not fire: the next generation of TERN fire remote sensing datasetsTERN Australia
 
Seminar final1
Seminar final1Seminar final1
Seminar final1Amod6
 
EGU 2014 invited talk (mostly on simulation of ecohydrology) - by Giacomo Ber...
EGU 2014 invited talk (mostly on simulation of ecohydrology) - by Giacomo Ber...EGU 2014 invited talk (mostly on simulation of ecohydrology) - by Giacomo Ber...
EGU 2014 invited talk (mostly on simulation of ecohydrology) - by Giacomo Ber...Riccardo Rigon
 

What's hot (9)

Remote Sensing of Urban Heat Islands
Remote Sensing of Urban Heat IslandsRemote Sensing of Urban Heat Islands
Remote Sensing of Urban Heat Islands
 
MA Thesis Presentation
MA Thesis PresentationMA Thesis Presentation
MA Thesis Presentation
 
Measuring water from Sky: Basin-wide ET monitoring and application
Measuring water from Sky: Basin-wide ET monitoring and applicationMeasuring water from Sky: Basin-wide ET monitoring and application
Measuring water from Sky: Basin-wide ET monitoring and application
 
IRJET - Prediction of Ground Water Level based on Machine Learning
IRJET - Prediction of Ground Water Level based on Machine LearningIRJET - Prediction of Ground Water Level based on Machine Learning
IRJET - Prediction of Ground Water Level based on Machine Learning
 
Use of GIS Pixel Analysis of High-Resolution, Leaf-On Imagery to Guide and Su...
Use of GIS Pixel Analysis of High-Resolution, Leaf-On Imagery to Guide and Su...Use of GIS Pixel Analysis of High-Resolution, Leaf-On Imagery to Guide and Su...
Use of GIS Pixel Analysis of High-Resolution, Leaf-On Imagery to Guide and Su...
 
Luedeling long term trials for climate change research
Luedeling long term trials for climate change researchLuedeling long term trials for climate change research
Luedeling long term trials for climate change research
 
Fire is not fire: the next generation of TERN fire remote sensing datasets
Fire is not fire: the next generation of TERN fire remote sensing datasetsFire is not fire: the next generation of TERN fire remote sensing datasets
Fire is not fire: the next generation of TERN fire remote sensing datasets
 
Seminar final1
Seminar final1Seminar final1
Seminar final1
 
EGU 2014 invited talk (mostly on simulation of ecohydrology) - by Giacomo Ber...
EGU 2014 invited talk (mostly on simulation of ecohydrology) - by Giacomo Ber...EGU 2014 invited talk (mostly on simulation of ecohydrology) - by Giacomo Ber...
EGU 2014 invited talk (mostly on simulation of ecohydrology) - by Giacomo Ber...
 

Similar to LHill_Geog592_ClassProjectFinalPaperDS_Final

LIDAR TECHNOLOGY AND ITS APPLICATION ON FORESTRY
LIDAR TECHNOLOGY AND ITS APPLICATION ON FORESTRYLIDAR TECHNOLOGY AND ITS APPLICATION ON FORESTRY
LIDAR TECHNOLOGY AND ITS APPLICATION ON FORESTRYAbhiram Kanigolla
 
kellndorfer_WE3.T05.4.pptx
kellndorfer_WE3.T05.4.pptxkellndorfer_WE3.T05.4.pptx
kellndorfer_WE3.T05.4.pptxgrssieee
 
Kush Defense
Kush DefenseKush Defense
Kush Defensekbhusal
 
Effects of Deforestation
Effects of DeforestationEffects of Deforestation
Effects of DeforestationRahul Rakshit
 
Modelling and remote sensing of land surface
Modelling and remote sensing of land surfaceModelling and remote sensing of land surface
Modelling and remote sensing of land surfacemehmet şahin
 
IGARSS_29_07_2011.ppt
IGARSS_29_07_2011.pptIGARSS_29_07_2011.ppt
IGARSS_29_07_2011.pptgrssieee
 
Brian eitel aral sea
Brian eitel aral seaBrian eitel aral sea
Brian eitel aral seaBrian Eitel
 
Fire Risk Zonation Through Geospatial Modeling.pptx
Fire Risk Zonation Through Geospatial Modeling.pptxFire Risk Zonation Through Geospatial Modeling.pptx
Fire Risk Zonation Through Geospatial Modeling.pptxsahl_2fast
 
Modelling of air temperature using ann and remote sensing
Modelling of air temperature using ann and remote sensingModelling of air temperature using ann and remote sensing
Modelling of air temperature using ann and remote sensingmehmet şahin
 
NISAR NASA-ISRO Synthetic Aperture Radar (NISAR) Fire Management
NISAR NASA-ISRO Synthetic Aperture Radar (NISAR) Fire ManagementNISAR NASA-ISRO Synthetic Aperture Radar (NISAR) Fire Management
NISAR NASA-ISRO Synthetic Aperture Radar (NISAR) Fire ManagementDr. Pankaj Dhussa
 
Application of remote sensing in forest ecosystem
Application of remote sensing in forest ecosystemApplication of remote sensing in forest ecosystem
Application of remote sensing in forest ecosystemaliya nasir
 
Geothermal exploration using remote sensing techniques
Geothermal exploration using remote sensing techniquesGeothermal exploration using remote sensing techniques
Geothermal exploration using remote sensing techniquesSepideh Abadpour
 
REMOTE SENSING
REMOTE SENSING REMOTE SENSING
REMOTE SENSING MUKESHMK13
 
Using SAR Intensity and Coherence to Detect A Moorland Wildfire Scar
Using SAR Intensity and Coherence to Detect A Moorland Wildfire ScarUsing SAR Intensity and Coherence to Detect A Moorland Wildfire Scar
Using SAR Intensity and Coherence to Detect A Moorland Wildfire ScarGail Millin-Chalabi
 
Land sutability for establishing rainswater harvesting systems for fighting w...
Land sutability for establishing rainswater harvesting systems for fighting w...Land sutability for establishing rainswater harvesting systems for fighting w...
Land sutability for establishing rainswater harvesting systems for fighting w...José María
 
Mapping Land Cover Changes Using Landsat TM: a Case Study of Yamal Ecosystems...
Mapping Land Cover Changes Using Landsat TM: a Case Study of Yamal Ecosystems...Mapping Land Cover Changes Using Landsat TM: a Case Study of Yamal Ecosystems...
Mapping Land Cover Changes Using Landsat TM: a Case Study of Yamal Ecosystems...Universität Salzburg
 

Similar to LHill_Geog592_ClassProjectFinalPaperDS_Final (20)

GRL99
GRL99GRL99
GRL99
 
LIDAR TECHNOLOGY AND ITS APPLICATION ON FORESTRY
LIDAR TECHNOLOGY AND ITS APPLICATION ON FORESTRYLIDAR TECHNOLOGY AND ITS APPLICATION ON FORESTRY
LIDAR TECHNOLOGY AND ITS APPLICATION ON FORESTRY
 
kellndorfer_WE3.T05.4.pptx
kellndorfer_WE3.T05.4.pptxkellndorfer_WE3.T05.4.pptx
kellndorfer_WE3.T05.4.pptx
 
Kush Defense
Kush DefenseKush Defense
Kush Defense
 
BREWSTER_K_poster
BREWSTER_K_posterBREWSTER_K_poster
BREWSTER_K_poster
 
Effects of Deforestation
Effects of DeforestationEffects of Deforestation
Effects of Deforestation
 
Modelling and remote sensing of land surface
Modelling and remote sensing of land surfaceModelling and remote sensing of land surface
Modelling and remote sensing of land surface
 
IGARSS_29_07_2011.ppt
IGARSS_29_07_2011.pptIGARSS_29_07_2011.ppt
IGARSS_29_07_2011.ppt
 
Fire Poster
Fire PosterFire Poster
Fire Poster
 
Brian eitel aral sea
Brian eitel aral seaBrian eitel aral sea
Brian eitel aral sea
 
Fire Risk Zonation Through Geospatial Modeling.pptx
Fire Risk Zonation Through Geospatial Modeling.pptxFire Risk Zonation Through Geospatial Modeling.pptx
Fire Risk Zonation Through Geospatial Modeling.pptx
 
Modelling of air temperature using ann and remote sensing
Modelling of air temperature using ann and remote sensingModelling of air temperature using ann and remote sensing
Modelling of air temperature using ann and remote sensing
 
NISAR NASA-ISRO Synthetic Aperture Radar (NISAR) Fire Management
NISAR NASA-ISRO Synthetic Aperture Radar (NISAR) Fire ManagementNISAR NASA-ISRO Synthetic Aperture Radar (NISAR) Fire Management
NISAR NASA-ISRO Synthetic Aperture Radar (NISAR) Fire Management
 
Application of remote sensing in forest ecosystem
Application of remote sensing in forest ecosystemApplication of remote sensing in forest ecosystem
Application of remote sensing in forest ecosystem
 
Geothermal exploration using remote sensing techniques
Geothermal exploration using remote sensing techniquesGeothermal exploration using remote sensing techniques
Geothermal exploration using remote sensing techniques
 
REMOTE SENSING
REMOTE SENSING REMOTE SENSING
REMOTE SENSING
 
Using SAR Intensity and Coherence to Detect A Moorland Wildfire Scar
Using SAR Intensity and Coherence to Detect A Moorland Wildfire ScarUsing SAR Intensity and Coherence to Detect A Moorland Wildfire Scar
Using SAR Intensity and Coherence to Detect A Moorland Wildfire Scar
 
Land sutability for establishing rainswater harvesting systems for fighting w...
Land sutability for establishing rainswater harvesting systems for fighting w...Land sutability for establishing rainswater harvesting systems for fighting w...
Land sutability for establishing rainswater harvesting systems for fighting w...
 
MIFSU.ppt
MIFSU.pptMIFSU.ppt
MIFSU.ppt
 
Mapping Land Cover Changes Using Landsat TM: a Case Study of Yamal Ecosystems...
Mapping Land Cover Changes Using Landsat TM: a Case Study of Yamal Ecosystems...Mapping Land Cover Changes Using Landsat TM: a Case Study of Yamal Ecosystems...
Mapping Land Cover Changes Using Landsat TM: a Case Study of Yamal Ecosystems...
 

LHill_Geog592_ClassProjectFinalPaperDS_Final

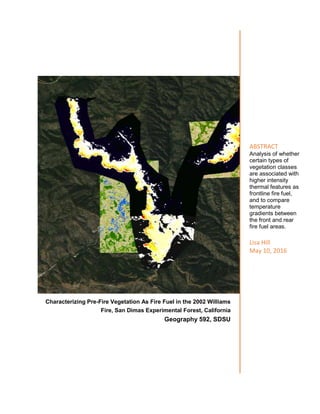
  • 1. Characterizing Pre-Fire Vegetation As Fire Fuel in the 2002 Williams Fire, San Dimas Experimental Forest, California Geography 592, SDSU ABSTRACT Analysis of whether certain types of vegetation classes are associated with higher intensity thermal features as frontline fire fuel, and to compare temperature gradients between the front and rear fire fuel areas. Lisa Hill May 10, 2016
  • 2. Hill, 1 Objectives The San Dimas Experimental Forest (SDEF) is managed by the USDA Forest Service (USFS) as a field laboratory, containing chaparral and other Mediterranean-type plant communities. To measure the thermal radiance of wildland fires, the USFS utilizes the Firemapper ® system that accurately samples emitted thermal-infrared heat. Firemapper wildland fire images were orthorectified and assembled into georeferenced mosaics. Image spatial resolution ranged from 5 to 9 meters, and aerial repeat-pass images were taken on September 23, 2002 between 14:00 to 15:15 Pacific Time Standard (PST). The Firemapper images were overlaid on high altitude color infrared subset images to identify the vegetation fire front, in addition to thermal features within and behind the fire front. The objective of this study is to identify whether certain types of vegetation classes are associated with higher intensity thermal features as frontline fire fuel, and to compare temperature gradients between the front and rear fire fuel areas. Within ERDAS Imagine 2013, I utilized an unsupervised classification process to map vegetation classes within fronting spreading zones of the 2002 Williams Fire in the SDEF, and assessed the intensity values in thermal infrared images of selected fire spread events which occurred on September 23, 2002. These were compared and analyzed within ArcMap 10.3 using the Zonal Statistics as Table tool. Imagery A three band color infrared aerial photographic image of 1 meter nominal spatial resolution was obtained from the United States Geologic Survey (glovis.usgs.gov), and then orthorectified using ground control points obtained through visual assessment of ArcMap base map imagery. The aerial thermal infrared (ATIR) images had been orthorectified by the Center for Earth Systems Analysis Research (CESAR) at San Diego State University, and provided a reasonable level of alignment with the color infrared image. Software Used ERDAS Imagine 2013 ArcMap 10.3.1 Methods Two subsets from the USGS aerial color infrared image frame were selected to identify the vegetation fuel prior to the 2002 Williams fire area within the SDEF (Images 6b1.img and 8b1.img). Two sites were selected in the study area based on their fire spread, topography contour and variety of vegetation in
  • 3. Hill, 2 the area. Using ERDAS Imagine, each orthorectified CIR image represented below was subset to provide a smaller image that matched to the specific fire paths identified by the selected USFS fire image mosaics (created by Pete Coulter, SDSU Geography Technical Staff). Site 1 - Ortho_subset_1.img 8b1.img Site 2 - Ortho_subset_2.img of 6b1.img Covering Big Dalton Reservoir, North of Big Dalton Reservoir, SDEF San Dimas Experimental Forest (SDEF) The two CIR subset images were classified to identify vegetation and other land cover types within the 2002 Williams fire path. The classes included subshrub, shrub, tree, herbaceous, soil, and built materials. An unsupervised classification process was utilized. I analyzed a 2000 Google Earth image within ERDAS Imagine in order to identify vegetation as subshrub, shrub, tree, herbaceous, and soil with paved streets and concrete areas. Subshrub and herbaceous were combined into one class due to the limited image spatial resolution which prevented identification and separation of these vegetation types. The following unsupervised classification steps were completed for each subset image: (1) Using ERDAS Imagine, selected the ISODATA algorithm choosing 10 iterations and 36 clusters for each subset image’s spectral-radiometric feature, and selected minimum spectral distance to assign clusters or each candidate pixel. Number of ISODATA iterations and clusters selected were based on reviewing prior Firemapping studies, class labs and recommendation from SDSU Geography remote sensing staff. (2) Within the spectral-radiometric feature space of the CIR image chose minimum pixel selection (20) threshold level and minimum cluster size (>.05%).
  • 4. Hill, 3 (3) Using ArcMap 10.3, added the CIR subset images and pixels clusters were classified according to 7 cluster classes (zero classification (0)), soil (1), subshrub/herbaceous (2), shrub (3), tree (4), water (5), built (6), and reclassify (7). Vegetation cluster class labeling was based on visual interpretation of the original CIR imagery in correspondence with the location of pixels for each cluster class. (4) Assigned appropriate information class names or labels to the cluster classes. The assignment of cluster names (cluster labeling) required familiarity with the area of interest. (5) Once classes were assigned values in ERDAS Imagine, unidentified (“reclassified”) complex clusters were reclassified into 15 different clusters using an approach called “cluster-busting” (using a multiple phase approach) by running the unclassified pixels through ISODATA again. This resulted in a vegetation class map of each study site. (6) Within ArcMap, identified and examined the reliability of the vegetation classification using “heads up” visible interpretation based on the original CIR subset image and overlaid the vegetation class map on the ArcMap World Map layer. (7) Overlaid selected USFS fire mosaic images to identify fire intensity based on the vegetation land classifications identified. These fire mosaics demonstrate the fire path occurred from 2:16 to 2:50 on September 23, 2002. (8) Applied color density slice to fire mosaics to identify heat intensity based on DN’s and vegetation classes that assisted in identifying fire frontline and backline fuel composition. Roads, built surfaces and water were also classified to identify unburned areas. (9) Within ArcMap 10.3 using the Zonal Statistics as Table tool, calculated the pixel count and median Celsius temperature for fire front line and back line polygon sampling areas to estimate Sites 1 and 2 specific vegetation class temperatures and their sampling DN density. Results A conjecture was made that certain types of vegetation might burn more intensely than other vegetation, based on the higher DN’s that would also show up in the density slice layer. Red colors represented the highest heat within front fire line, with light yellow to white colors representing the coolest temperatures in the rear fire line. In Image 1, the fire is moving right to left toward the blue area (water within the Big Dalton Reservoir). Site 1 (Ortho_subset_1.img 8b1.img) covers the Big Dalton Reservoir and Site 2 (Ortho_subset_2.img of 6b1.img) lies directly to the northeast of the reservoir.
  • 5. Hill, 4 Classes within the vegetation map layer were color identified as: 1 - Soil 2 – Sub-shrub (herbaceous and sub-shrubbery) 3 – Shrub 4 – Trees 5 – Water 6 – Built (roads, concrete) Site 1 - Overlay fire image at 2:16 PM Site 2 - Overlay fire image at 2:30 PM Big Dalton Reservoir Area, SDEF Northeast of Big Dalton Reservoir Fire mosaic layer with density slice (white to red color range) overlaid on classified vegetation map. Multicolored rectangle polygons within fire mosaic layer identifies sampling areas to measure fire temperature in Celsius.
  • 6. Hill, 5 Site 1 - Overlay fire image at 2:43 PM Big Dalton Reservoir, SDEF Site 1 - Overlay fire image at 2:50 PM Site 2 – Overlay fire image at 2:50 PM Big Dalton Reservoir, SDEF Northeast of Big Dalton Reservoir
  • 7. Hill, 6 Flickering the fire mosaics over the vegetation image layer indicated subshrub provided the greatest concentration of fuel source, followed by shrub and trees. To identify the vegetation type that yielded the highest heat response (in DNs), I used the Raster Statistics Table tool in ArcMap on selected hot spots in both images. Median DN values within the vegetation polygons were measured in degrees Celsius Statistical Analysis Within the fire mosaics, certain areas were selected toward the front and rear of the fire line as polygon samples (see attached Frontline and Backline Fire Mosaic Table). Although the front line highest temperature registered for shrub and trees indicated the highest median temperatures, the majority of fire fuel available came from sub-shrubbery. The back fire line polygons indicated the soil retained hotter median values. These results may indicate smoldering coals and debris with left over from vegetation fuel still burning (subshrub, shrub and trees).
  • 9. Hill, 8 Conclusion From the Unsupervised Classification vegetation map and the statistical tables, it appears trees and shrubs provide fire fuel that can generate the highest heat. However, based on the DN pixel concentration shown in the prior table and by vegetation identification from Google imagery, the greatest concentration of fire fuel provided appears to be from subshrub vegetation. Although subshrub provides a greater availability of fuel source, subshrub does not appear to generate as hot of a fire compared to measured trees and shrub temperatures. Reviewing the table data, frontline areas indicated front line fire temperatures ranging from 157° to 307° Celsius, and back fire line temperatures between 61° to 167° Celsius. Site 1 Clip 16 does not seem to coincide with the other site area measurements, which could be due to site temperature selection error. Results and interpretations of the fire intensity patterns within different vegetation types could also be affected by individual growth form map accuracy, as well as geometric misalignment between both image sets. Remote sensing images at higher resolution of the fire line area before the 2002 Williams fire would improve identification of key fuel fire species. Also, consideration and analysis of the wind, concentration of exposed soil and topography influences must be taken into account and were not analyzed in this project. This analysis aids in identifying how different types of vegetation fueled the 2002 San Dimas fire, however further analysis is required of topography, wind, soil moisture, and daily temperature within the study area.
  • 10. Hill, 9 References ArcMap 10.3 World Map USFS Williams Fire JPEG map - http://www.fireimaging.com/homepage.html Stow, D. A., Riggan, P. J., Storey, E. J., & Coulter, L. L. (2014). Measuring fire spread rates from repeat pass airborne thermal infrared imagery. Remote Sensing Letters, 5(9), 803-812.