Download to read offline

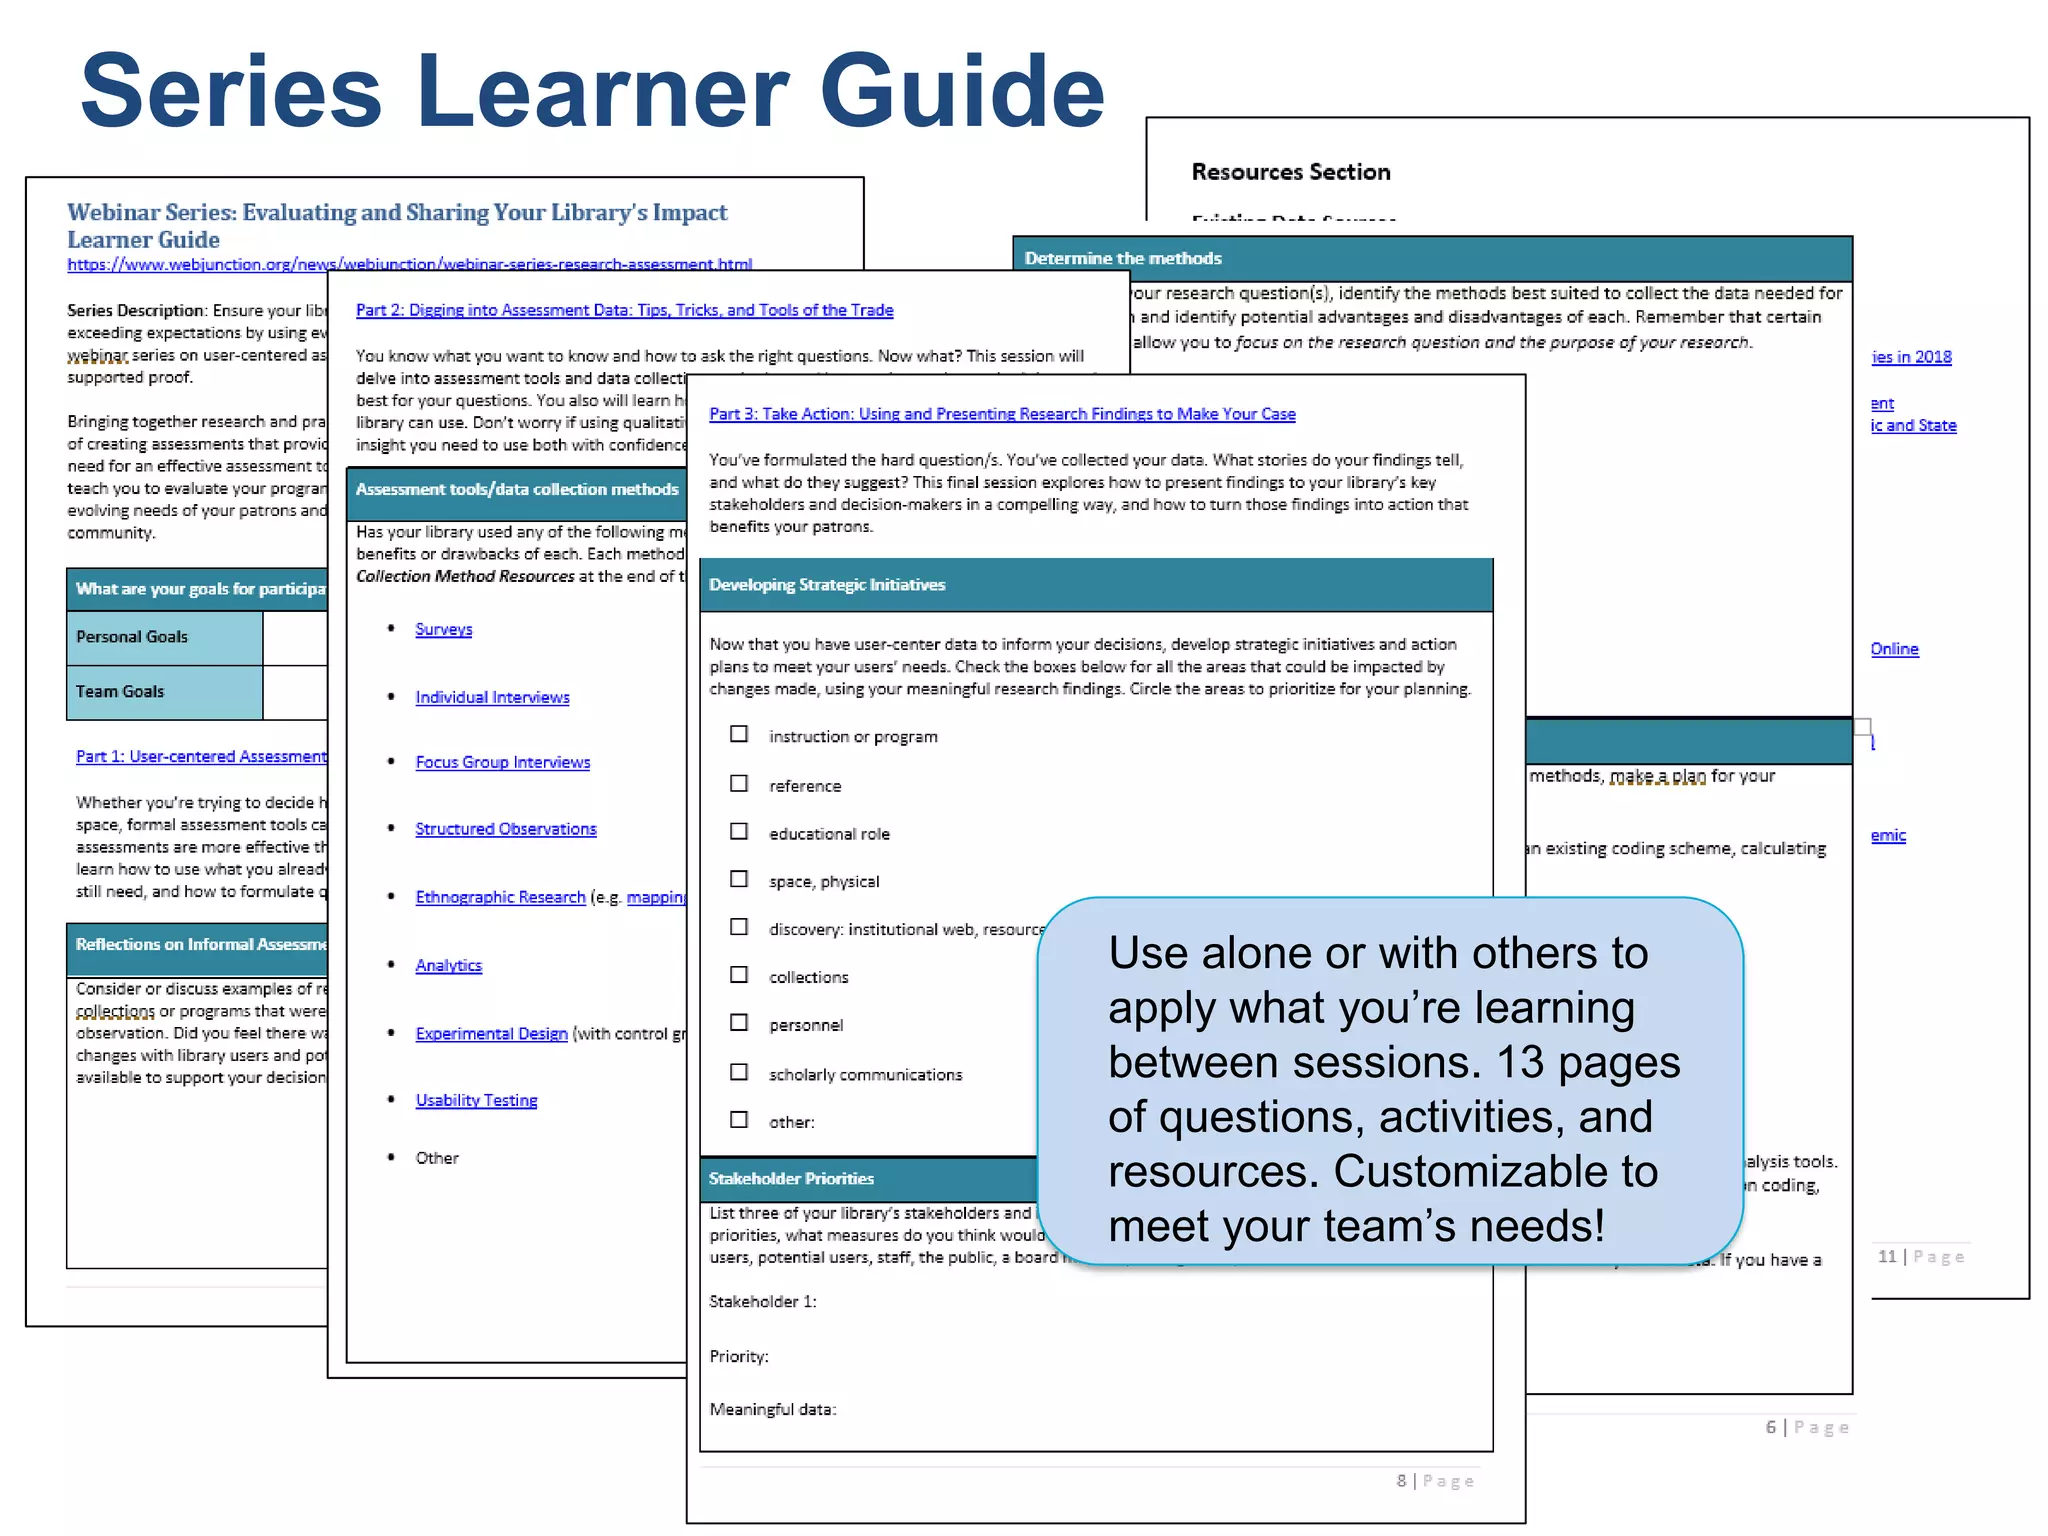
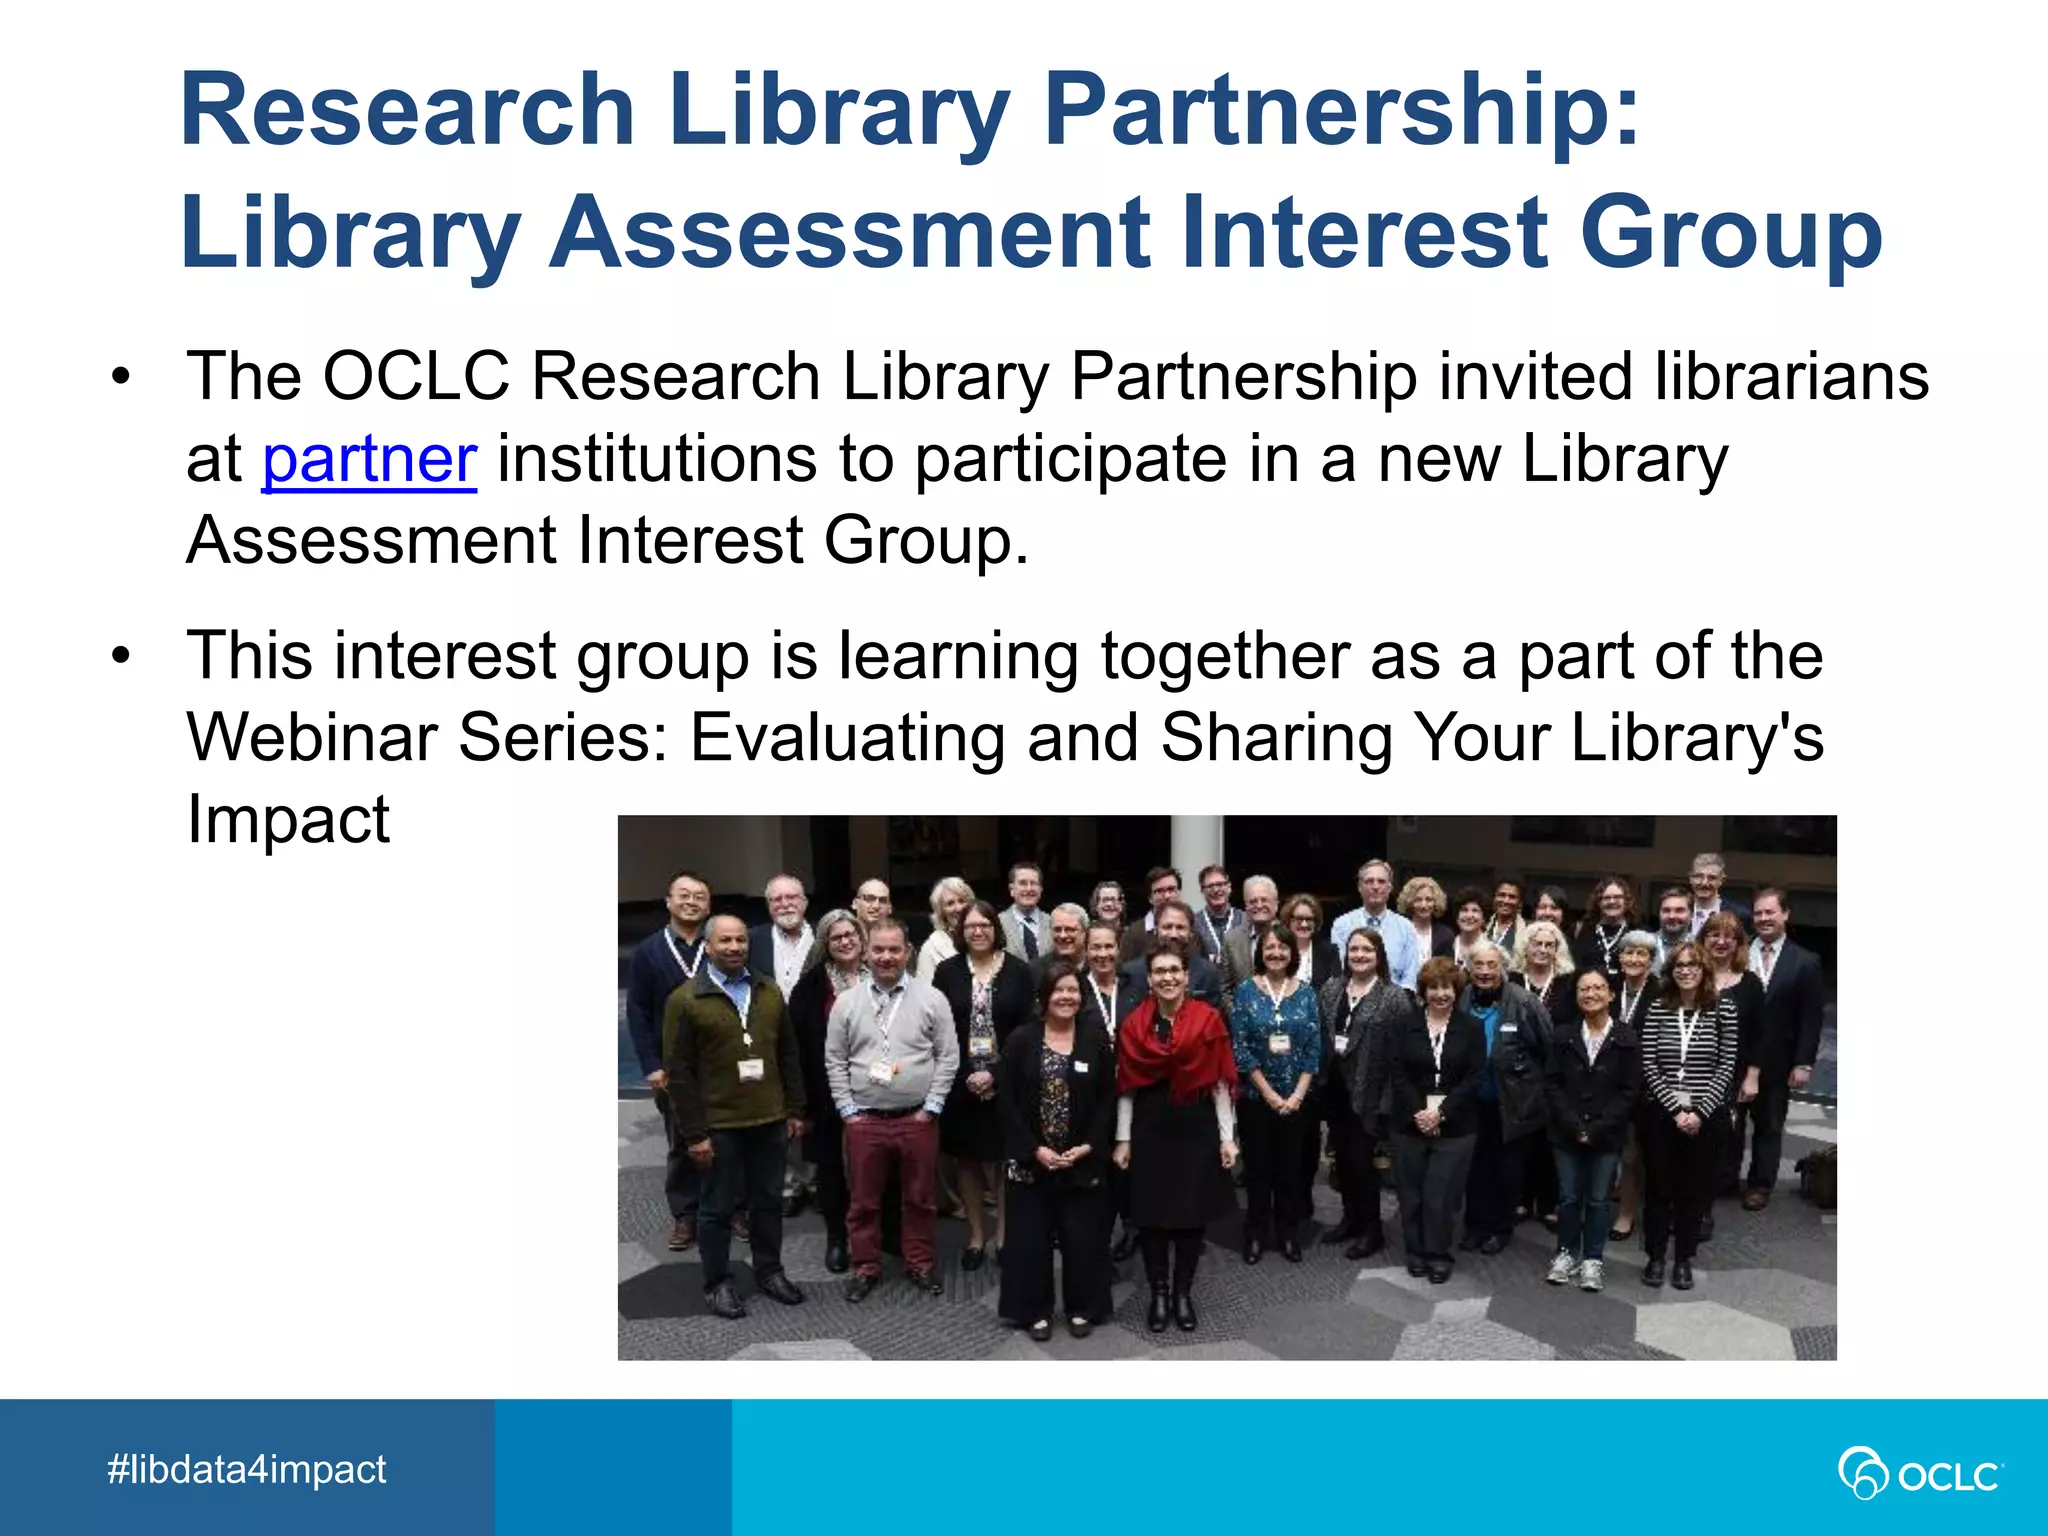
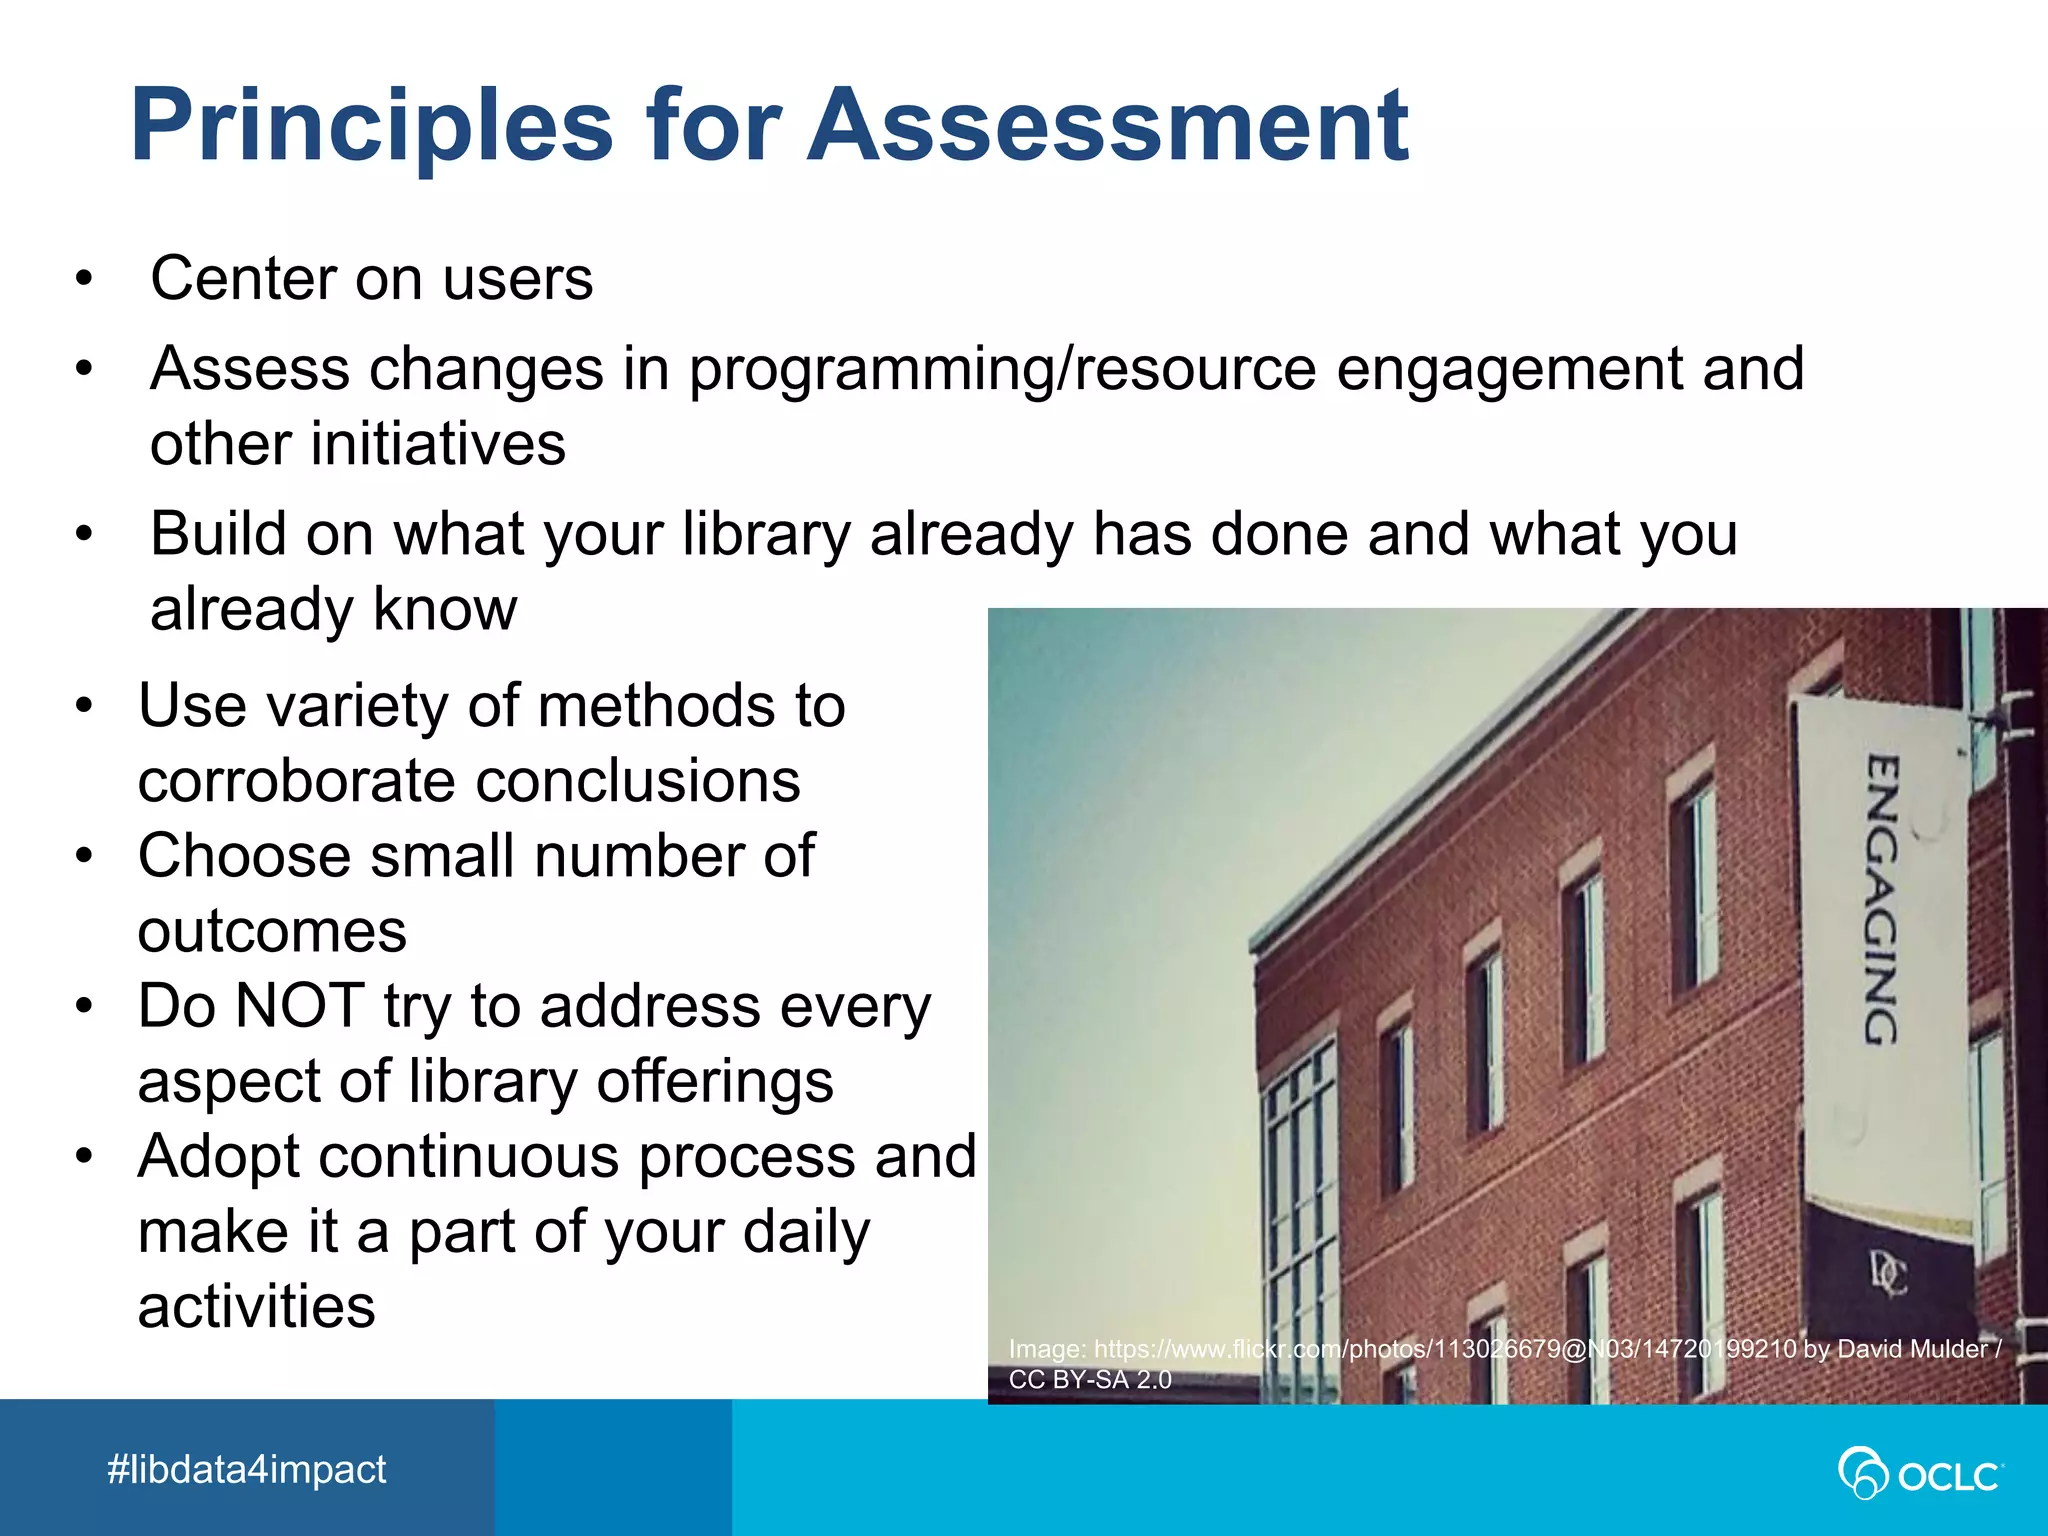

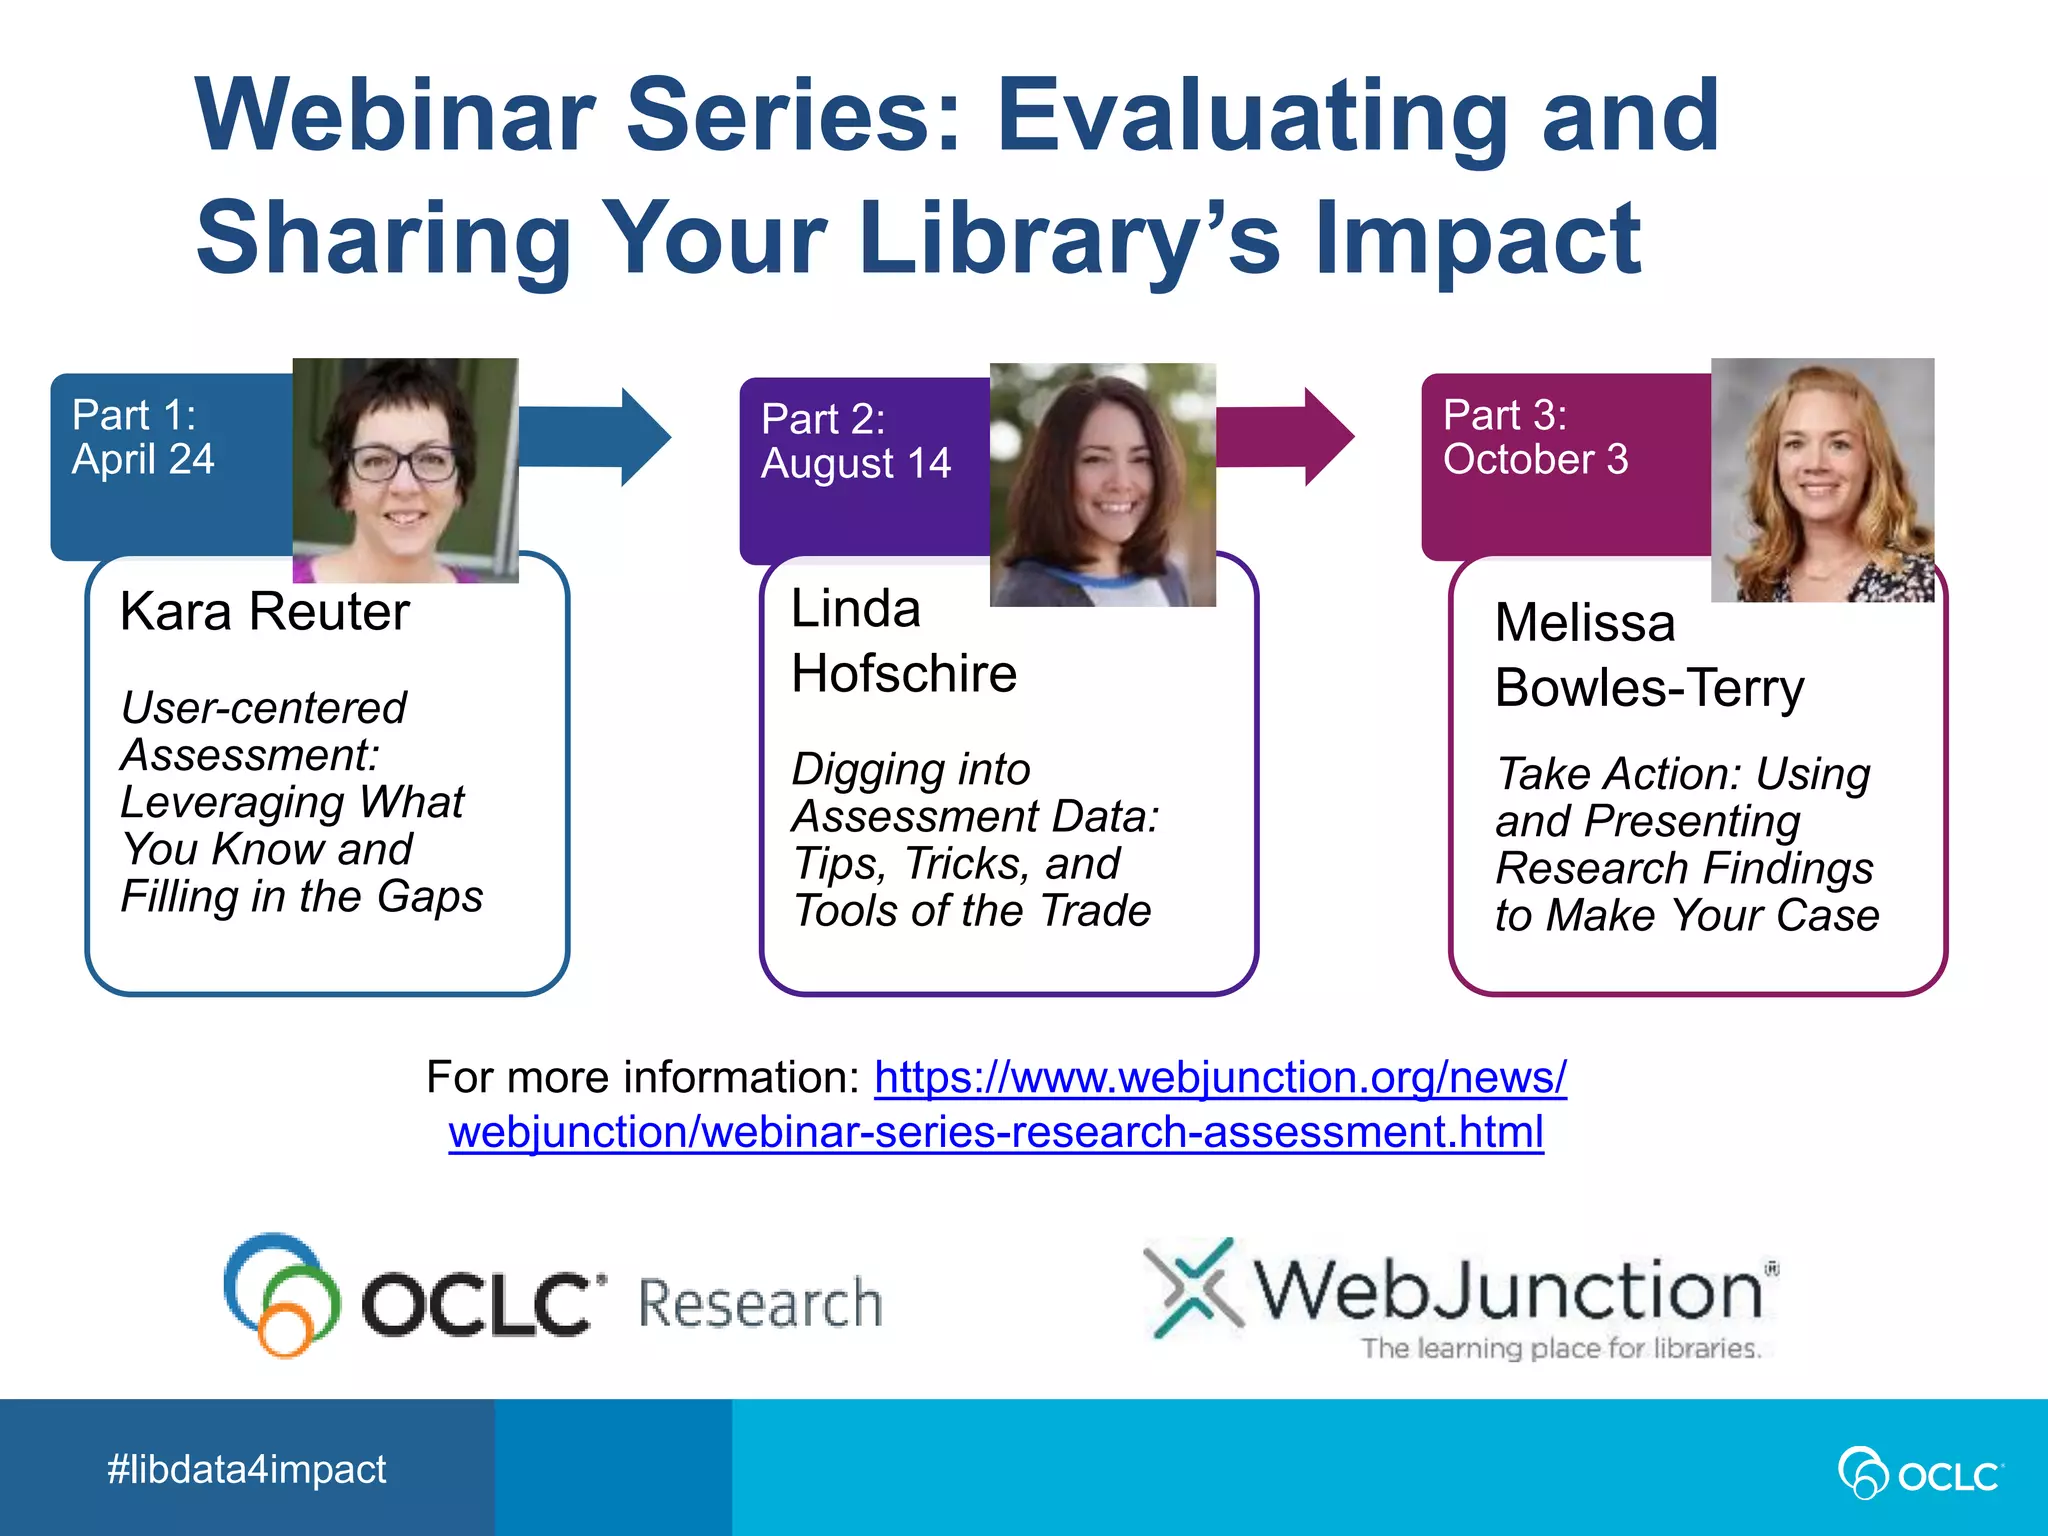

The document outlines a webinar series titled #libdata4impact focused on library assessment and its impact, featuring three sessions led by different experts. It includes guidance on user-centered assessment, data analysis methods, and tips for evaluating library use and programming effectiveness. The series aims to foster collaboration among librarians and provide resources for continuous improvement in library services.


![“It [library tour] wasn’t what do you do when you need to make a literature r...](https://cdn.slidesharecdn.com/ss_thumbnails/iflalacgreece2019connawayfinal-200219213428-thumbnail.jpg?width=640&height=640&fit=bounds)


