Download to read offline

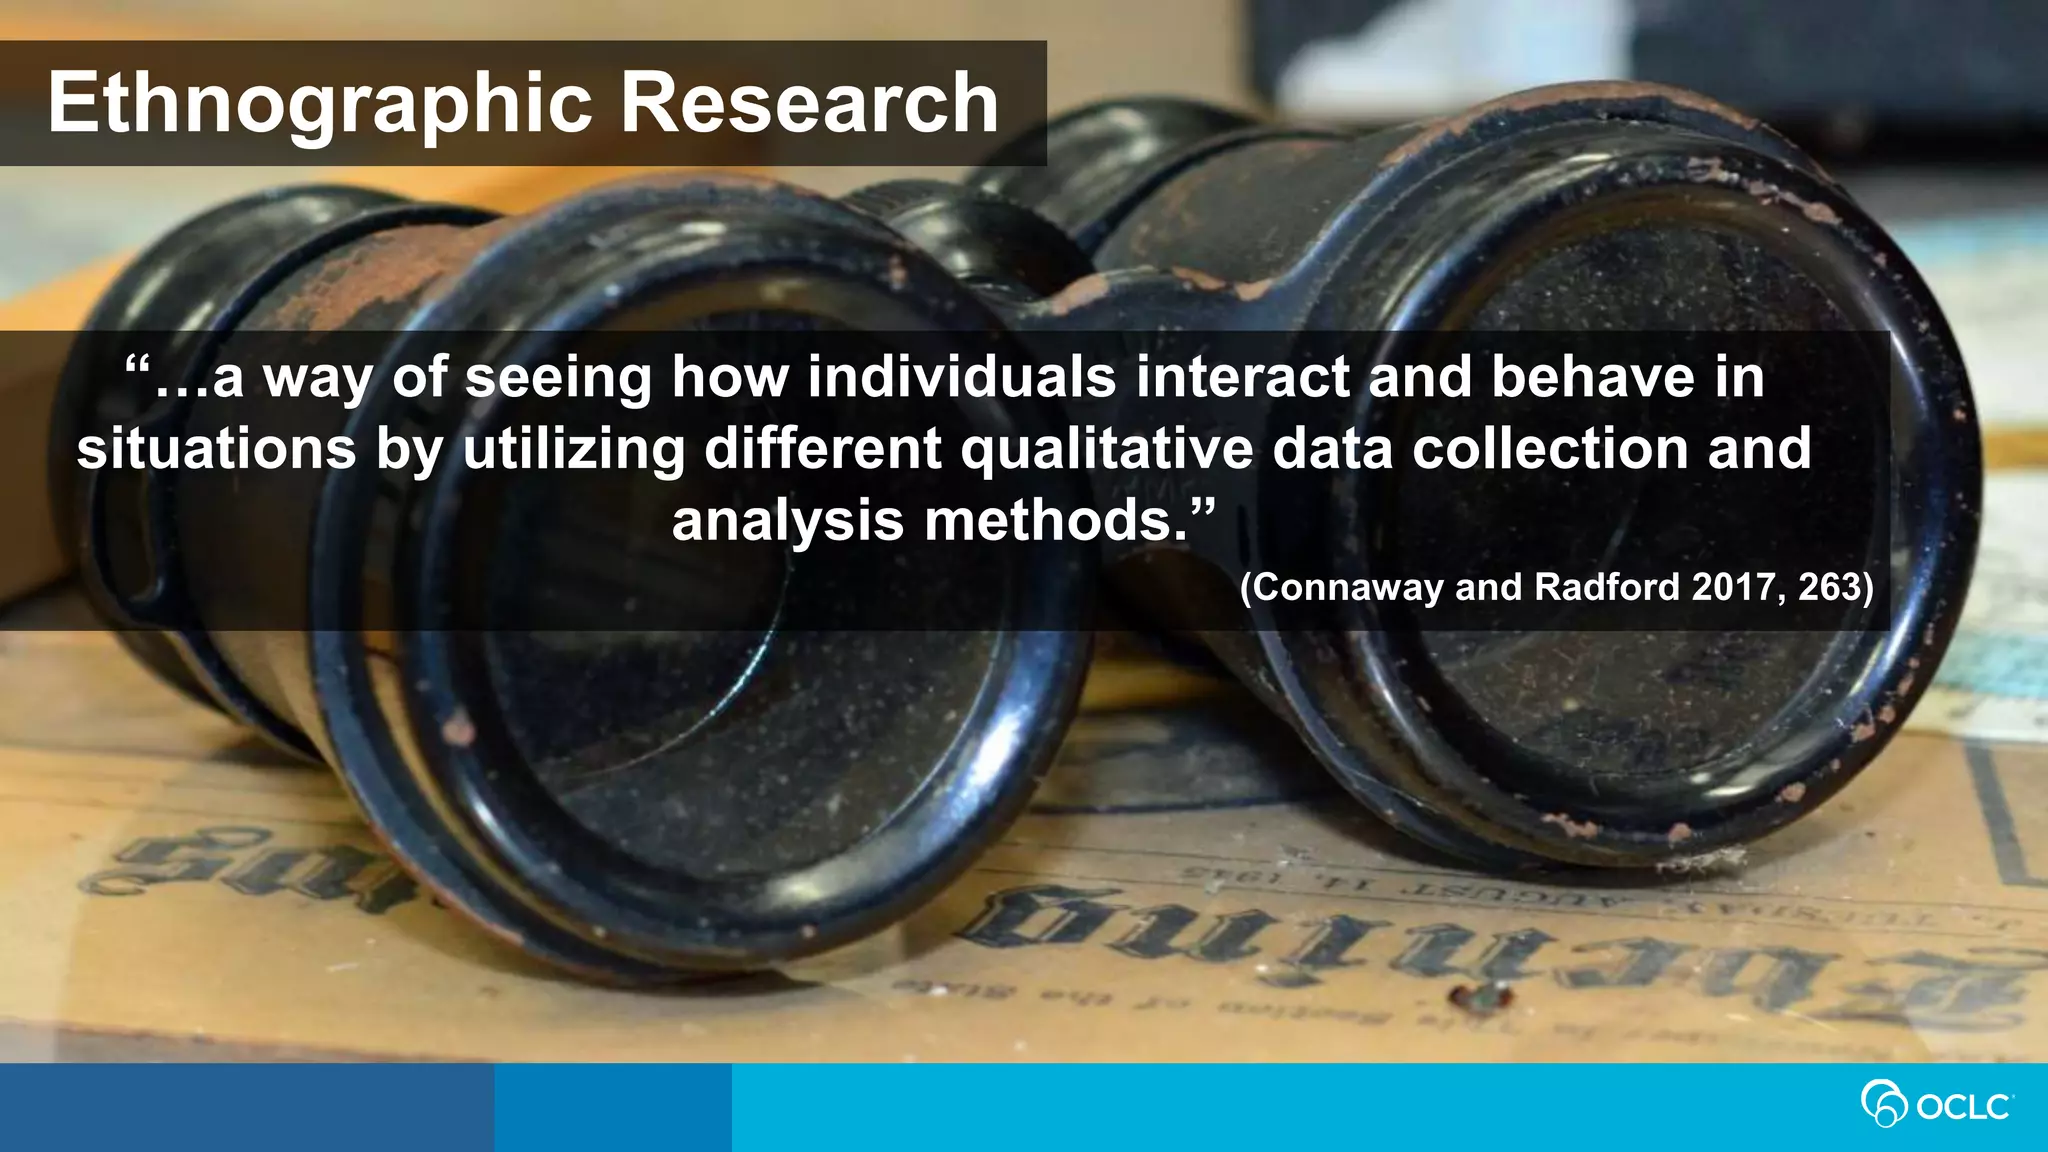
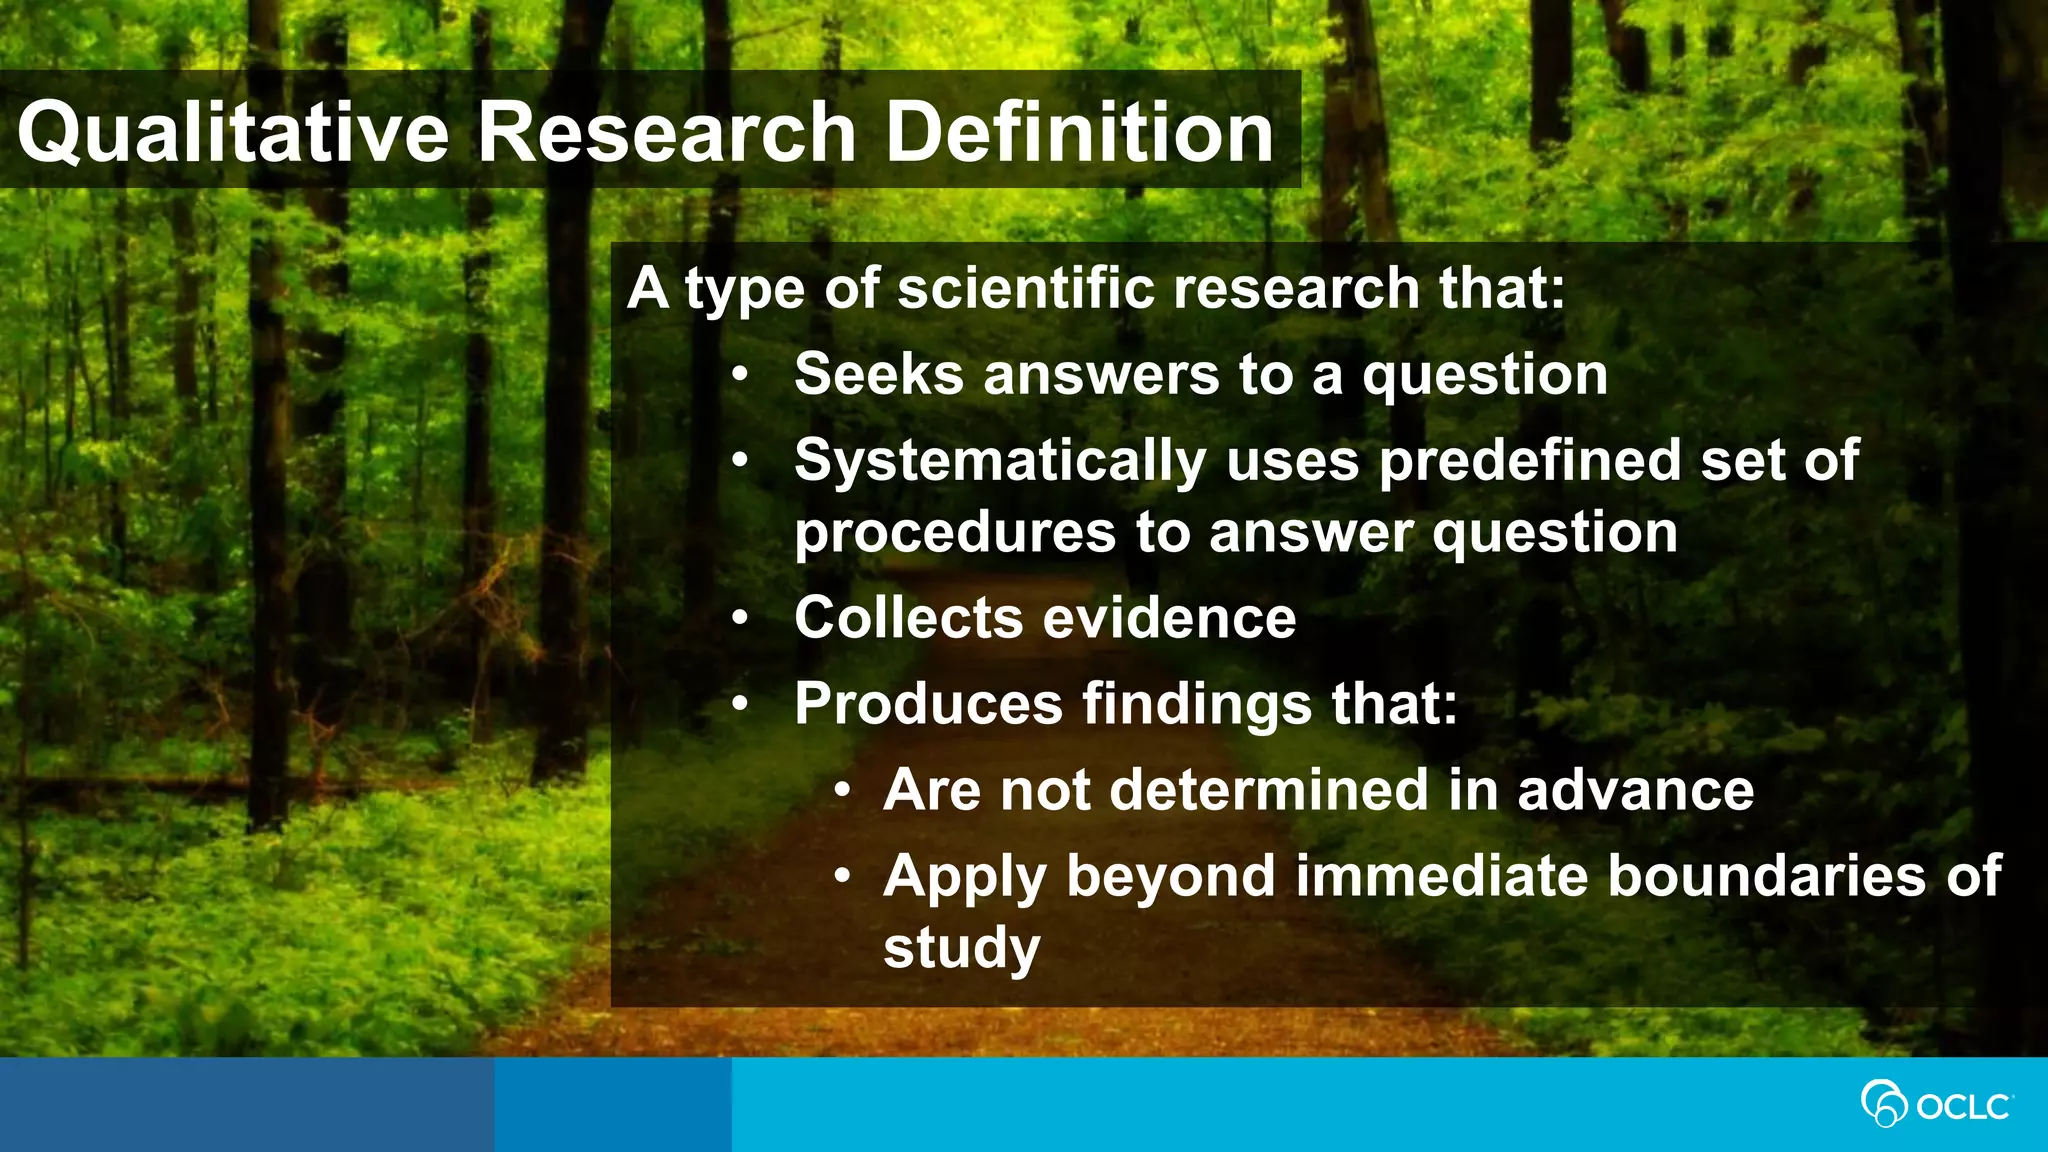

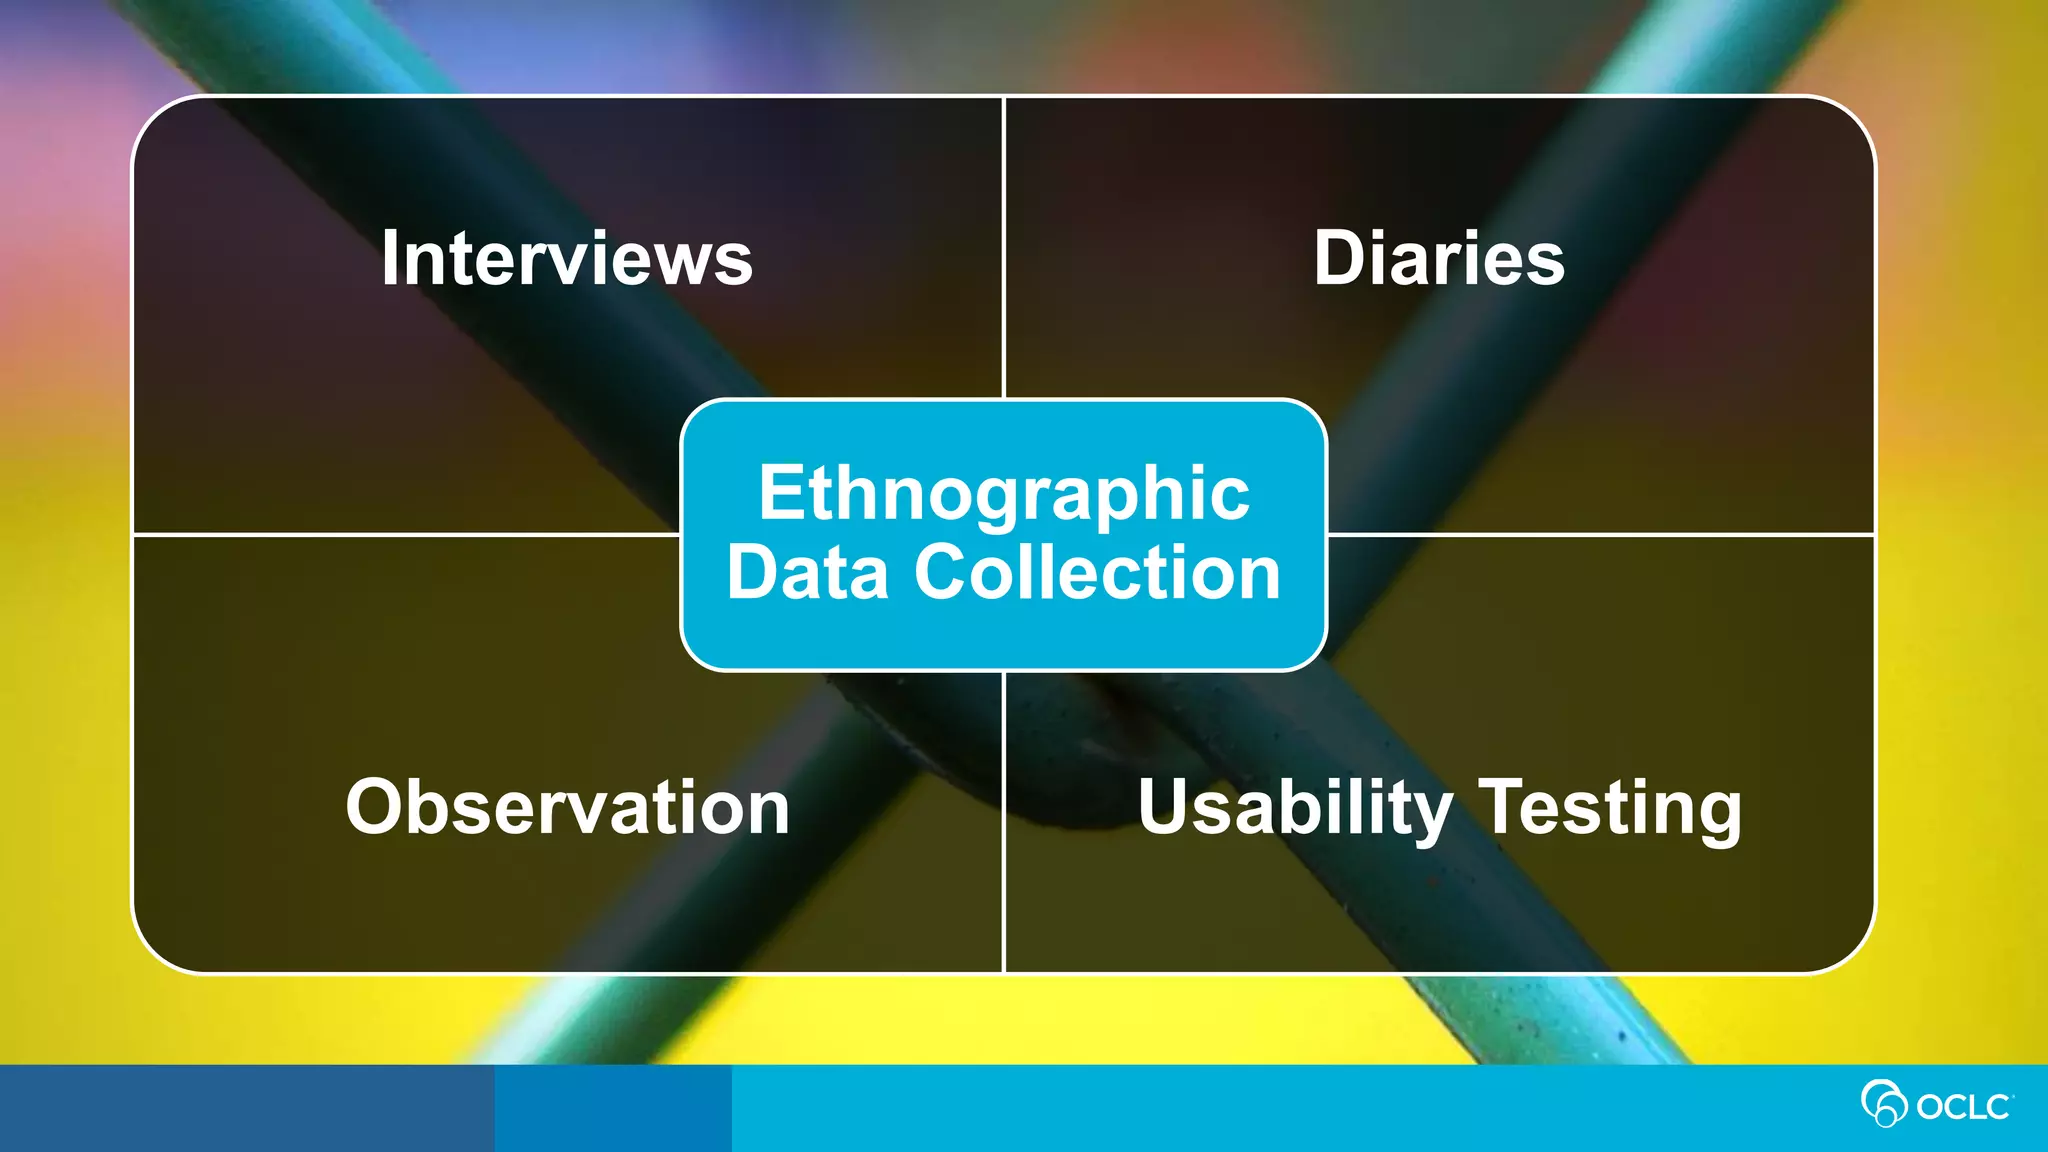


The document discusses the importance and methods of ethnographic research in understanding library user behaviors. It outlines various qualitative data collection techniques such as interviews, diaries, and observations, and highlights the need for systematic data analysis while acknowledging the challenges faced in ethnographic studies. The document emphasizes the richness of data obtained from ethnographic research, which can inform decisions about library resources and services.


![“It [library tour] wasn’t what do you do when you need to make a literature r...](https://cdn.slidesharecdn.com/ss_thumbnails/iflalacgreece2019connawayfinal-200219213428-thumbnail.jpg?width=640&height=640&fit=bounds)


