When Hi-C matrices are collected from two different conditions, methods can compare the matrices to identify regions with significant structural differences between conditions. TADpole and TADcompare are two available methods. TADpole represents hierarchical TAD structures and detects differences by computing a difference index between normalized binarized matrices. TADcompare represents Hi-C matrices as networks and uses the eigenvectors of the graph Laplacian and gap scores to define boundaries and detect differential boundaries between conditions. Both methods were shown to recover known breakpoints and have boundaries enriched for biological marks.


![Evaluation
1. One HiC dataset transformed into 24 HiC matrices (four resolutions 2
normalization + raw data and 12 down-sampling of one of the matrix)
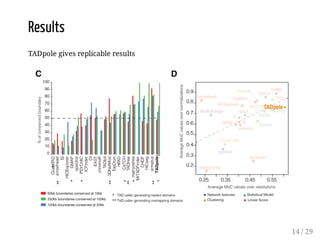
used for: comparing several TAD callers (as in [Zufferey et al, 2018])
by comparing domains accross different resolutions
by measuring the concordance between two partitions (MI measure)
by assessing the computational performances of the tools
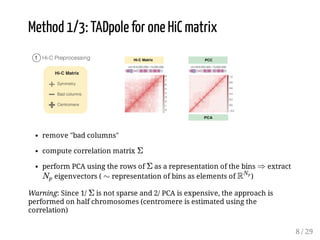
by using biological evidences (histone mark or structural protein profiles,
FC at TAD boundaries, ratio of TAD boundaries hosting a SP, ratio of ChIP-
seq signals in TAD bodies)
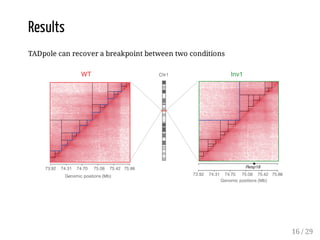
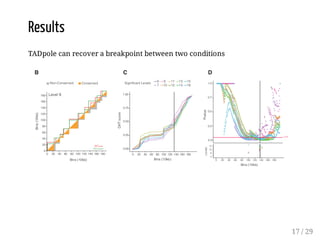
1. Two cHiC experiments (one chromosome, one genomic interval), based
on the two homozygous strains (mouse, embryonic), one WT and one
mutant
×
13 / 29](https://image.slidesharecdn.com/vialaneixchroco2020-11-13-201117174018/85/Differential-analyses-of-structures-in-HiC-data-13-320.jpg)

![Main features
R package available on github (and submitted to Bioconductor)
by the same authors than HicCompare and multiHicCompare (based on
MD corrections)
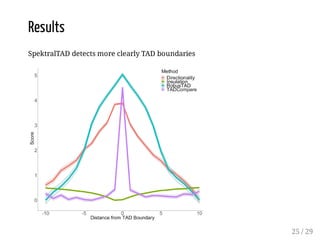
Main purpose of TADcompare: represent the HiC matrices as networks
and derive a bin gap score to detect boundaries (same exact idea than in
[Cresswell et al., 2020] on SpectralTAD). Use that score to derive
differential boundaries
19 / 29](https://image.slidesharecdn.com/vialaneixchroco2020-11-13-201117174018/85/Differential-analyses-of-structures-in-HiC-data-19-320.jpg)
![Method: connexion to spectral clustering
Main idea: HiC matrix is a graph so use tools dedicated to graphs.
Laplacian of a graph: (where is the HiC matrix without
its diagonal and )
Laplacian, graph structure and spectral clustering (see [von Luxburg, 2007]):
eigenvectors associated to eigenvalue 0 gives the connected components
of the graph
L = D
−1/2
HD
1−2
H
D = Diag(1
⊤
p
H)
20 / 29](https://image.slidesharecdn.com/vialaneixchroco2020-11-13-201117174018/85/Differential-analyses-of-structures-in-HiC-data-20-320.jpg)
![Method: connexion to spectral clustering
Main idea: HiC matrix is a graph so use tools dedicated to graphs.
Laplacian of a graph: (where is the HiC matrix
without its diagonal and )
Laplacian, graph structure and spectral clustering (see [von Luxburg, 2007]):
eigenvectors associated to eigenvalue 0 gives the connected components
of the graph
other eigenvalues are and corresponding
eigenvectors provide increasingly noisy information about the main
structures (clusters) in the graph
spectral clustering: take the first eigenvectors (smallest eigenvalues) and
use them as representations of graph nodes (here, bins) in for -means
L = D
−1/2
(D − H)D
1−2
H
D = Diag(1
⊤
p
H)
0 < λ1 < λ2 <. . . < λp−k
d
R
d
k
21 / 29](https://image.slidesharecdn.com/vialaneixchroco2020-11-13-201117174018/85/Differential-analyses-of-structures-in-HiC-data-21-320.jpg)
![TADcompare method
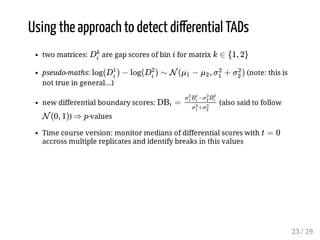
compute eigen-decomposition of and extract the first 2 eigenvectors
(length: )
replace the HiC matrix by a representation of the bins with (so bin
is in , )
cuisine: normalization: (I guess but very unclear in both
articles)
distance between bins and (called gap score of ):
(again, very unclearly written)
magic trick: this is distributed as a log-normal...
boundary scores: (said to follow which is not
true... because would be the proper score)
more cuisine: spectral decomposition is performed with sliding windows
of 15 bins to avoid having to handle a large spectral decomposition
L
(v1 , v2 ) p
[v1 , v2 ]
i R
2
v
i
z
i
=
v
i
∥v
i
∥
i i − 1 i
Di = ∥v
i
− v
i−1
∥
log Di ∼ N (μ, σ) ⇒
Bi =
log Di−μ
σ
2
N (0, 1)
log Di−μ
σ
22 / 29](https://image.slidesharecdn.com/vialaneixchroco2020-11-13-201117174018/85/Differential-analyses-of-structures-in-HiC-data-22-320.jpg)
![Evaluation
The method is evaluated for:
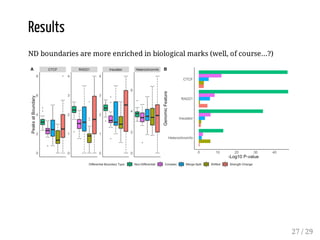
boundary discovery (enrichment in proteins with permutation tests)
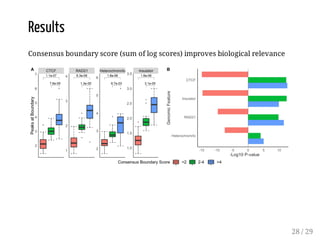
boundary difference discovery (also colocalized boundaries enrichment
with permutation tests)
Data: from [Forcato et al, 2017] (repository), time course data from human
colon cancer cell line at four time points after auxin treatment
Scripts: R package on Bioconductor + scripts in a repository
24 / 29](https://image.slidesharecdn.com/vialaneixchroco2020-11-13-201117174018/85/Differential-analyses-of-structures-in-HiC-data-24-320.jpg)