Analyse comparative dedonnées de génomique 3D
Nathalie Vialaneix
nathalie.vialaneix@inrae.fr
http://www.nathalievialaneix.eu
Séminaire de Statistique de l’IRMAR
22 juin 2025
DNA organization
[Annunziato, 2008]2 meters compressed in 6 µm
[Servant, 2017] adapted from
[Bonev and Cavalli, 2016]
Séminaire Rennes – 2025/06/22
22 juin 2025 / Nathalie Vialaneix
p. 5
8.
Impact on DNAfunctionning [Spielmann et al., 2018]
Séminaire Rennes – 2025/06/22
22 juin 2025 / Nathalie Vialaneix
p. 6
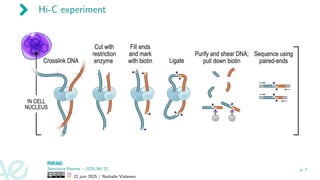
Hi-C data
Images: adaptedfrom [Li et al., 2014] (top) and courtesy of Sylvain Foissac (bottom).
Séminaire Rennes – 2025/06/22
22 juin 2025 / Nathalie Vialaneix
p. 8
11.
Hi-C data
Images: adaptedfrom [Li et al., 2014] (top) and courtesy of Sylvain Foissac (bottom).
Séminaire Rennes – 2025/06/22
22 juin 2025 / Nathalie Vialaneix
p. 8
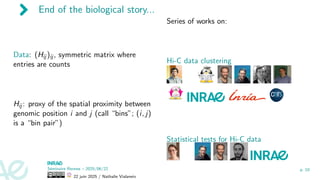
End of thebiological story...
Data: (Hij )ij , symmetric matrix where
entries are counts
Hij : proxy of the spatial proximity between
genomic position i and j (call “bins”; (i, j)
is a “bin pair”)
Series of works on:
Hi-C data clustering
Statistical tests for Hi-C data
Séminaire Rennes – 2025/06/22
22 juin 2025 / Nathalie Vialaneix
p. 10
14.
1. Hi-C matricesand hierarchical clustering [Neuvial et al., 2023]
Idea used in: [Fraser et al., 2015,
Soler-Vila et al., 2020, Zhang et al., 2021b]
among others
Séminaire Rennes – 2025/06/22
22 juin 2025 / Nathalie Vialaneix
p. 11
15.
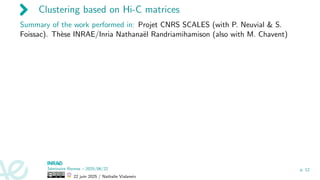
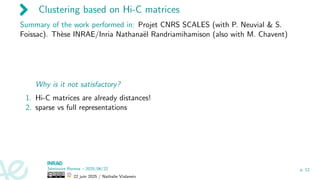
Clustering based onHi-C matrices
Summary of the work performed in: Projet CNRS SCALES (with P. Neuvial & S.
Foissac). Thèse INRAE/Inria Nathanaël Randriamihamison (also with M. Chavent)
Séminaire Rennes – 2025/06/22
22 juin 2025 / Nathalie Vialaneix
p. 12
16.
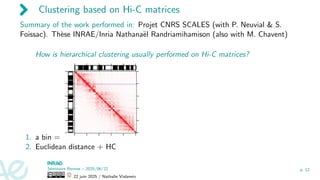
Clustering based onHi-C matrices
Summary of the work performed in: Projet CNRS SCALES (with P. Neuvial & S.
Foissac). Thèse INRAE/Inria Nathanaël Randriamihamison (also with M. Chavent)
How is hierarchical clustering usually performed on Hi-C matrices?
1. a bin =
2. Euclidean distance + HC
Séminaire Rennes – 2025/06/22
22 juin 2025 / Nathalie Vialaneix
p. 12
17.
Clustering based onHi-C matrices
Summary of the work performed in: Projet CNRS SCALES (with P. Neuvial & S.
Foissac). Thèse INRAE/Inria Nathanaël Randriamihamison (also with M. Chavent)
Why is it not satisfactory?
1. Hi-C matrices are already distances!
2. sparse vs full representations
Séminaire Rennes – 2025/06/22
22 juin 2025 / Nathalie Vialaneix
p. 12
18.
Clustering based onHi-C matrices
What did we propose?
1. extend Ward’s HC to similarity matrices as Hi-C with adjacency
constraint [Randriamihamison et al., 2021]
2. study of the mathematical properties
[Randriamihamison et al., 2021]
3. study of reversals in practice on Hi-C matrices
[Randriamihamison et al., 2021]
4. fast version using a band computation [Ambroise et al., 2019],
implemented in the R package adjclust
Séminaire Rennes – 2025/06/22
22 juin 2025 / Nathalie Vialaneix
p. 12
19.
2. Motivation examplefor tests in Hi-C data: Pig3D genome
project
[Marti-Marimon et al., 2018] (courtesy of Sylvain Foissac)
Séminaire Rennes – 2025/06/22
22 juin 2025 / Nathalie Vialaneix
p. 13
20.
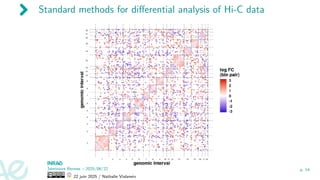
Standard methods fordifferential analysis of Hi-C data
Séminaire Rennes – 2025/06/22
22 juin 2025 / Nathalie Vialaneix
p. 14
21.
Tests for Hi-Cdata
Summary of the work performed in: Thèse INRAE Élise Jorge and INRAE DIGIT-BIO
network “ChrocoNet”.
1. a statistiscal test based on a trees
[Neuvial et al., 2024] + R package treediff
2. a benchmark study for available tests (tools) at
bin pair levels [Jorge et al., 2025]
3. (ongoing) post-hoc inference to enhance
interpretability of these tests + R package
hicream
Séminaire Rennes – 2025/06/22
22 juin 2025 / Nathalie Vialaneix
p. 15
22.
Outline
Biological motivation
Overview ofcontributions
Differential analysis of Hi-C matrices
Séminaire Rennes – 2025/06/22
22 juin 2025 / Nathalie Vialaneix
p. 16
23.
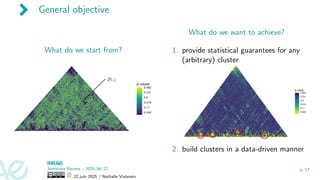
General objective
What dowe start from?
Séminaire Rennes – 2025/06/22
22 juin 2025 / Nathalie Vialaneix
p. 17
24.
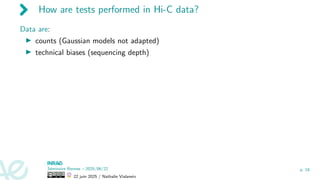
General objective
What dowe start from?
What do we want to achieve?
1. provide statistical guarantees for any
(arbitrary) cluster
2. build clusters in a data-driven manner
Séminaire Rennes – 2025/06/22
22 juin 2025 / Nathalie Vialaneix
p. 17
25.
How are testsperformed in Hi-C data?
Data are:
▶ counts (Gaussian models not adapted)
▶ technical biases (sequencing depth)
Séminaire Rennes – 2025/06/22
22 juin 2025 / Nathalie Vialaneix
p. 18
26.
How are testsperformed in Hi-C data?
Data are:
▶ counts (Gaussian models not adapted)
▶ technical biases (sequencing depth)
diffHic [Lun and Smyth, 2015]
1. normalize data with MA trend correction by cyclic LOESS
Séminaire Rennes – 2025/06/22
22 juin 2025 / Nathalie Vialaneix
p. 18
27.
How are testsperformed in Hi-C data?
Data are:
▶ counts (Gaussian models not adapted)
▶ technical biases (sequencing depth)
diffHic [Lun and Smyth, 2015]
1. normalize data with MA trend correction by cyclic LOESS
2. fit a BN GLM: Hℓ
i,j ∼ BN(λk, ϕi,j,k), k := Condition(ℓ), ϕi,j,k: dispersion
parameter (+ moderated tests)
Séminaire Rennes – 2025/06/22
22 juin 2025 / Nathalie Vialaneix
p. 18
28.
How are testsperformed in Hi-C data?
Data are:
▶ counts (Gaussian models not adapted)
▶ technical biases (sequencing depth)
diffHic [Lun and Smyth, 2015]
1. normalize data with MA trend correction by cyclic LOESS
2. fit a BN GLM: Hℓ
i,j ∼ BN(λk, ϕi,j,k), k := Condition(ℓ), ϕi,j,k: dispersion
parameter (+ moderated tests)
⇒ P = (pij )i,j=1,...,p, i≤j
Séminaire Rennes – 2025/06/22
22 juin 2025 / Nathalie Vialaneix
p. 18
29.
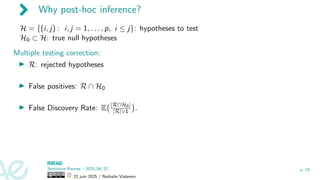
Why post-hoc inference?
H= {(i, j) : i, j = 1, . . . , p, i ≤ j}: hypotheses to test
H0 ⊂ H: true null hypotheses
Multiple testing correction:
▶ R: rejected hypotheses
▶ False positives: R ∩ H0
▶ False Discovery Rate: E |R∩H0|
|R|∨1
.
Séminaire Rennes – 2025/06/22
22 juin 2025 / Nathalie Vialaneix
p. 19
30.
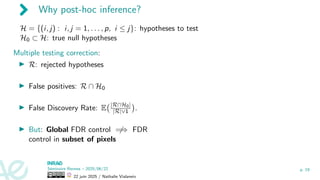
Why post-hoc inference?
H= {(i, j) : i, j = 1, . . . , p, i ≤ j}: hypotheses to test
H0 ⊂ H: true null hypotheses
Multiple testing correction:
▶ R: rejected hypotheses
▶ False positives: R ∩ H0
▶ False Discovery Rate: E |R∩H0|
|R|∨1
.
▶ But: Global FDR control ̸
=⇒ FDR
control in subset of pixels
Séminaire Rennes – 2025/06/22
22 juin 2025 / Nathalie Vialaneix
p. 19
31.
Why post-hoc inference?
H= {(i, j) : i, j = 1, . . . , p, i ≤ j}: hypotheses to test
H0 ⊂ H: true null hypotheses
Multiple testing correction:
▶ R: rejected hypotheses
▶ False positives: R ∩ H0
▶ False Discovery Rate: E |R∩H0|
|R|∨1
.
▶ But: Global FDR control ̸
=⇒ FDR
control in subset of pixels
Post-hoc inference
[Goeman and Solari, 2011]:
▶ For S ⊂ H, quantify
TDP(S) = 1 − |S∩H0|
|S| ?
▶ post-hoc bound Vα : S ⊂ H → R st:
Séminaire Rennes – 2025/06/22
22 juin 2025 / Nathalie Vialaneix
p. 19
32.
Why post-hoc inference?
H= {(i, j) : i, j = 1, . . . , p, i ≤ j}: hypotheses to test
H0 ⊂ H: true null hypotheses
Multiple testing correction:
▶ R: rejected hypotheses
▶ False positives: R ∩ H0
▶ False Discovery Rate: E |R∩H0|
|R|∨1
.
▶ But: Global FDR control ̸
=⇒ FDR
control in subset of pixels
Post-hoc inference
[Goeman and Solari, 2011]:
▶ For S ⊂ H, quantify
TDP(S) = 1 − |S∩H0|
|S| ?
▶ post-hoc bound Vα : S ⊂ H → R st:
P(∀S ⊂ H, |S ∩H0| ≤ Vα(S)) ≥ 1−α
Séminaire Rennes – 2025/06/22
22 juin 2025 / Nathalie Vialaneix
p. 19
33.
Why post-hoc inference?
H= {(i, j) : i, j = 1, . . . , p, i ≤ j}: hypotheses to test
H0 ⊂ H: true null hypotheses
Multiple testing correction:
▶ R: rejected hypotheses
▶ False positives: R ∩ H0
▶ False Discovery Rate: E |R∩H0|
|R|∨1
.
▶ But: Global FDR control ̸
=⇒ FDR
control in subset of pixels
Post-hoc inference
[Goeman and Solari, 2011]:
▶ For S ⊂ H, quantify
TDP(S) = 1 − |S∩H0|
|S| ?
▶ post-hoc bound Vα : S ⊂ H → R st:
P(∀S ⊂ H, TDP(S) ≥ γα(S)) ≥ 1−α
with γα(S) = 1 − Vα
|S| .
Séminaire Rennes – 2025/06/22
22 juin 2025 / Nathalie Vialaneix
p. 19
34.
A very generalpost-hoc bound
Under independence or PRDS [Benjamini and Yekutieli, 2001], Simes’ post hoc bound:
V Simes
α (S) = min
1≤ℓ≤|S|
X
(i,j)∈S
1{pi,j αℓ
m
} + ℓ − 1
is valid [Blanchard et al., 2020].
Séminaire Rennes – 2025/06/22
22 juin 2025 / Nathalie Vialaneix
p. 20
35.
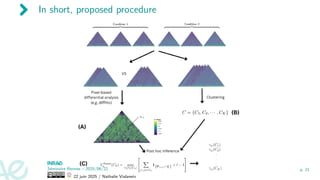
In short, proposedprocedure
Séminaire Rennes – 2025/06/22
22 juin 2025 / Nathalie Vialaneix
p. 21
36.
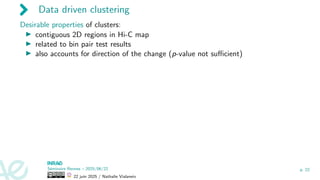
Data driven clustering
Desirableproperties of clusters:
▶ contiguous 2D regions in Hi-C map
▶ related to bin pair test results
▶ also accounts for direction of the change (p-value not sufficient)
Séminaire Rennes – 2025/06/22
22 juin 2025 / Nathalie Vialaneix
p. 22
37.
Data driven clustering
Desirableproperties of clusters:
▶ contiguous 2D regions in Hi-C map
▶ related to bin pair test results
▶ also accounts for direction of the change (p-value not sufficient)
2D constrained hierarchical clustering
[Lebart, 1978, Grimm, 1987, Gordon, 1996, Thirion et al., 2014]
1. Neighboring constraint:
(i, j) and (i′, j′) neighbors ⇐⇒
|i − i′| + |j − j′| = 1
2. Agglomerative clustering based on
hij := (HC1,r1
ij , HC1,r2
i,j , HC1,r3
i,j , HC2,r1
i,j , HC2,r2
i,j , HC2,r3
i,j ) hi−1,j
hi,j−1
hij
hi,j+1
hi+1,j
Séminaire Rennes – 2025/06/22
22 juin 2025 / Nathalie Vialaneix
p. 22
38.
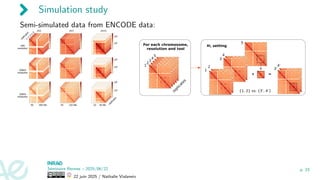
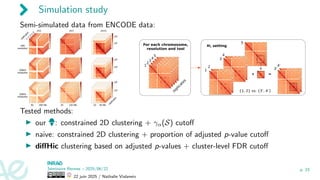
Simulation study
Semi-simulated datafrom ENCODE data:
chr1 chr7 chr21
104
102
104
102
50 200 Mb 20 120 Mb
104
102
10 30 Mb
r
e
p
l
i
c
a
t
e
s
1Mb
resolution
r
e
p
l
i
c
a
t
e
s
500Kb
resolution
200Kb
resolution
1
2
3
4
5
Séminaire Rennes – 2025/06/22
22 juin 2025 / Nathalie Vialaneix
p. 23
39.
Simulation study
Semi-simulated datafrom ENCODE data:
chr1 chr7 chr21
104
102
104
102
50 200 Mb 20 120 Mb
104
102
10 30 Mb
r
e
p
l
i
c
a
t
e
s
1Mb
resolution
r
e
p
l
i
c
a
t
e
s
500Kb
resolution
200Kb
resolution
1
2
3
4
5
Tested methods:
▶ our ã: constrained 2D clustering + γα(S) cutoff
▶ naive: constrained 2D clustering + proportion of adjusted p-value cutoff
▶ diffHic clustering based on adjusted p-values + cluster-level FDR cutoff
Séminaire Rennes – 2025/06/22
22 juin 2025 / Nathalie Vialaneix
p. 23
Application to mousedata
Reference dataset [Bonev et al., 2017]
Mouse neuronal cell differentiation
Séminaire Rennes – 2025/06/22
22 juin 2025 / Nathalie Vialaneix
p. 26
44.
Application to mousedata
Reference dataset [Bonev et al., 2017]
Mouse neuronal cell differentiation
Séminaire Rennes – 2025/06/22
22 juin 2025 / Nathalie Vialaneix
p. 26
45.
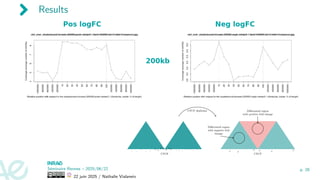
Real dataset withexternal biological knowledge
Data from: [Zhang et al., 2021a] (CTCF depletion study)
image adapted from: [Fudenberg et al., 2016]
Séminaire Rennes – 2025/06/22
22 juin 2025 / Nathalie Vialaneix
p. 27
46.
Results
- -
-
- -+ +
+ + +
++ - - -
- - -
- -
CTCF
CTCF depletion
+ +
+ + +
+
CTCF
Differential region
with negative fold
change
Differential region
with positive fold change
Séminaire Rennes – 2025/06/22
22 juin 2025 / Nathalie Vialaneix
p. 28
47.
Conclusion and perspectives
Takehome messages
▶ Hi-C data are challenging
(hierarchical, spatial and counts)
▶ Post-hoc bound for genomics give
interesting exploratory results with
quantifiable statistical evidence (best
of two worlds)
Séminaire Rennes – 2025/06/22
22 juin 2025 / Nathalie Vialaneix
p. 29
48.
Conclusion and perspectives
Takehome messages
▶ Hi-C data are challenging
(hierarchical, spatial and counts)
▶ Post-hoc bound for genomics give
interesting exploratory results with
quantifiable statistical evidence (best
of two worlds)
What’s next?
▶ Define tighter bounds taking
advantage of the hierarchical structure
▶ Perform clustering and pixel-based
differential analysis together?
Séminaire Rennes – 2025/06/22
22 juin 2025 / Nathalie Vialaneix
p. 29
49.
Conclusion and perspectives
Takehome messages
▶ Hi-C data are challenging
(hierarchical, spatial and counts)
▶ Post-hoc bound for genomics give
interesting exploratory results with
quantifiable statistical evidence (best
of two worlds)
What’s next?
▶ Define tighter bounds taking
advantage of the hierarchical structure
▶ Perform clustering and pixel-based
differential analysis together?
Thank you for your attention!
Questions?
Séminaire Rennes – 2025/06/22
22 juin 2025 / Nathalie Vialaneix
p. 29
50.
References
Ambroise, C., Dehman,A., Neuvial, P., Rigaill, G., and Vialaneix, N. (2019).
Adjacency-constrained hierarchical clustering of a band similarity matrix with application to genomics.
Algorithms for Molecular Biology, 14:22.
Annunziato, A. T. (2008).
DNA packaging: nucleosome and chromatin.
Nature Education, 1(1):26.
Barillot, E., Calzone, L., Hupé, P., Vert, J.-P., and Zinovyev, A. (2012).
Computational Systems Biology of Cancer.
CRC Press.
Benjamini, Y. and Yekutieli, D. (2001).
The control of the false discovery rate in multiple testing under dependency.
Annals of Statistics, 29(4):1165–1188.
Blanchard, G., Neuvial, P., and Roquain, E. (2020).
Post hoc confidence bounds on false positives using reference families.
The Annals of Statistics, 48(3):1281–1303.
Bonev, B. and Cavalli, G. (2016).
Organization and function of the 3D genome.
Nature Reviews Genetics, 17(11):661–678.
Bonev, B., Cohen, N. M., Szabo, Q., Fritsch, L., Papadopoulos, G. L., Lubling, Y., Xu, X., Lv, X., Hugnot, J.-P., Tanay, A., and Cavalli, G.
(2017).
Multiscale 3D genome rewiring during mouse neural development.
Cell, 171(3):557–572.e24.
Séminaire Rennes – 2025/06/22
22 juin 2025 / Nathalie Vialaneix
p. 29
51.
Fraser, J., Ferrai,C., Chiariello, A. M., Schueler, M., Rito, T., Laudanno, G., Barbieri, M., Moore, B. L., Kraemer, D. C., Aitken, S., Xie,
S. Q., Morris, K. J., Itoh, M., Kawaji, H., Jaeger, I., Hayashizaki, Y., Carninci, P., Forrest, A. R., The FANTOM Consortium, Semple, C. A.,
Dostie, J., Pombo, A., and Nicodemi, M. (2015).
Hierarchical folding and reorganization of chromosomes are linked to transcriptional changes in cellular differentiation.
Molecular Systems Biology, 11:852.
Fudenberg, G., Imakaev, M., Lu, C., Goloborodko, A., Abdennur, N., and Mirny, L. (2016).
Formation of chromosomal domains by loop extrusion.
Cell Reports, 15(9):2038–2049.
Goeman, J. J. and Solari, A. (2011).
Multiple testing for exploratory research.
Statistical Science, 26(4):584–597.
Gordon, A. (1996).
A survey of constrained classification.
Computational Statistics Data Analysis, 21(1):17–29.
Grimm, E. C. (1987).
CONISS: a FORTRAN 77 program for stratigraphically constrained analysis by the method of incremental sum of squares.
Computers Geosciences, 13(1):13–35.
Jorge, E., Foissac, S., Neuvial, P., Zytnicki, M., and Vialaneix, N. (2025).
A comprehensive review and benchmark of differential analysis tools for Hi-C data.
Briefings in Bioinformatics, 26(2):bbaf074.
Lebart, L. (1978).
Programme d’agrégation avec contraintes.
Les Cahiers de l’Analyse des Données, 3(3):275–287.
Séminaire Rennes – 2025/06/22
22 juin 2025 / Nathalie Vialaneix
p. 29
52.
Li, G., Cai,L., Chang, H., Hong, P., Zhou, Q., Kulakova, E. V., Kolchanov, N. A., and Ruan, Y. (2014).
Chromatin interaction analysis with paired-end tag (ChIA-PET) sequencing technology and application.
BMC Genomics, 15(Suppl 12):S11.
Lun, A. T. and Smyth, G. K. (2015).
diffHic: a Bioconductor package to detect differential genomic interactions in Hi-C data.
BMC Bioinformatics, 16:258.
Marti-Marimon, M., Vialaneix, N., Voillet, V., Yerle-Bouissou, M., Lahbib-Mansais, Y., and Liaubet, L. (2018).
A new approach of gene co-expression network inference reveals significant biological processes involved in porcine muscle development in late
gestation.
Scientific Report, 8:10150.
Neuvial, P., Foissac, S., and Vialaneix, N. (2023).
Comprendre l’organisation spatiale de l’ADN à l’aide de la statistique.
In Knoop, M., Blanc, S., and Bouzeghoub, M., editors, L’Interdisciplinarité. Voyage au-del‘a des Disciplines, pages 172–176. CNRS.
Neuvial, P., Randriamihamison, N., Chavent, M., Foissac, S., and Vialaneix, N. (2024).
A two-sample tree-based test for hierarchically organized genomic signals.
Journal of the Royal Statistical Society, Series C, page qlae011.
Pramanik, D., Shelake, R. M., Kim, M. J., and Kim, J.-Y. (2021).
CRISPR-mediated engineering across the central dogma in plant biology for basic research and crop improvement.
Molecular Plant, 14(1):127–150.
Randriamihamison, N., Vialaneix, N., and Neuvial, P. (2021).
Applicability and interpretability of Ward’s hierarchical agglomerative clustering with or without contiguity constraints.
Journal of Classification, 38:363–389.
Servant, N. (2017).
Séminaire Rennes – 2025/06/22
22 juin 2025 / Nathalie Vialaneix
p. 29
53.
Analyse de donnéesde conformation chromosomique et application au cancer.
Phd thesis, Université Paris 6.
Soler-Vila, P., Cuscó, P., Farabella, I., Di Stefano, M., and Marti-Renon, M. A. (2020).
Hierarchical chromatin organization detected by TADpole.
Nucleic Acids Research, 45(7):e39.
Spielmann, M., Lupiáñez, D. G., and Mundlos, S. (2018).
Structural variation in the 3D genome.
Nature Reviews Genetics, 19(7):453–467.
Thirion, B., Varoquaux, G., Dohmatob, E., and Poline, J.-B. (2014).
Which fMRI clustering gives good brain parcellations?
Frontiers in Neuroscience, 8:167.
Zhang, H., Lam, J., Zhang, D., Lan, Y., Vermunt, M. W., Keller, C. A., Giardine, B., Hardison, R. C., and Blobel, G. A. (2021a).
CTCF and transcription influence chromatin structure re-configuration after mitosis.
Nature Communications, 12:5157.
Zhang, Y. W., Wang, M. B., and Li, S. C. (2021b).
SuperTAD: robust detection of hierarchical topologically associated domains with optimized structural information.
Genome Biology, 22:45.
Séminaire Rennes – 2025/06/22
22 juin 2025 / Nathalie Vialaneix
p. 29

![Molecular biology dogma
[Barillot et al., 2012]
Séminaire Rennes – 2025/06/22
22 juin 2025 / Nathalie Vialaneix
p. 3](https://image.slidesharecdn.com/2025-06-22seminairerennes-250702083127-cf656f93/85/Analyse-comparative-de-donnees-de-genomique-3D-3-320.jpg)
![Molecular biology dogma... and beyond
[Barillot et al., 2012]
[Pramanik et al., 2021]
Séminaire Rennes – 2025/06/22
22 juin 2025 / Nathalie Vialaneix
p. 4](https://image.slidesharecdn.com/2025-06-22seminairerennes-250702083127-cf656f93/85/Analyse-comparative-de-donnees-de-genomique-3D-4-320.jpg)
![Molecular biology dogma... and beyond
[Barillot et al., 2012]
[Pramanik et al., 2021]
Séminaire Rennes – 2025/06/22
22 juin 2025 / Nathalie Vialaneix
p. 4](https://image.slidesharecdn.com/2025-06-22seminairerennes-250702083127-cf656f93/85/Analyse-comparative-de-donnees-de-genomique-3D-5-320.jpg)
![DNA organization
[Annunziato, 2008] 2 meters compressed in 6 µm
Séminaire Rennes – 2025/06/22
22 juin 2025 / Nathalie Vialaneix
p. 5](https://image.slidesharecdn.com/2025-06-22seminairerennes-250702083127-cf656f93/85/Analyse-comparative-de-donnees-de-genomique-3D-6-320.jpg)
![DNA organization
[Annunziato, 2008] 2 meters compressed in 6 µm
[Servant, 2017] adapted from
[Bonev and Cavalli, 2016]
Séminaire Rennes – 2025/06/22
22 juin 2025 / Nathalie Vialaneix
p. 5](https://image.slidesharecdn.com/2025-06-22seminairerennes-250702083127-cf656f93/85/Analyse-comparative-de-donnees-de-genomique-3D-7-320.jpg)
![Impact on DNA functionning [Spielmann et al., 2018]
Séminaire Rennes – 2025/06/22
22 juin 2025 / Nathalie Vialaneix
p. 6](https://image.slidesharecdn.com/2025-06-22seminairerennes-250702083127-cf656f93/85/Analyse-comparative-de-donnees-de-genomique-3D-8-320.jpg)
![Hi-C data
Images: adapted from [Li et al., 2014] (top) and courtesy of Sylvain Foissac (bottom).
Séminaire Rennes – 2025/06/22
22 juin 2025 / Nathalie Vialaneix
p. 8](https://image.slidesharecdn.com/2025-06-22seminairerennes-250702083127-cf656f93/85/Analyse-comparative-de-donnees-de-genomique-3D-10-320.jpg)
![Hi-C data
Images: adapted from [Li et al., 2014] (top) and courtesy of Sylvain Foissac (bottom).
Séminaire Rennes – 2025/06/22
22 juin 2025 / Nathalie Vialaneix
p. 8](https://image.slidesharecdn.com/2025-06-22seminairerennes-250702083127-cf656f93/85/Analyse-comparative-de-donnees-de-genomique-3D-11-320.jpg)

![1. Hi-C matrices and hierarchical clustering [Neuvial et al., 2023]
Idea used in: [Fraser et al., 2015,
Soler-Vila et al., 2020, Zhang et al., 2021b]
among others
Séminaire Rennes – 2025/06/22
22 juin 2025 / Nathalie Vialaneix
p. 11](https://image.slidesharecdn.com/2025-06-22seminairerennes-250702083127-cf656f93/85/Analyse-comparative-de-donnees-de-genomique-3D-14-320.jpg)
![Clustering based on Hi-C matrices
What did we propose?
1. extend Ward’s HC to similarity matrices as Hi-C with adjacency
constraint [Randriamihamison et al., 2021]
2. study of the mathematical properties
[Randriamihamison et al., 2021]
3. study of reversals in practice on Hi-C matrices
[Randriamihamison et al., 2021]
4. fast version using a band computation [Ambroise et al., 2019],
implemented in the R package adjclust
Séminaire Rennes – 2025/06/22
22 juin 2025 / Nathalie Vialaneix
p. 12](https://image.slidesharecdn.com/2025-06-22seminairerennes-250702083127-cf656f93/85/Analyse-comparative-de-donnees-de-genomique-3D-18-320.jpg)
![2. Motivation example for tests in Hi-C data: Pig3D genome
project
[Marti-Marimon et al., 2018] (courtesy of Sylvain Foissac)
Séminaire Rennes – 2025/06/22
22 juin 2025 / Nathalie Vialaneix
p. 13](https://image.slidesharecdn.com/2025-06-22seminairerennes-250702083127-cf656f93/85/Analyse-comparative-de-donnees-de-genomique-3D-19-320.jpg)
![Tests for Hi-C data
Summary of the work performed in: Thèse INRAE Élise Jorge and INRAE DIGIT-BIO
network “ChrocoNet”.
1. a statistiscal test based on a trees
[Neuvial et al., 2024] + R package treediff
2. a benchmark study for available tests (tools) at
bin pair levels [Jorge et al., 2025]
3. (ongoing) post-hoc inference to enhance
interpretability of these tests + R package
hicream
Séminaire Rennes – 2025/06/22
22 juin 2025 / Nathalie Vialaneix
p. 15](https://image.slidesharecdn.com/2025-06-22seminairerennes-250702083127-cf656f93/85/Analyse-comparative-de-donnees-de-genomique-3D-21-320.jpg)


![How are tests performed in Hi-C data?
Data are:
▶ counts (Gaussian models not adapted)
▶ technical biases (sequencing depth)
diffHic [Lun and Smyth, 2015]
1. normalize data with MA trend correction by cyclic LOESS
Séminaire Rennes – 2025/06/22
22 juin 2025 / Nathalie Vialaneix
p. 18](https://image.slidesharecdn.com/2025-06-22seminairerennes-250702083127-cf656f93/85/Analyse-comparative-de-donnees-de-genomique-3D-26-320.jpg)
![How are tests performed in Hi-C data?
Data are:
▶ counts (Gaussian models not adapted)
▶ technical biases (sequencing depth)
diffHic [Lun and Smyth, 2015]
1. normalize data with MA trend correction by cyclic LOESS
2. fit a BN GLM: Hℓ
i,j ∼ BN(λk, ϕi,j,k), k := Condition(ℓ), ϕi,j,k: dispersion
parameter (+ moderated tests)
Séminaire Rennes – 2025/06/22
22 juin 2025 / Nathalie Vialaneix
p. 18](https://image.slidesharecdn.com/2025-06-22seminairerennes-250702083127-cf656f93/85/Analyse-comparative-de-donnees-de-genomique-3D-27-320.jpg)
![How are tests performed in Hi-C data?
Data are:
▶ counts (Gaussian models not adapted)
▶ technical biases (sequencing depth)
diffHic [Lun and Smyth, 2015]
1. normalize data with MA trend correction by cyclic LOESS
2. fit a BN GLM: Hℓ
i,j ∼ BN(λk, ϕi,j,k), k := Condition(ℓ), ϕi,j,k: dispersion
parameter (+ moderated tests)
⇒ P = (pij )i,j=1,...,p, i≤j
Séminaire Rennes – 2025/06/22
22 juin 2025 / Nathalie Vialaneix
p. 18](https://image.slidesharecdn.com/2025-06-22seminairerennes-250702083127-cf656f93/85/Analyse-comparative-de-donnees-de-genomique-3D-28-320.jpg)
![Why post-hoc inference?
H = {(i, j) : i, j = 1, . . . , p, i ≤ j}: hypotheses to test
H0 ⊂ H: true null hypotheses
Multiple testing correction:
▶ R: rejected hypotheses
▶ False positives: R ∩ H0
▶ False Discovery Rate: E |R∩H0|
|R|∨1
.
▶ But: Global FDR control ̸
=⇒ FDR
control in subset of pixels
Post-hoc inference
[Goeman and Solari, 2011]:
▶ For S ⊂ H, quantify
TDP(S) = 1 − |S∩H0|
|S| ?
▶ post-hoc bound Vα : S ⊂ H → R st:
Séminaire Rennes – 2025/06/22
22 juin 2025 / Nathalie Vialaneix
p. 19](https://image.slidesharecdn.com/2025-06-22seminairerennes-250702083127-cf656f93/85/Analyse-comparative-de-donnees-de-genomique-3D-31-320.jpg)
![Why post-hoc inference?
H = {(i, j) : i, j = 1, . . . , p, i ≤ j}: hypotheses to test
H0 ⊂ H: true null hypotheses
Multiple testing correction:
▶ R: rejected hypotheses
▶ False positives: R ∩ H0
▶ False Discovery Rate: E |R∩H0|
|R|∨1
.
▶ But: Global FDR control ̸
=⇒ FDR
control in subset of pixels
Post-hoc inference
[Goeman and Solari, 2011]:
▶ For S ⊂ H, quantify
TDP(S) = 1 − |S∩H0|
|S| ?
▶ post-hoc bound Vα : S ⊂ H → R st:
P(∀S ⊂ H, |S ∩H0| ≤ Vα(S)) ≥ 1−α
Séminaire Rennes – 2025/06/22
22 juin 2025 / Nathalie Vialaneix
p. 19](https://image.slidesharecdn.com/2025-06-22seminairerennes-250702083127-cf656f93/85/Analyse-comparative-de-donnees-de-genomique-3D-32-320.jpg)
![Why post-hoc inference?
H = {(i, j) : i, j = 1, . . . , p, i ≤ j}: hypotheses to test
H0 ⊂ H: true null hypotheses
Multiple testing correction:
▶ R: rejected hypotheses
▶ False positives: R ∩ H0
▶ False Discovery Rate: E |R∩H0|
|R|∨1
.
▶ But: Global FDR control ̸
=⇒ FDR
control in subset of pixels
Post-hoc inference
[Goeman and Solari, 2011]:
▶ For S ⊂ H, quantify
TDP(S) = 1 − |S∩H0|
|S| ?
▶ post-hoc bound Vα : S ⊂ H → R st:
P(∀S ⊂ H, TDP(S) ≥ γα(S)) ≥ 1−α
with γα(S) = 1 − Vα
|S| .
Séminaire Rennes – 2025/06/22
22 juin 2025 / Nathalie Vialaneix
p. 19](https://image.slidesharecdn.com/2025-06-22seminairerennes-250702083127-cf656f93/85/Analyse-comparative-de-donnees-de-genomique-3D-33-320.jpg)
![A very general post-hoc bound
Under independence or PRDS [Benjamini and Yekutieli, 2001], Simes’ post hoc bound:
V Simes
α (S) = min
1≤ℓ≤|S|
X
(i,j)∈S
1{pi,j αℓ
m
} + ℓ − 1
is valid [Blanchard et al., 2020].
Séminaire Rennes – 2025/06/22
22 juin 2025 / Nathalie Vialaneix
p. 20](https://image.slidesharecdn.com/2025-06-22seminairerennes-250702083127-cf656f93/85/Analyse-comparative-de-donnees-de-genomique-3D-34-320.jpg)
![Data driven clustering
Desirable properties of clusters:
▶ contiguous 2D regions in Hi-C map
▶ related to bin pair test results
▶ also accounts for direction of the change (p-value not sufficient)
2D constrained hierarchical clustering
[Lebart, 1978, Grimm, 1987, Gordon, 1996, Thirion et al., 2014]
1. Neighboring constraint:
(i, j) and (i′, j′) neighbors ⇐⇒
|i − i′| + |j − j′| = 1
2. Agglomerative clustering based on
hij := (HC1,r1
ij , HC1,r2
i,j , HC1,r3
i,j , HC2,r1
i,j , HC2,r2
i,j , HC2,r3
i,j ) hi−1,j
hi,j−1
hij
hi,j+1
hi+1,j
Séminaire Rennes – 2025/06/22
22 juin 2025 / Nathalie Vialaneix
p. 22](https://image.slidesharecdn.com/2025-06-22seminairerennes-250702083127-cf656f93/85/Analyse-comparative-de-donnees-de-genomique-3D-37-320.jpg)
![Application to mouse data
Reference dataset [Bonev et al., 2017]
Mouse neuronal cell differentiation
Séminaire Rennes – 2025/06/22
22 juin 2025 / Nathalie Vialaneix
p. 26](https://image.slidesharecdn.com/2025-06-22seminairerennes-250702083127-cf656f93/85/Analyse-comparative-de-donnees-de-genomique-3D-43-320.jpg)
![Application to mouse data
Reference dataset [Bonev et al., 2017]
Mouse neuronal cell differentiation
Séminaire Rennes – 2025/06/22
22 juin 2025 / Nathalie Vialaneix
p. 26](https://image.slidesharecdn.com/2025-06-22seminairerennes-250702083127-cf656f93/85/Analyse-comparative-de-donnees-de-genomique-3D-44-320.jpg)
![Real dataset with external biological knowledge
Data from: [Zhang et al., 2021a] (CTCF depletion study)
image adapted from: [Fudenberg et al., 2016]
Séminaire Rennes – 2025/06/22
22 juin 2025 / Nathalie Vialaneix
p. 27](https://image.slidesharecdn.com/2025-06-22seminairerennes-250702083127-cf656f93/85/Analyse-comparative-de-donnees-de-genomique-3D-45-320.jpg)