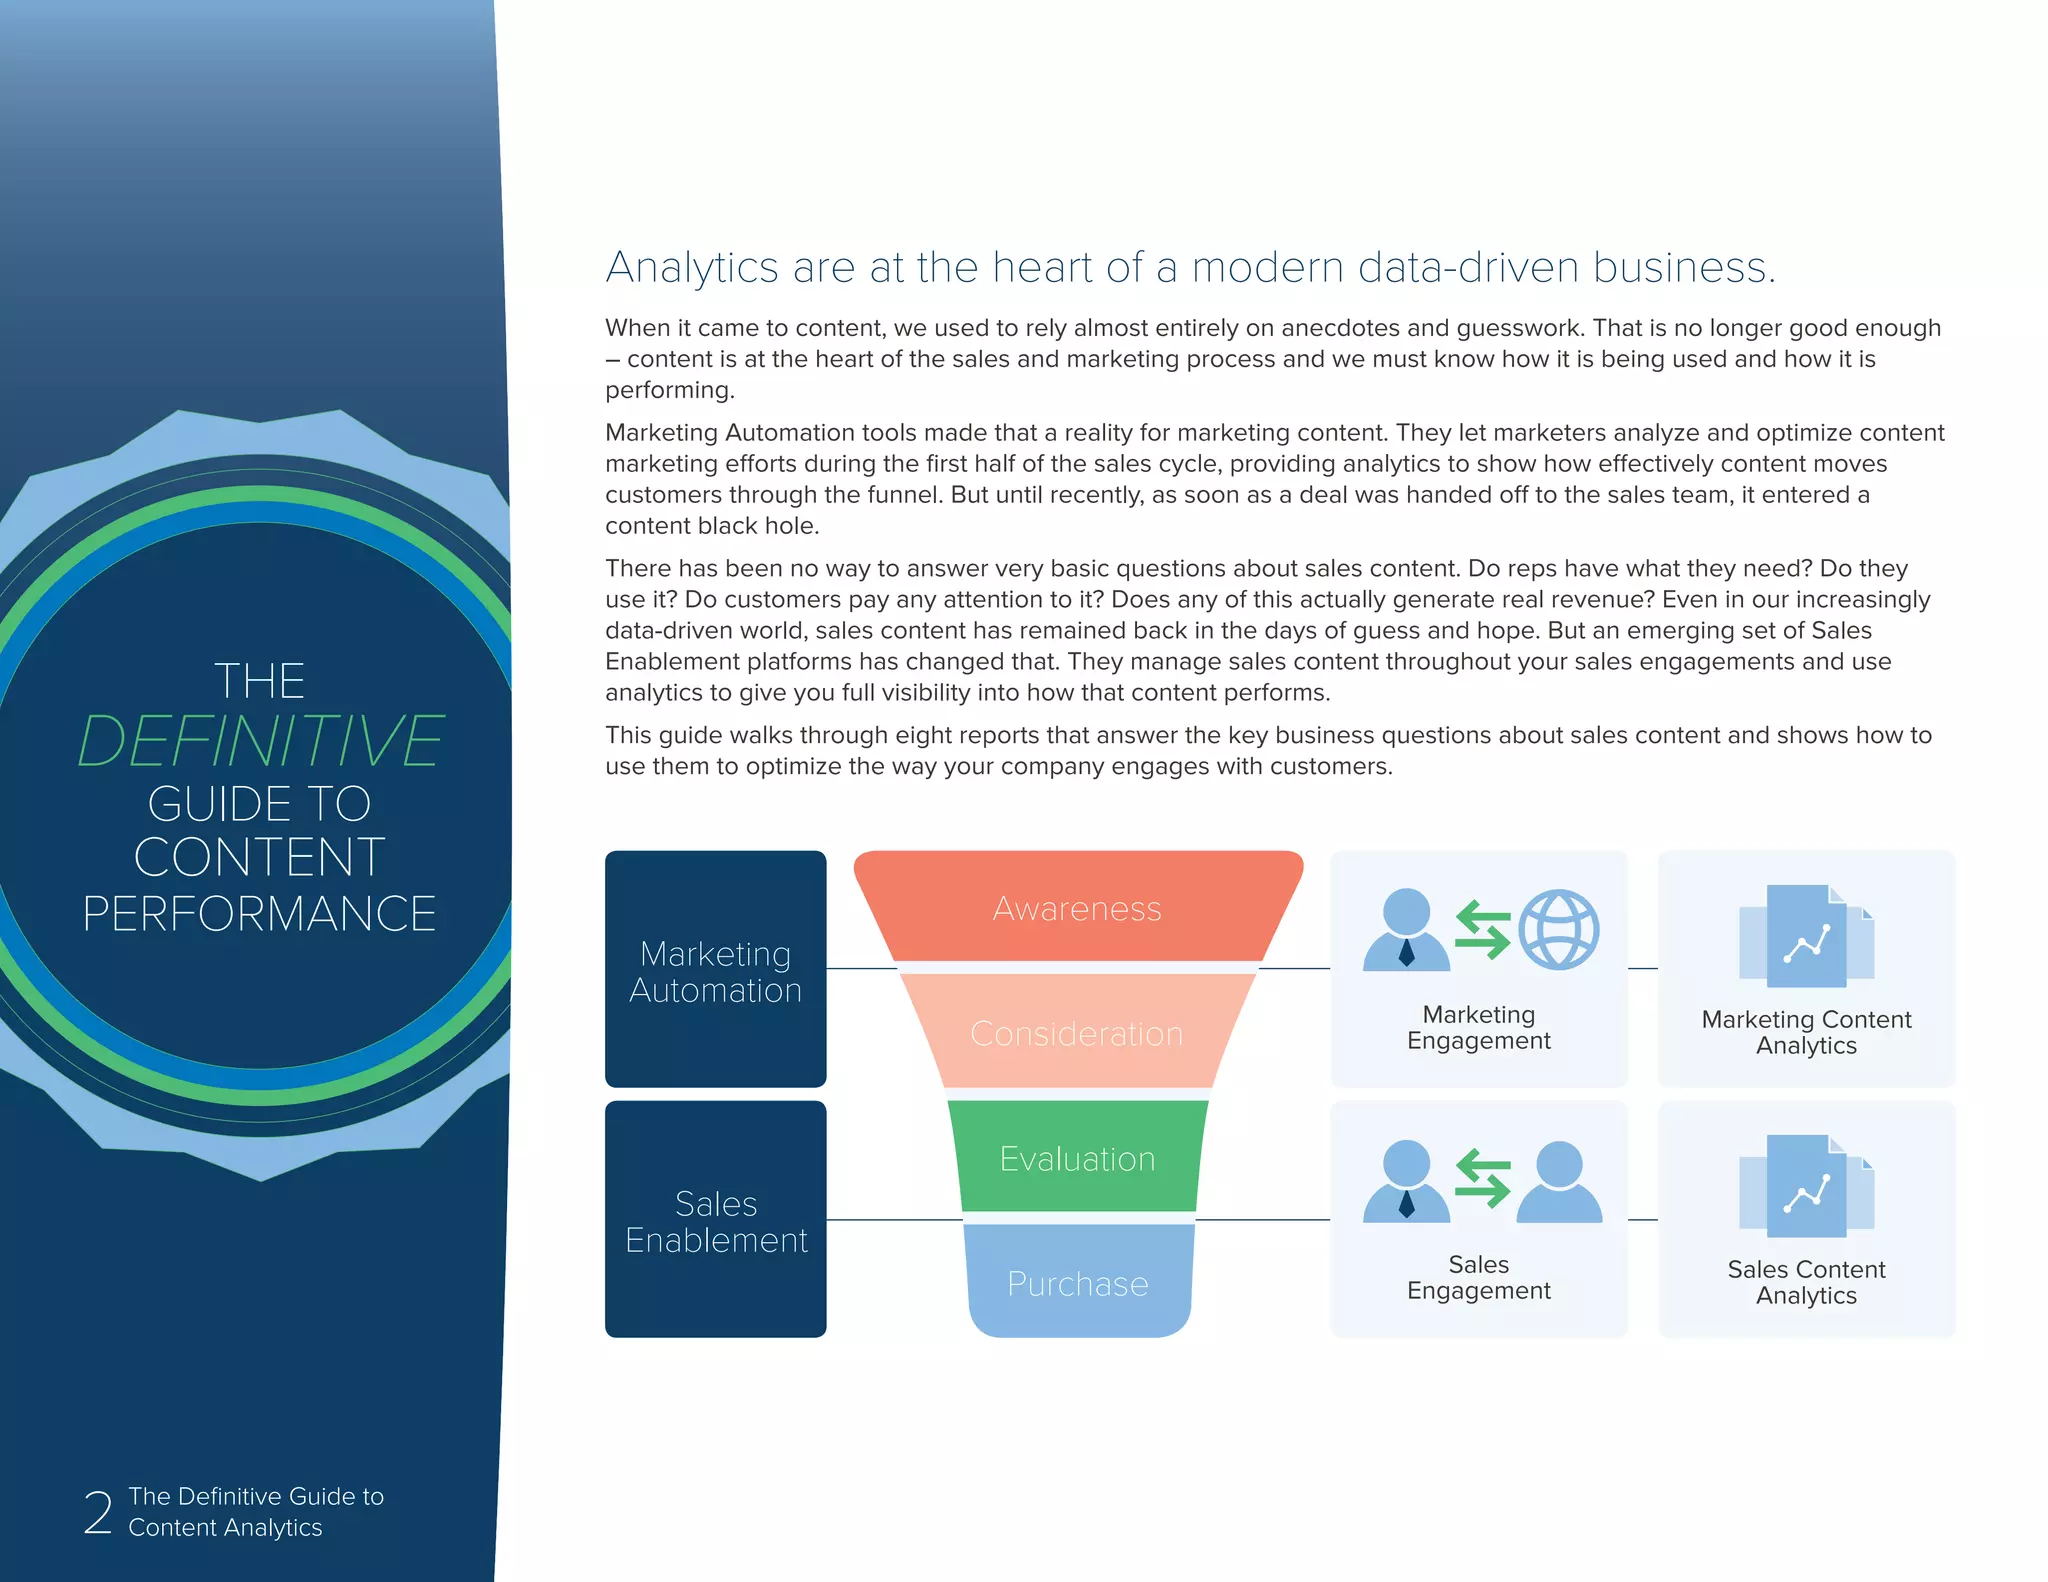
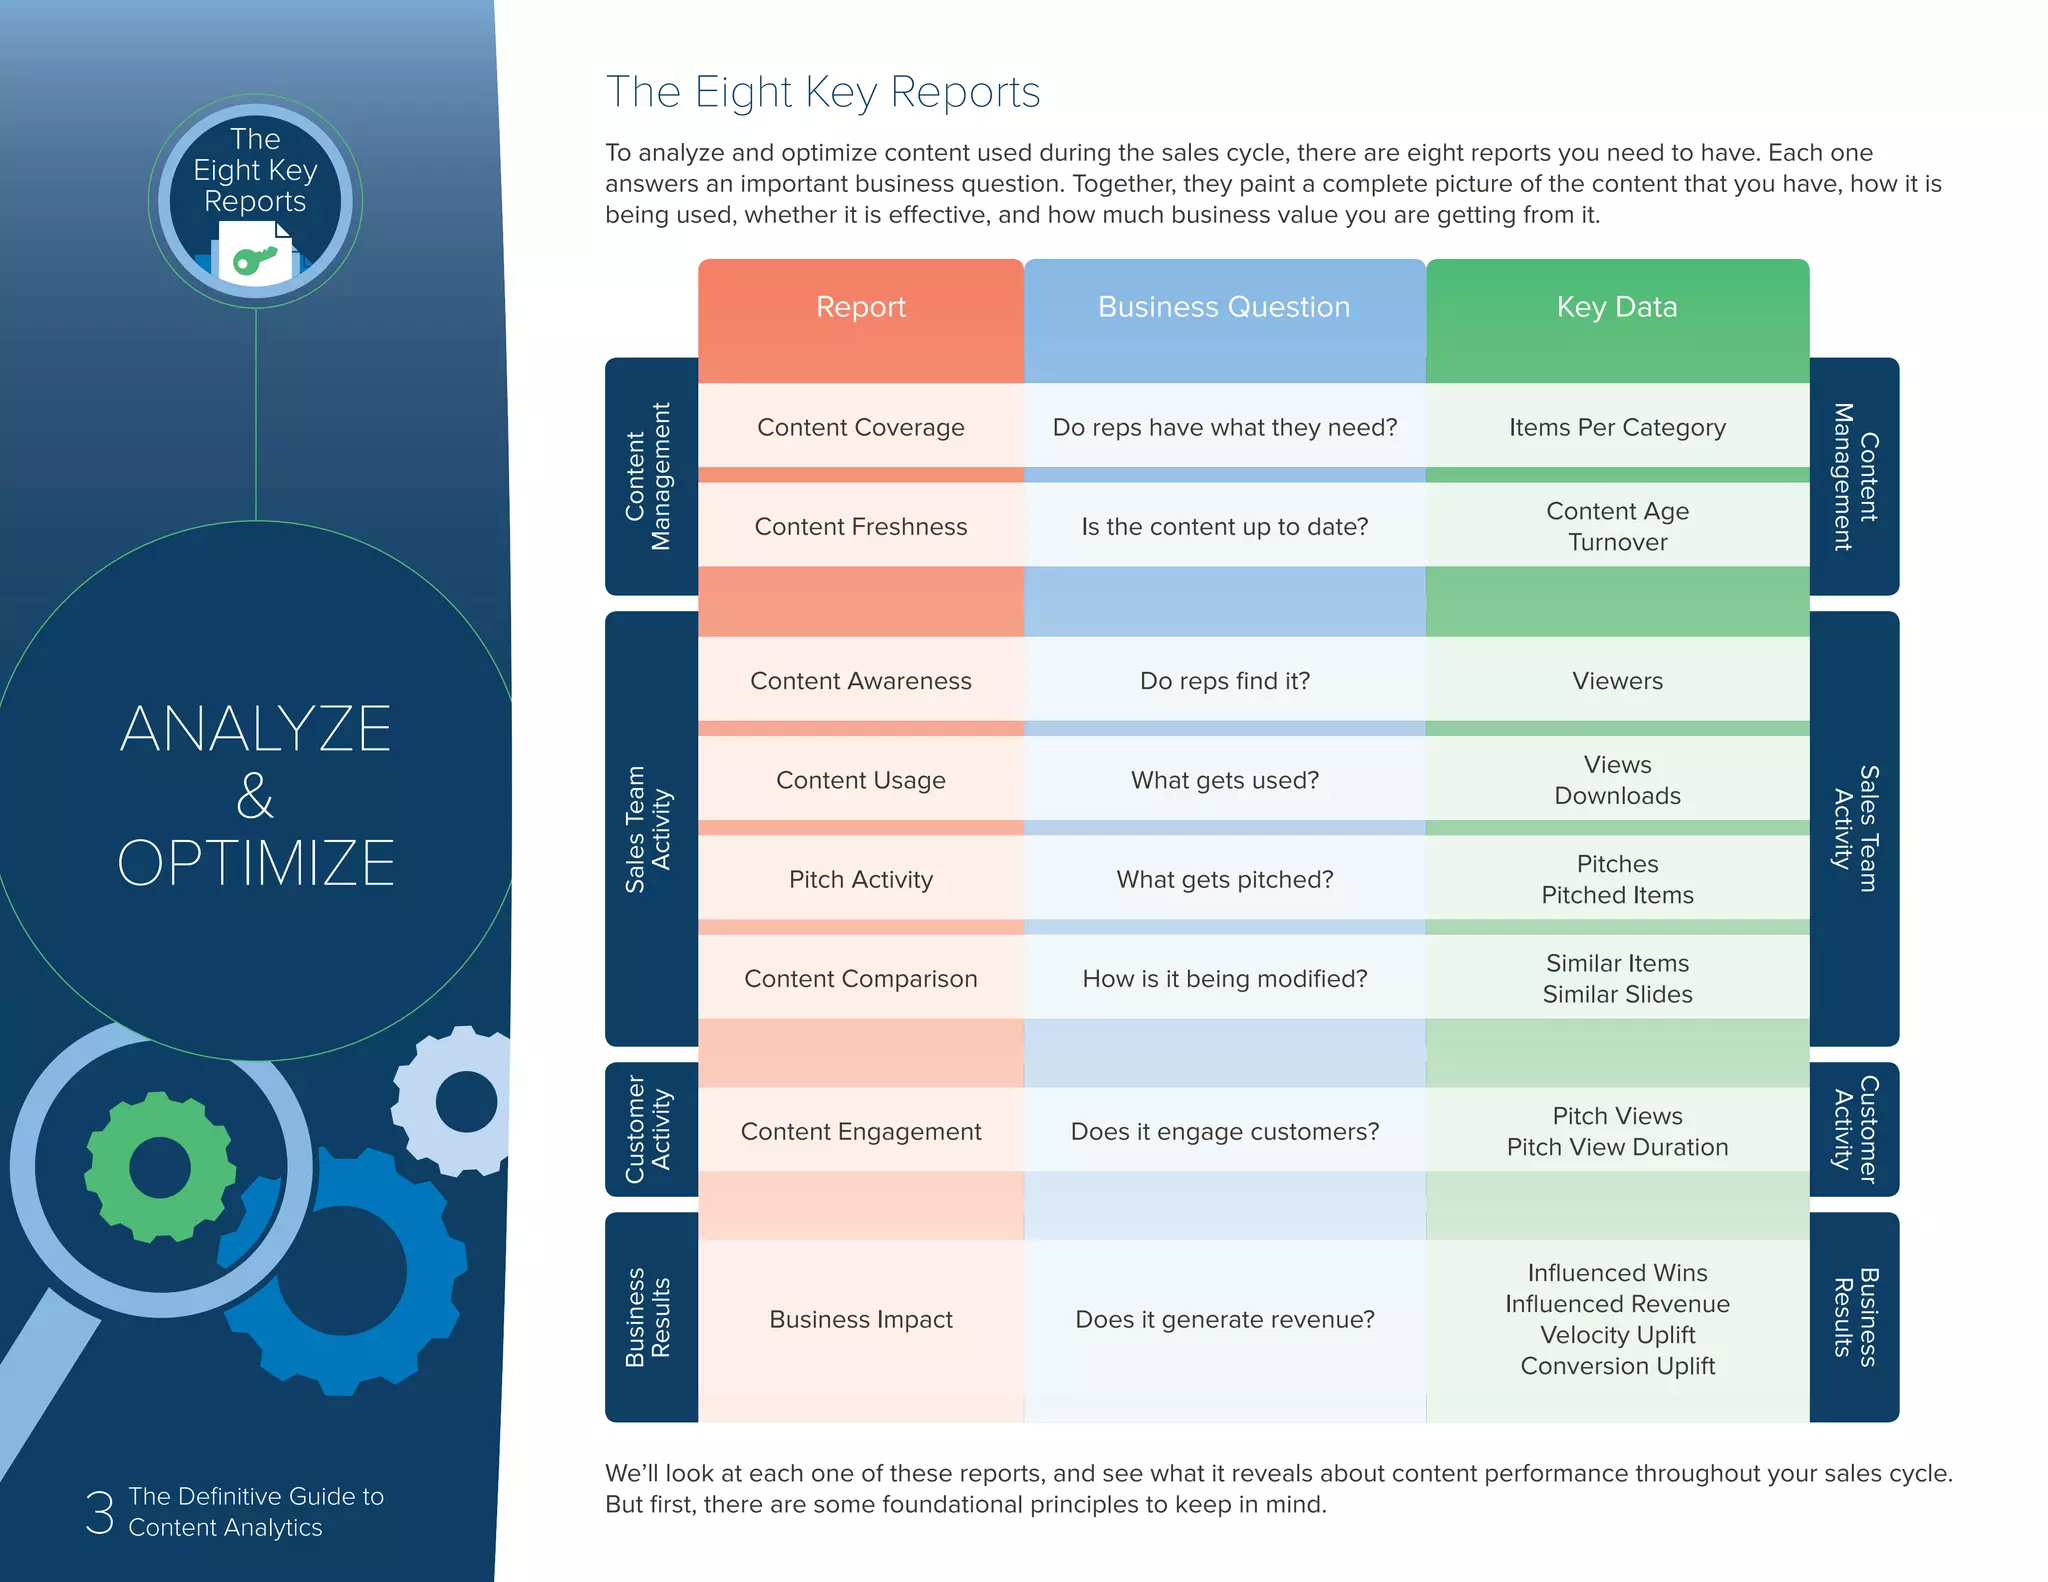
The document provides an overview of content performance analytics for sales content. It discusses how analytics can now provide visibility into how sales content is used and performs throughout the sales process, unlike in the past when sales content was a "black hole". It outlines 8 key reports that provide insights into questions like what content reps have, what gets used, how content engages customers, and how it impacts business results. The document advocates analyzing content usage and performance across the entire sales lifecycle and content lifecycle to fully understand impact.
This Mindmatrix presentation on sales enablement offers a step-by-step process for enabling your direct sales teams. Watch this presentation to learn-
-Why is sales enablement is so important?
-What does direct sales enablement involve?
-Why is it time to move beyond traditional marketing automation and CRMs?
-What are the 12 steps to holistic sales enablement
IDC provides an overview of the key issues in sales enablement and sales productivity. While sales enablement is a key cornerstone of sales productivity in this challenging economy, IDC finds that most organizations still do not understand the basics of sales enablement or the operational issues that deliver good sales enablement.
How to Use Sales Enablement to Increase Pipeline and Drive RevenueBrandon Redlinger
“Sales enablement has the most leverage in driving the productivity of your salesforce.”
-Matt Heinz, President, Heinz Marketing
Sales enablement is yet another hot new term that's been injected into sales lingo and it’s getting more budget allocated in high growth companies. These companies are deploying this role with incredible results as they jump on the opportunity to supercharge the revenue generating side of the business.
On this presentation, you'll discover:
The keys to an effective sales enablement program
How technology can help you drive revenue and shorten the sales cycle
How to track, measure and improve your sales enablement program
How Sales Enablement drives productivity and closes more deals
How marketing and sales can develop effective Sales Enablement content
4 types of content sales can use to close faster
The Secret to Building a Sales Enablement PowerhouseMindTickle
Alex from Procore and Marc from MindTickle explore:
State of the industry
Need for Sales Enablement
Sales Enablement and Sales Readiness at Procore
Best-in-class framework for Sales Readiness
Marketing automation is powerful technology, but how do you build a business case for it in your company? This presentation highlights key features of marketing automation platforms, and shares tips for planning and implementing your new system.
Learn how marketing automation can grow your pipeline, make your customers happy and close the gap between marketing and sales.
Watch this webinar to learn from industry expert Laz Gonzalez, what companies need to do for the channel sales model to work and how they can make it easier for channel partners to sell.
Sales enablement is essential if you’re serious about taking your team’s sales performance to the next level, but it can also get complicated and messy. This presentation will walk you through which traps to dodge (no matter how tempting they look!), process and structure basics, and what good enablement looks like.
Transforming from Call Center to Contact Center How-To GuideDemand Metric
Executive Summary
If loyal customers are the lifeblood of a successful marketing program, call centers are the heartbeat. It is within the call center that happy customers become loyal advocates or disenchanted. All too often, however, call centers are viewed by marketing professionals as an afterthought instead of a key to customer loyalty, customer satisfaction and as a lead generation.
Modern marketers must move from seeing Customer Care as a secondary supporting function to one of primary importance to marketing programs and lead generation, along with other digital marketing and sales activities.
This How-To Guide challenges marketers to view the call center as a potential source of revenue and lead generation as well as the hub of Customer Care. This report discusses the misperceptions around call centers and shows modern marketers how to transform their call center (cost center) into a Modern Contact Center (profit center) by recognizing its strategy in lead generation and customer experience.
This brief 11-page How-To Guide is designed to provide practical advice for building a Modern Contact Center and outlines the following:
Executive Summary
Opportunities & Challenges of the Call Center
Creating a Modern Contact Center
Contact Center Application Selection Criteria
Action Plan
Bottom Line
Demand Metric's How-To Guides are designed to provide practical, on-the-job training and education and provide context for using our premium tools & templates. If there is a topic that you would like to see covered, please contact us at info@demandmetric.com (link sends e-mail) to make a content request.
At the Next Gen Customer Experience (CX) in Financial Services conference, Centerline's Marketing Change Management team presents two hypotheses on the importance of organizational balance and elevating your CX using data and innovation. As a key takeaway, the presentation included a CX Maturity Program to gauge your organizational CX maturity as well as helps identify goals and where to focus your efforts moving forward.
Executive Summary
Business-to-business (B2B) marketing automation systems are among the hottest sectors of the technology industry. Vendor revenues have grown at 50% per year since 2009 and will probably top $1 billion in 2014. Leading vendors including Eloqua, Marketo, and Pardot have been acquired or gone public at tremendous valuations. Major software companies including IBM, Oracle, Salesforce.com, Adobe, and Teradata have purchased B2B or business-to-consumer (B2C) marketing automation products. Venture capitalists have invested several hundred million dollars in start-ups and existing firms.
Yet, despite this growth, fewer than 20% of B2B marketers have purchased an integrated marketing automation system (although many more use email, Web analytics, and other component technologies). Even more alarming, many past buyers do not use their systems fully and a significant portion report little benefit from their investment.
The lesson of these statistics is not that marketing automation doesn’t work. The same studies show that the majority of users are satisfied and productive. Rather, the point is that marketing automation works only when marketers deploy their systems effectively. This How-To Guide will help to ensure that you are among the successful majority of B2B marketing automation buyers, not the unhappy remnant.
This 15-page guide includes the following sections:
What is B2B Marketing Automation?
Core Functions
Specialty Functions
Key Considerations
Vendor Landscape
Best Practices
Demand Metric's How-To Guides are designed to provide practical, on-the-job training and education and provide context for using our premium tools & templates. If there is a topic that you would like to see covered, please contact us at info@demandmetric.com (link sends e-mail) to make a content request.
This sales proposal was created for my Mkt 383 Analytical Sales class. My group and I played the role of our company being Salesforce, and created a sales proposal to 3M. We ended up finishing in the top 2 of our class.
Learn how to make sense of two approaches to managing customer interaction and engagement: CRM (Customer Relationship Management) and MA (Marketing Automation). In this presentation, you will learn:
-101-level marketing technology definitions
-When and how to use what platform
-Best practices & success stories for marketing and sales teams
Dan Tyre talking about Sales Enablement at our virtual Solent HUG (HubSpot User Group) recently. It was great to see so many enthusiastic and engaged attendees at the webinar.
The feedback so far has been fantastic.
We look forward to inviting you to the next one in due course and we plan to run them at least quarterly.
Please visit our chapter and keep an eye on upcoming events:
https://bit.ly/39DyZN6
#SolentHUG
Best wishes
Sam (Solent HUG team).
Webinar Slides - An Empowered Sales Rep Becomes A Content ConciergeMediafly
In the B2B world, many believe that buyers spend the first 60-70% of their journey consuming content. Then, if they are interested in buying, do they actively seek out a salesperson. While this implies that the salesperson’s primary role is to respond to product questions and present an offer, Forrester’s research shows the exact opposite to be true.
Executive Summary
Business marketers have always advertised in specialized media such as trade magazines, but their audiences have traditionally been too narrow to use television, radio, and similar mass outlets. This limitation has carried over into the digital world, where business marketers could target ads on search terms and industry Web sites but not buy display ads that reach broad audiences. This has become an increasing problem as buyers do more research anonymously on the Web, making them harder to identify and nurture. Tools such as content marketing and social media have filled some of the gap by offering alternative methods of acquiring new names. But those methods are labor and content- intensive, making them difficult to scale. As a result, business marketers have longingly eyed the “insert coin here” efficiency that lets consumer advertisers reliably increase results by raising their display ad spend.
Happily, new methods have now made online display advertising a more effective, higher volume option for business marketers. Improved audience targeting expands the number of prospects marketers can reach and how frequently they can be contacted. Business marketers must learn a few new tricks to take advantage of this opportunity. But in return they gain a greater control over the flow of new names and more precise targeting of the messages for each individual. This Guide will ease your entry to the new world of effective B2B display advertising. Let the journey begin.
This brief 11-page How-To Guide is designed to provide practical advice for B2B Display Advertising and outlines the following:
What is Display Advertising?
Display Advertising For Marketers
Challenges
Resources
Action Plan
Bottom Line
Demand Metric's How-To Guides are designed to provide practical, on-the-job training and education and provide context for using our premium tools & templates. If there is a topic that you would like to see covered, please contact us at info@demandmetric.com (link sends e-mail) to make a content request.
Developing a Sales Playbook is the optimal way to have your entire team follow the Best Practices required to have everyone perform as well as your best.
Sales Compensation Solution Acquisition Best Practices ReportDemand Metric
This guide suggests a better process for acquiring an ICM solution. For many companies, sales compensation is the largest component of Sales, General and Administrative (SG&A) costs. The monthly calculation and payment of variable sales compensation is often an arduous, manual process that must accommodate a number of exceptions and changes: rarely does a sales compensation plan start and end a fiscal year intact.
The plan must survive the attrition and addition of sales representatives. It must accurately calculate and pay commissions on time, as there are risks and trust issues involved when it doesn’t. While the sales compensation plan is, theoretically, an enabler of revenue growth, these characteristics prevent it from scaling as the business grows.
This guide will examine the problems that motivate ICM solution acquisition, the limitations of acquiring one through a traditional RFP, a recommended approach, an example project plan and conclude with a discussion of associated risks and rewards.
To obtain this document, visit us at http://www.demandmetric.com/register
We explain what is a sales playbook and the topics that are covered in our sales playbook creations to help you train your sales teams for success, from sales enablement and channel enablement experts, The Sales Way.
LinkedIn is one of the most frequently used tools in every sales team’s playbook. But are sales professionals utilizing the platform most effectively to keep up with buyers? Get the fundamental right with the four behaviors of social selling.
1. СОЗДАНИЕ САЙТА
- Семантическое ядро – голос рынка. А собственно, ищут ли услуги оценщиков в интернете? Инструменты поиска и подбора семантического ядра. Вордстат и автоматические системы.
- Карта смыслов. Что и как сказать клиенту. Заголовки 4u. Лендинг vs сайт. Упаковка.
- Последовательность работы над сайтом. Тех. задание. Прототип. Дизайн. Программирование. Отладка. Системы конверсии и аналитики.
- Принцип А/б тестинга. В оценке работает плохо, но…!
2. ГЕНЕРАЦИЯ ТРАФИКА
- Контекстная реклама. Связка – директ, РСЯ, ретаргетинг. Как не слить кучу денег бесполезно?
- SEO. Есть ли SEO на Марсе? Как не пустить под откос свой сайт? Москва и регионы. Краткий словарь - снипеты, тайтлы, аппорт слова. Зачем оценщику это знать?
3. КОНВЕРСИЯ ТРАФИКА
- Зачем нужны клики, если нет заявок? Доктор, я что-то делаю не так? Все что зашло конвертить!
- Инструменты конверсии. Должно быть 100%: формы захвата, живосайт, коллбэк. Проверено на себе!
4. АНАЛИТИКА
- Существующие системы аналитики. Подключать обязательно! Яндекс.Метрика и Google.Analitics. Ткнем пальцем куда смотреть!
- Немного о коллтрекинге
- ROI. Три волшебные буквы.
vSharePoint - June 2016 - What's New in SharePoint - Alec McCauley and Karin ...Regroove
"What's New in SharePoint" - A summary guide through the newest changes to SharePoint as of June 23, 2016 - including announcements about The Future of SharePoint, Feature Packs, SharePoint App, Mobile Experience, Modern SharePoint Experience, Framework, Power Apps, Flow, Server Admin Roles, and GigJam.
Presented by Alec McCauley and Karin Skapski of itgroove Professional Services Ltd. at the June 23, 2016 meeting of the Victoria SharePoint Users Group in Victoria, BC, Canada.
The Definitive Guide to Content Analytics.pdfHeyEmbedMe
Content is the backbone of marketing departments across
the globe.
Unsurprisingly, buyers want to engage with organizations in a way that doesn’t strictly feel like
selling, and content is one of the best tools for learning about their industries, the challenges
they face, and new developments within their fields. Implementing a content strategy is an
effective way to do just that—while also proving an organization’s value.
Not only does great content leave buyers feeling fuzzy and warm, it makes sense from an
investment standpoint as well. Demand Metric has found that content activities cost 62%
less than other traditional efforts. Content doesn’t just cost less than other activities,
it provides more for the investment. The same report found “[per] dollar spent, content
generates approximately 3 times as many leads as traditional marketing.” Spending less AND
getting more for that money is what CEO catnip is made of.
Content Marketing and Content Selling - Together
Content Selling enables sales people to efficiently discover, deliver, and track the effectiveness of messages that advance a sales engagement. Effective Content Selling translates into closed business. But how do we get there?
Through this eBook, we’ll take a look at how the two sides of content can work together in concert. First, we’ll see how sales teams can use content in their day-to-day activities. Second, we’ll see how marketing can constantly improve the content that they produce to boost sales effectiveness.
Harvesting the value from Advanced AnalyticsJaap Vink
In general, Analytics help you leverage investments that you have done already in your IT investments, on ERP, on CRM systems, on sales
force automation systems, and on all
the data collection that you put in
place.
Unfortunately, reality isn’t that
straightforward. It’s still a struggle
for most companies to drive valuable
insight into the data they have.
It’s all about the customers. Only that it’s not. - Juliana Jackson, Ecommerc...Juliana Jackson
Repurchase rates do not vary over time by a whole lot. I know vendors and agencies promise this a whole to DTC brands.
If your annual purchase rate is 28%, it might vary by plus or minus 10%on that level. And that is a great win.
I remember always being very cautious when promising brands an increase there. I always stood in the statistical 10% yearly increase.
So, in other words, it might be 25% when you have a terrible year, and it might be 31 or 32% in a good year, but it's always going to be in that range generally, and there's not a lot you can do about it.
The products that you sell frequently dictate what that repurchase rate is. It has very little to do with the marketing smarts of the people working in the marketing department.
A Crash Course, Understand Metrics vs. analytics. find the right metrics for you. Measure full funnel impact. B2B marketers are being held to new levels of accountability in this data-driven and buyer-empowered era.
Killer or Filler? Assessing content success for tech marketersAndrew Miller
In the realm of technology marketing, content is king. With proper planning and execution it has the power to command a following, inspire loyalty and win battles for new business.
However, without proper assessment it can suffer a short and unsuccessful reign over influencers and decision-makers in a multi-media world saturated by multiple messages.
Before planning your assessment, take a look at our quick guide to discover how content can be more ‘killer’ and less ‘filler’.
The marketing trend of the year is content marketing, so you’ve probably been busting your hump to push out blog posts and other content as fast as possible. Now you have an inventory of content, but for some reason, it just won’t take off.
You aren’t alone. Start with an objective review of what content working and what is not. But before you audit your own activities, make sure you know what to look for.
Successful Marketing Starts with a StrategyKatie Spence
Once we’ve crafted a strategy for messaging to customers, Spry Ideas puts the nuts-and-bolts tactics in place that assure ROI on content dollars. Quite often we find companies have no clear objectives for their content and no way of measuring the ROI on content or social media spends. They just write more, tweet more, and hope for the best. Our well-executed content marketing strategies have clear goals and measurable returns. We also offer marketing automation solutions to provide enhanced efficiencies and expanded analytics for clients. You should know that your content is reaching buyers and impacting their buying journeys and we can show you how.
Cold leads plague our databases, and there needs to be a way to bing them back to life. Here is the answer. From the author of Marketing Automation for Dummies, Mathew teaches you the 5 key aspects to nurturing your cold leads back to life.
2. 2 The Definitive Guide to
Content Analytics
THE
DEFINITIVE
GUIDE TO
CONTENT
PERFORMANCE
Analytics are at the heart of a modern data-driven business.
When it came to content, we used to rely almost entirely on anecdotes and guesswork. That is no longer good enough
– content is at the heart of the sales and marketing process and we must know how it is being used and how it is
performing.
Marketing Automation tools made that a reality for marketing content. They let marketers analyze and optimize content
marketing efforts during the first half of the sales cycle, providing analytics to show how effectively content moves
customers through the funnel. But until recently, as soon as a deal was handed off to the sales team, it entered a
content black hole.
There has been no way to answer very basic questions about sales content. Do reps have what they need? Do they
use it? Do customers pay any attention to it? Does any of this actually generate real revenue? Even in our increasingly
data-driven world, sales content has remained back in the days of guess and hope. But an emerging set of Sales
Enablement platforms has changed that. They manage sales content throughout your sales engagements and use
analytics to give you full visibility into how that content performs.
This guide walks through eight reports that answer the key business questions about sales content and shows how to
use them to optimize the way your company engages with customers.
Marketing
Automation
Sales
Enablement
Sales
Engagement
Marketing Content
Analytics
Sales Content
Analytics
Awareness
Consideration
Evaluation
Purchase
Marketing
Engagement
3. 3 The Definitive Guide to
Content Analytics
ANALYZE
&
OPTIMIZE
The
Eight Key
Reports
SalesTeam
Activity
Content
Management
Customer
Activity
Business
Results
The Eight Key Reports
To analyze and optimize content used during the sales cycle, there are eight reports you need to have. Each one
answers an important business question. Together, they paint a complete picture of the content that you have, how it is
being used, whether it is effective, and how much business value you are getting from it.
We’ll look at each one of these reports, and see what it reveals about content performance throughout your sales cycle.
But first, there are some foundational principles to keep in mind.
Report
Content Coverage
Content Freshness
Content Awareness
Content Usage
Pitch Activity
Content Comparison
Content Engagement
Business Impact
Business Question
Do reps have what they need?
Is the content up to date?
Do reps find it?
What gets used?
What gets pitched?
How is it being modified?
Does it engage customers?
Does it generate revenue?
Key Data
Items Per Category
Content Age
Turnover
Viewers
Views
Downloads
Pitches
Pitched Items
Similar Items
Similar Slides
Pitch Views
Pitch View Duration
Influenced Wins
Influenced Revenue
Velocity Uplift
Conversion Uplift
Content
Management
SalesTeam
Activity
Customer
Activity
Business
Results
4. 4 The Definitive Guide to
Content Analytics
To get a true understanding of content performance,
you can’t just look at one small piece of the puzzle.
Activity, Local Impact, and Business Impact
Ultimately, you want to measure the business impact that your investments are having. “I spent $X building
this case study; how much revenue did it generate?” But even so, intermediate metrics yield key insights by
measuring the steps along the way.
Activity metrics help you diagnose why you aren’t getting the business impact you want. Suppose the revenue
influenced by a particular case study is zero – you wasted your money developing it. But why? Perhaps nobody
knows about it – you have an awareness problem. Or the reps don’t think it is worthwhile, so they never share
it with customers. Or they pitch it to customers, who ignore it. Or customers open it up, but then they just move
on because it doesn’t engage them. How you fix the problem is completely different, depending on what you
find! So don’t dismiss activity metrics – they don’t tell the whole story, but they do tell an important part of it.
Measuring local impact is often more precise. Let’s say that during a five month sales cycle, you send the
customer a particular piece of content. How important was it in closing the deal? It depends – there are many
factors that affect whether a deal closes and how long it takes. The impact of one piece of content is much
higher, however, on the particular sales stage when it is sent. A great pitch deck won’t close a deal by itself,
but it can have a clearly measurable effect on moving that deal to the next stage of the sales cycle. And a bad
one, especially in the hands of an inexperienced rep, can torpedo the deal quickly. So it’s highly valuable to
measure and optimize content within a sales stage as well as across the whole sales cycle.
The Whole Sales Lifecycle
If you can’t analyze across each stage of the sales
cycle, you can’t answer crucial questions.
• If you don’t know which deals the content
touched, you can’t measure revenue
influenced and business impact.
• If you don’t know the sales stage where
content is used, you can’t tell whether you
have good coverage for each step of the
buyer’s journey.
The Whole Content Lifecycle
Content has a lifecycle, too. Analyze the return
you are getting on your content investments by
gathering data at every stage of its evolution:
• Content creation
• Publication to the sales team
• Evolution, modification, and
customization in the field
• Delivery to customers through pitches
• Customer engagement
• New version updates, deletionFoundations of
Content Analysis
ANALYZE
END TO END
5. 5 The Definitive Guide to
Content Analytics
Foundations of
Content Analysis
CONTENT
EVOLVES
Analysis Must Understand
How Content Changes
During the early stages of the buyer’s lifecycle,
marketers connect with large audiences directly,
using content they have perfect control over. But
in the later stages, when the sales team enters the
picture, ”perfect control” is lost. The content filters
through the organization, moving from central
marketing through field marketers and regional
sales leaders, finally landing in the hands of the
sellers. And along the way, that content changes
and evolves.
In larger organizations, the original pitch deck that
marketing built is rarely what is actually put in front
of the customer. Field teams (from both marketing
and sales) add information about the industry, the
region, or the customer in order to personalize
the material for each situation. The slides in the
deck are remixed, reordered, and recombined with
content from other sources.
In this world of continually evolving content,
basic analytics can’t measure what is actually
happening. With conventional systems, when
anyone modifies a presentation, even to edit a
slide or add a new one, it looks like an entirely
new and unrelated deck. When a marketer
analyzes the performance of the pitch deck
they created, they only see what happens to the
original untouched deck – all the many variations
become invisible. In many organizations, that
means as much as 80% of the content disappears
from view.
Analyze Slides,
Not Just Decks
Documents are modified, but much less often;
decks are composed of slides, which are easily
shuffled around and moved from deck to deck –
much more so than pieces of a document. Also,
decks are personal – people present them, and
the buyer’s experience is a mix of the content and
the person. Documents are more abstract.
So decks get modified constantly as they are
used, and the changes typically happen at the
granularity of individual slides. If you treat a
presentation as a single unit, you lose valuable
insight into how that content is truly being used
and how it is performing.
Track Content as it is
Modified and Repackaged
To answer the question “how is this deck
performing?”, the analytics system needs to be
able to find the content from the deck regardless
of how it is presented to customers. It’s the same
pitch deck, even if a rep added a slide for one
particular customer. It’s the same slide about your
value prop, even if it was pulled out of one deck
and dropped into another.
By detecting the relationships between pieces of
content, the analytics system can deliver the true
performance and business impact of your content
however it is reaching your customers.
5 The Definitive Guide to
Sales Content Performance
6. Foundations of
Content Analysis
KEY INSIGHTS
COME FROM
SEGMENTATION
Slicing and Dicing
is Critical
Overall statistics are important
– if nobody is using a case
study, it obviously isn’t
effective. But many deep
insights take more work than
that. You need to cut the data
in different ways to figure out
what works and what doesn’t.
There are many ways to
segment data. The table below
lists some that are useful in
many organizations, and you
probably have specialized
ones of your own, as well.
Start at the top level and then
drill down, comparing the data
across various segments. Look
for outliers – cases where the
results are unusually good or
bad.
Look for
What’s Missing
Analytics typically focuses
on what is happening, but it’s
often just as important to figure
out what isn’t happening.
Find the holes in your content
coverage that are hurting your
deal conversion rate and fix
them.
For example, perhaps every
deal you won in Life Sciences
required a document that each
rep had to build themselves
– you don’t have a standard
version of it. Or nobody
pitches anything during the
discovery phase of your sales
cycle, because you don’t have
any customer-ready material
available.
Identify
Best Practices
Segmentation is critical for
discovering best practices. You
often find them by analyzing
the behaviors of your “eagles”
(the most successful reps in
your team) or by looking at
practices that led to successful
outcomes such as customer
engagement and winning
deals. Both rely on looking at
particular segments – a special
group of your reps or a subset
of the deals and pitches.
Best practices themselves are
often segment-specific. Reps
may, for example, have found
a particularly effective way to
engage customers in a region
(like Germany) or a vertical (like
Manufacturing).
Here are some common ways to segment analytics data:
Segmentation Example Discovery Report
Product Line Customers are engaging much more with case studies for product A than product B Content Engagement
Use Case/Scenario We don’t have any thought leadership pieces for this key scenario Content Coverage
Region Reps in Europe hardly ever use our product brochures Content Usage
Sales Stage The content we have developed for the Prove sales stage isn’t getting sent to customers Pitch Activity
Time The number of winning deals influenced by each case study has dropped year over year Business Impact
Customer Size ROI calculators for the Enterprise aren’t effective in SMB companies Content Engagement
Vertical Industry The case studies for Healthcare are all old and out of date Content Freshness
Sales Team None of the reps in the western US region have seen any of our new compete battlecards Content Awareness
Rep Performance The “eagles” (the highest performing reps) are all modifying the standard pitch deck Content Comparison
6 The Definitive Guide to
Sales Content Performance
7. 7 The Definitive Guide to
Content Analytics
Report 1:
CONTENT
COVERAGE
The
Eight Key
Reports
There are many pieces of content that may be used during the sales cycle.
The content coverage report lets you analyze what kinds of content you have to help you find the
gaps that are making it difficult for reps to move deals forward.
Business Question: Do reps have what they need?
Items Published content that has been made available to the sales team
Key Data
The modern sales process typically requires many different kinds of content coming from multiple
teams and often calling for specialized knowledge and expertise. The need constantly changes as
the business evolves, and content generation frequently struggles to keep up. As a result, most
companies have uneven coverage – they have good depth in some areas, while others are thin or
almost non-existent. Maybe there is a new product line, or the company has expanded into a new
country and there isn’t enough content to support the sellers there. The content coverage report will
show you where your gaps are.
Typical Findings: You have critical content gaps
8. 8 The Definitive Guide to
Content Analytics
Report 1:
CONTENT
COVERAGE
The
Eight Key
Reports
Using the Report
Apply the coverage report to your published content. A few ways you might analyze by segment:
Content Type
Look at certain types of content, such as white papers, or case studies. It is often useful to segment further, as in the
sample report above that shows how many case studies are available by vertical industry.
Vertical Industry
This is important if specialized content is needed to sell your product into particular industries. You might start by
seeing the total amount of content for each industry. Then look at various segments of interest – in the example, you
can see that there are hardly any case studies for the natural resource industry. That’s a problem, since the company
has made that vertical a strategic focus for growth.
Region
If you are a multi-national, have you created the content that your various regional sales teams need? Look at totals by
region, then drill by content type. As you expand into new markets, there are often large gaps in the content that your
reps have available. Find them and get the most important ones filled as soon as you can.
Sales Stage
If you have a content-heavy stage in your sales cycle, have you built out what the reps need during that phase of the
deal? Perhaps you have late-stage content, but you are missing thought leadership pieces that they need to use early
in the cycle to get prospects interested.
Sample: Case Studies by Vertical
20
15
10
5
0
N
aturalResources
Education
EngineeringFinancialServices
Life
Sciences
M
anufacturing
M
edia
Professional
Public
Sector
RetailTransportation
9. 9 The Definitive Guide to
Content Analytics
Report 2:
CONTENT
FRESHNESS
The
Eight Key
Reports
In our fast-changing world, content must be constantly updated. Is old content being retired or
versioned? Unused content being improved or eliminated?
The content freshness report shows you whether you are seeing good turnover. Your content should
reflect your best ideas, new features, shifting competition, and changed business realities.
Business Question: Is the content up to date?
Content Age The date when your content was published to the sales team
Turnover What fraction of the content has been versioned or newly added
Key Data
There are two basic problems you can have, and both are true at most companies.
1. Official content is out of date. You haven’t been aggressively removing and updating some of
your content, so old information is lingering around too long. Maybe your compete battlecards
are stale, and reps look out of touch when they don’t know how the competition has moved
forward. Or there is an important new trend in your industry, but none of your “thought
leadership” pieces mention it since they haven’t been updated in over a year. In your older
content, you will often find badly outdated messaging.
2. Reps are pitching old content. Often sellers continue to use content that has been replaced by
something more up to date. It’s easy to fall into the habit of pitching something you are familiar
with, even when the world moves on. Sellers need their story to keep up with the latest and best
information you have.
Typical Findings: Some of your content is old and outdated
10. 10 The Definitive Guide to
Content Analytics
Report 2:
CONTENT
FRESHNESS
The
Eight Key
Reports
Using the Report
Monitor Turnover
In a healthy environment where content is being kept up to date, you should see good turnover – the percentage of
content that has been versioned or newly added. If your business environment isn’t static, your content shouldn’t be
either. How much turnover you want to see will depend on your business; as a general rule, however, content that
remains untouched for a year is probably starting to show its age – business conditions, priorities, and messaging tend
to evolve between fiscal years. If that sounds right for your business, look for turnover of at least 25% per quarter and
nearly 100% per year. It’s also useful to look at turnover by content type, since some pieces are meant to live longer
than others.
Check the Age of Your Content
Are your sales reps still using and pitching old content? Out of date price sheets? Decks that don’t reflect the latest
messaging and positioning of your companies and product? A quick way to find out is to use a report like the sample
above, which shows all the content that has been pitched or viewed, by category, broken out by its age. The case
studies are getting a little dusty .. and what’s up with those pitch decks that are more than two years old? Periodically
prune content that has passed its “use by” date. If it isn’t getting used, it is taking up space. If it is being used, it is
probably sending the wrong message through your reps to your customers.
Sample: Age of Pitched and Viewed Content By Type
40
30
20
10
0
Sales
Tools
Dem
and
G
enerationAnalystReports
Pitch
Decks
ProductBrochures
Case
Studies
Pricelists
Training
Videos
0-2 Months
3-6 Months
6-12 Months
1-2 Years
2+ Years
50
60
11. 11 The Definitive Guide to
Content Analytics
Report 3:
CONTENT
AWARENESS
The
Eight Key
Reports
The best content in the world won’t do any good if the reps don’t actually know that it exists.
The content awareness report will show you what they have seen, so you can make sure that they
know about the content that they need.
Business Question: Do reps find it?
Reps are very busy, constantly under the gun to hit their numbers – they generally don’t have time
to explore and find out about new content. So the awareness report will often reveal that nobody
knows about key areas of content you have invested in. You need to get the word out – maybe you
can highlight it in one of your field emails. Or show the content directly inside their CRM system next
to an opportunity where it is relevant. Or you can highlight it at the next sales kick-off event.
Typical Findings: You have an awareness problem
Viewers People who have viewed each piece of content at least once
Key Data
12. 12 The Definitive Guide to
Content Analytics
Report 3:
CONTENT
AWARENESS
The
Eight Key
Reports
Using the Report
You have many different kinds of content, and different segments in the field. The content awareness report will let you
check whether the reps know about the content investments that you have made.
Check Broad Awareness of Key Types of Content
Often there are whole categories of content that may not be well known by the sales team. Perhaps you have gotten
feedback that you need more early stage content to help generate demand. You have created it, but do the reps
know that it exists? Run an awareness report, and you may find that you need to do a better job of publicizing the new
material that you’ve made available and why they should seek it out.
Look for Awareness Gaps By Segment
Often the message about important kinds of content isn’t getting out consistently across the sales team. For example,
suppose that you are struggling with some tough competitors, and you’ve built some really strong battlecards to help
explain the benefits of your solution. Run a report like the example shown above. You can see that the word has gotten
out across the US and Canada, and somewhat in Europe, but most of the sellers in LATAM, APAC, and India have never
seen any of the new material.
Sample: Compete Battlecard Awareness by Sales Region
40%
30%
20%
10%
0%
US
East
50%
60%
70%
80%
90%
100%
US
Central
US
West
Canada Europe LATAM APAC India
Unviewed
Viewed
13. 13 The Definitive Guide to
Content Analytics
Report 4:
CONTENT
USAGE
The
Eight Key
Reports
It doesn’t matter how great your content is, if the sales people are not using it.
The content usage report shows you what reps are viewing and downloading. So you can find the
content that is getting traction and see what is being ignored. You can also find the sellers who are
not being served by what you provide them.
Business Question: What gets used?
Most companies are investing a lot of time and energy building content that never gets used by the
sales team.
• Generally there are categories of content that are being largely ignored. For example, you’ve
developed detailed sales material about individual features, but the people who make the buying
decision don’t care and the people who implement solutions need documentation, not sales
information.
• Within a category, typically a few items get almost all the attention. There is commonly a sharp
curve, where the top few items get a great deal of use and then it tails off pretty quickly. In many
cases, once you get past the top 20% of the items, the amount of usage drops nearly to zero.
Typical Findings: Many items are being ignored
Viewed The items that have been viewed
Downloads The items that have been downloaded
Key Data
14. 14 The Definitive Guide to
Content Analytics
Report 4:
CONTENT
USAGE
The
Eight Key
Reports
Using the Report
Find Popular and Unpopular Items
In most organizations, a small percentage of the items get a major percentage of the use. Find out what your teams
actually use. If you are building a lot of general-purpose content that is getting very little attention, you are wasting your
money. Invest in the content that your people actually need.
Compare Sets of Content
For example, you may have built content for different roles. That often results in very uneven usage. Maybe the
traditional sales rep is getting what they need, but the SDR content is really not cutting it, so everyone ignores it. Or you
are spending time and effort building out compete battlecards but nobody uses them. The reps definitely know that the
battlecards exist – your awareness report told you that. But perhaps the battlecards just aren’t useful in practice. Go
talk to some reps and find out why they aren’t interested in them.
Segment by Team
Another way to find underserved groups is to track viewing activity by role. In the sample report above, we’re seeing
average view and download activity per month per user across all the key roles in the sales team. The account
executives and inside sales teams are very active, but the SDRs hardly use the content at all. The account managers
aren’t doing much, either. That’s a problem – those are both content-heavy roles, but apparently the content they ought
to need isn’t getting used. There are other roles that are expected to be low – the support team, for example, has its
own knowledge base for answering most customer questions.
Sample: Average Content Usage by Role in Previous 6 Months
40
30
20
10
0
Sales
O
perations
Sales
Dev
Rep
Inside
Sales
AccountExecutiveAccountM
anager
Sales
M
anagem
ent
Services
Support
50
60
70
Downloads
Views
15. 15 The Definitive Guide to
Content Analytics
Report 5:
PITCH
ACTIVITY
The
Eight Key
Reports
You are providing a lot of content to the sales team, at great cost and effort. But does it actually
reach any customers?
The pitch activity report gives you the answer. It tells you exactly which items are being put in front
of your prospects. Our experience shows that the answers are often surprising — we’ve repeatedly
found that what you think is happening, isn’t.
Business Question: What gets pitched?
Most “customer-facing” content hardly ever touches a customer. Often there is a disconnect
between what the marketing team thinks a customer should see and what the sales team believes
that they need to move deals forward. As with content usage, there are categories of content that
don’t get pitched. And then, within a category, a few items are used for most pitches. The numbers
are very enlightening, but for the whole story you also need to talk to the sales team. Once you
know what is actually happening, those conversations will help you understand why.
Typical Findings: Many items never reach a customer
Pitches The number of pitches sent by a rep, so you can measure pitch activity by person
Pitched Items The items that were sent to customers in a pitch, so you can see what is actually
being sent to customers
Key Data
16. 16 The Definitive Guide to
Content Analytics
Report 5:
PITCH
ACTIVITY
The
Eight Key
Reports
Using the Report
Most Popular Items to Pitch
List all pitched items, sorted by how often they were pitched (filtering out items that are only for internal use). Typically
you will find a (very) small number of items that get a lot of action, a group that goes out reasonably often, and a long
tail of small numbers (including a lot of zeroes).
• Low pitch counts generally represent a wasted investment. Infrequent use may be appropriate for highly
specialized items, but it probably isn’t for everything else. Are you building a lot of content that almost never
touches a customer?
• Are the right items getting pitched? Maybe sellers aren’t using the best content. But if they aren’t pitching what you
think they should, are you sure that you are right about what resonates with the customer? Reps are in constant
contact with prospects and they often know better than you do what messages are actually landing. In the above
report, maybe you were surprised to see that analyst report getting pitched so often – it turns out that customers
insist on hearing the message from a trusted third party rather than from the vendor. You need to focus on getting
more of that evidence.
Segment by Sales Team
Often the patterns are very different across different parts of the sales organization. Look at the top items by regional
sales team or by other ways that you segment (one product line vs. another, enterprise vs. SMB, and so forth). Compare
your top performing reps to the rest of the team they are on, looking for best (and worst!) practices.
Compare Pitching Activity
Are the reps in one team pitching more frequently than another? How do your eagles compare to the average seller in
terms of how many pitches they send? Activity does not equal results, but it is certainly a factor.
Item Source # Pitches
Introduction to Nexus Path Pitch Decks 389
Companies Adopt Cloud PBX Solutions Analyst Reports 180
Should Your PBX Move to the Cloud? Demand Generation 150
Cloud PBX – The New Revolution Demand Generation 110
Why Nexus Path Pitch Decks 80
Cloud PBX Overview Product Brochures 70
Yubay Medical Slashes Telco Spend Case Studies 49
Sample: Items Pitched in Last 6 Months by Enterprise Sellers
17. 17 The Definitive Guide to
Content Analytics
Report 6:
CONTENT
COMPARISON
The
Eight Key
Reports
After you publish your content, it is constantly modified and repackaged. Regional marketing teams
add local market data. Sellers customize decks for particular customers and segments. What is
happening to your content?
The content comparison report shows you how your content is evolving in the field. It lets you gather
insights from the reps who are interacting with customers every day.
Business Question: How is it being modified?
There are three ways that content is often modified in the field:
1. Presentations are customized for particular needs. New content is added to address the needs
of a particular market or a particular customer engagement. This is often necessary for sellers to
be effective in that situation, but generally doesn’t provide much insight for improving content
aimed at a general audience.
2. Decks are created by assembling slides from multiple sources. This is often done when sellers
think the standard decks aren’t telling the whole story customers need to hear.
3. Messaging is adjusted that doesn’t work. If sellers are frequently changing core slides, that
often means the original version isn’t working with customers. You may get some great ideas by
looking at the variations that sellers have created, but at a minimum you know that something is
probably wrong and needs to be addressed.
Typical Findings: Content is often modified and repackaged
Similar Items Items that are closely related to one another
Similar Slides Slides that are closely related to one another across decks
Key Data
18. 18 The Definitive Guide to
Content Analytics
Report 6:
CONTENT
COMPARISON
The
Eight Key
Reports
Using the Report
Review Item Variations
Find out how the field is modifying the content on its way to the customer. What parts of the deck are they changing?
What are they adding? Combine this with the content engagement report to find out whether some variations are
performing better in general, or with particular customer segments.
Review Slide Variations
Find the ways that individual slides are being modified and repackaged. Perhaps some of the slides are being used
but not being modified, indicating that the reps like them as is, but other slides have many different variations. That
indicates an area where the standard messaging is not working, and reps are trying to tighten it up and make it
work better. Look for slides in a deck that are pitched far more or less often than others – that means that when reps
repackage, they are choosing to leave out some slides and to repeatedly use others. That shows the content they feel
is really effective.
Segment for Additional Insight
In the sample report above, we are looking at the slides of the standard product overview deck and seeing the
variations being used in the UK market. Notice that the third slide, giving a detailed product overview, has not been
touched. The intro slide has been changed quite often to reflect local market conditions, which is expected. However,
the second slide showing the value proposition has a surprising number of variations that are quite different from
the original, suggesting that the standard positioning isn’t working in that market and reps are trying to make it more
compelling. That’s something to dig into. Another way to segment is to look at the variations that have been created by
your highest performing reps – how do the eagles adjust content so it works better for them?
Sample: Slide Variations of Cloud PBX Overview in the UK Market
Slide Variations
24
8
24
0
18 7 3
6 3 2
60
77
102
19. 19 The Definitive Guide to
Content Analytics
Report 7:
CONTENT
ENGAGEMENT
The
Eight Key
Reports
You have built the content, reps found it, and liked it enough to pitch it to customers. But do the
customers pay any attention? What content do they spend time looking at, and what do they ignore
entirely or just look at briefly before moving on?
The content engagement report tells you what grabs their attention and what doesn’t. See the items
they look at, and where inside of those items they spend their time.
Business Question: Does it engage customers?
It’s often hard to get potential customers to look at content. Most pitches never get opened, and
those that do frequently get a cursory look before the prospect moves on. Typically there is a small
number of items that get much higher levels of interest from your potential customers.
• A fraction of the content you send out will often have much stronger open rates. Something about
the content intrigued them enough to take a look.
• But that’s usually not good enough – you also need to look at view duration – you don’t just want
clickbait that gets them to open up the content but then leaves them disappointed. Generally,
there will be a small amount of content that they open and spend time looking at. That’s the
content you want to identify.
Typical Findings: Most content is unengaging
Customer Views Which pitched items or slides did customers click through and view
Customer View Duration How long did customers spend viewing the item or the slide
Key Data
20. 20 The Definitive Guide to
Content Analytics
Report 7:
CONTENT
ENGAGEMENT
The
Eight Key
Reports
Using the Report
Most Viewed Item Families
An item family groups items together that are essentially the same. This happens continually as reps customize content
for particular customers. List the item families, sorted by the number of customer views they generated. Find the items
that customers open and engage with. Prune or improve content that gets pitched but doesn’t get customer attention.
Look for and learn from unappreciated gems that generate a lot of customer interest but are not pitched very often.
Most Engaging Slide Families
Slides are often repackaged into other decks. A slide family is the set of essentially identical slides pulled from decks
across the company. Analyze the true performance of each slide by measuring how much customer engagement it
gets, regardless of how it is pitched. The example report measures the performance of each slide in a deck. You can
see in column two that the slides have been repackaged 25 or more times into other decks. Looking at the results, the
number of times the slides have been pitched and viewed is similar, but the way customers engage is radically different.
They have some interest in the second slide, but it’s the first one – a feature comparison against the competition –
that really grabs their attention. Find the best performing version of the most engaging slides, so your decks have the
content customers seek out and linger on.
Segment for Additional Insight
Look at engagement by sales stage – perhaps you have strong and engaging content during the early part of the sales
cycle, but then it tails off and you are losing people. Or by content type, by region, and so forth.
Sample: Most Engaging Slides From Nexus Path Pitch Deck
Slide Variations Pitches Views View Time
25 389 160 345
35 360 190 221
33 395 240 19
21. 21 The Definitive Guide to
Content Analytics
Report 8:
BUSINESS
IMPACT
The
Eight Key
Reports
The ultimate goal of creating content is to close deals. How much do your content investments affect
the bottom line?
The business impact report answers that question. It tells you how many winning deals each piece
of content influenced and how much revenue those deals brought in. It also measures the change in
deal velocity and conversion when that content was used.
Business Question: Does it generate revenue?
Influenced Won Deals Number of successfully closed deals during which this piece of
content was shared with the customer
Influenced Revenue Revenue generated by the influenced won deals
Velocity Uplift How much faster (or slower) deals move forward when this content is
used (per stage or across whole cycle)
Convert Uplift How much more (or less) likely a deal was to convert when this
content is used (per stage or across the whole sales cycle)
Key Data
Typically, content falls into three main buckets in terms of business impact.
1. Since most of it doesn’t get used, pitched, or engage customers very well, unsurprisingly it has
little to no business impact.
2. There is a second group that does its bit to help move things along. Solid and useful, it serves an
important purpose, and you have to have it.
3. Then there is a small group of content that really moves the needle. For example, a compelling
case study with an industry leader that is right on target for a particular audience – it provides
great credibility and helps move more quickly and more often to the next sales stage. On
the other hand, there is also content that moves the needle the wrong way – for example, a
confusing and unconvincing pitch deck that turns off prospective customers right away. It has
highly negative business impact.
Typical Findings: A few items have high business impact
22. 22 The Definitive Guide to
Content Analytics
Report 8:
BUSINESS
IMPACT
The
Eight Key
Reports
Using the Report
Analyze the forest, not (just) the trees
When considering business impact and ROI, it is often useful to ask questions at a broad level. Look at categories of
content and compare the return you are getting from them to your level of investment. Maybe you’ve prioritized content
early in the funnel this fiscal year; is that paying off in terms of influencing and winning deals?
Find the Most Effective Instances
It can be hard to compare the business impact of radically different kinds of content – a case study vs. an infographic,
say. But it is very useful to compare how similar items perform. The report above looks at items intended to help
generate demand. It shows the results of using that content during the discovery stage, measuring the impact on stage
velocity and conversion. Is the content moving deals to the next stage? The most used piece touches a lot of deals and
basically defines the average in terms of impact. Some of the content seems to be little used and ineffective – maybe
you should get rid of it or improve it. But a couple of pieces seem to measurably improve the conversion rate and/or the
conversion velocity – maybe you should be using them a lot more often?
Compare Segments
Content effectiveness is not universal. Often something that works very well with one group of customers is not
effective with another. There may be regional differences – your customers in Asia may have different priorities
than the ones in Latin America. It might be customer size – large enterprises often need different information than
small and medium sized customers. Different vertical industries need to have content that is tailored to their specific
requirements. By analyzing business impact across segments, you can find the content that is extremely effective, and
you can see gaps where you aren’t getting the business results you need.
Sample: Business Impact of Demand Gen Content During Discovery
Item Type
Influenced
Won Deals
Influenced
Revenue
Velocity
Uplift
Convert
Uplift
Cloud PBX – The New Revolution Ebook 150 $4.6m -1% +0%
Moving Your PBX to the Cloud Ebook 40 $1.3m +10% +15%
Companies Adopt Cloud PBX Analyst Report 30 $1.1m +6% +0%
Mission Bay Testimonial Video 28 $900k +0% +4%
Is a Cloud PBX Right for You? Brochure 14 $500k -5% -3%
The PBX Takes to the Cloud Infographic 8 $55k 0% -20%
23. 23 The Definitive Guide to
Content Analytics
CALL
TO
ACTION
Engagement is the lifeblood of the sales conversation – an indifferent customer is a deal waiting to fail. And in our
hyper-informed age, you can’t deeply engage your customer without content. Use these reports to analyze and
optimize your engagement with customers throughout their buyer’s journey.
The purpose of analysis is to drive action.
Graphs and tables are a means to the end – the goal is to improve engagement with the customer as a way to drive
increased revenue and shorten the deal cycle. Each of the eight key reports answers an important business question,
identifying key issues and opportunities so that you know how to act.
Some of your content is old and outdated
Prune old content that is no longer needed
Create new items or new versions to replace older content
Is the content up to date?
You have an awareness problem Do targeted outreach within the sales teamDo reps find it?
Content is often modified and repackaged
Find core content that is frequently modified
Get into the field to find out why
Measure effectiveness of variations to find best practices
How is it being modified?
Most content is unengaging
Analyze what customers do care about
Actively hone your content to maximize engagement
Does it engage customers?
A few items have high business impact
Identify and prioritize content that yields the highest ROI
Remove or Improve content that doesn’t drive results
Does it generate revenue?
You have critical content gaps Prioritize missing content and build itDo reps have what they need?
Many items are being ignored
Get into the field and talk to the reps
Compare against the content that does get used
Remove or improve neglected content
Many items never reach a customer
What gets used?
What gets pitched?
Typical Findings Call to ActionBusiness Question