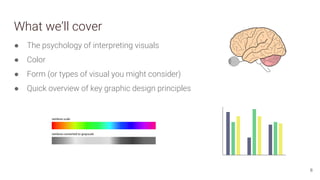
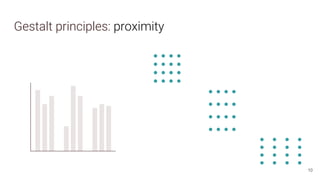
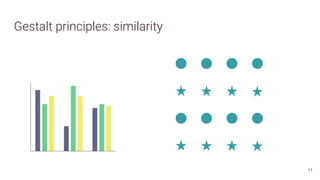
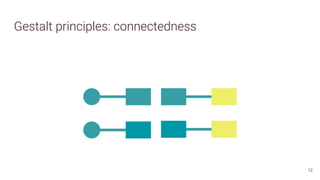
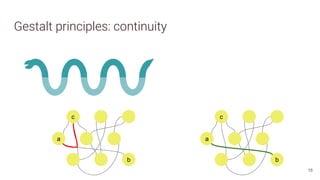
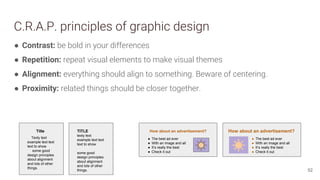
Design Principles for
Visualization
Jess Cohen-Tanugi
February 20, 2019
1:15pm-2:30pm, Fainsod Room
Littauer Building, Room 324
1
Visualization for data exploration and presentation.
2
What we imagine visualization is like:
Visualization for data exploration and presentation.
3
...10x
What it’s actually like.
Workflow for creating visualizations for presentation.
● Begin by defining the purpose of your visual(s) and its intended audience.
● Choose appropriate form(s) for intended function.
● Consider aesthetic/design principles.
4
Workflow for creating visualizations for presentation.
● Begin by defining the purpose of your visual(s) and its intended audience.
● Choose appropriate form(s) for intended function.
● Consider aesthetic/design principles.
5
this presentation.
What we’ll cover
6
● The psychology of interpreting visuals
● Color
● Form (or types of visual you might consider)
● Quick overview of key graphic design principles
Background and theory:
How do our brains process visuals?
7
Preattentive visual cues
3 9 2 8 1 0 2 4 3
5 8 7 1 3 4 5 9 2
0 4 6 2 7 3 2 2 9
9 4 8 2 7 5 1 0 3
8 1 9 4 0 2 6 3 5
3 9 2 8 1 0 2 4 3
5 8 7 1 3 4 5 9 2
0 4 6 2 7 3 2 2 9
9 5 8 1 2 5 1 0 6
8 1 9 4 0 2 6 3 5
8
Why bother? To add complexity.
9
Gestalt principles: proximity
10
Gestalt principles: similarity
11
Gestalt principles: connectedness
12
Gestalt principles: continuity
13
Gestalt principles: continuity
14
Gestalt principles: continuity
15
a
b
Gestalt principles: continuity
16
c
a
b
c
a
b
Gestalt principles: continuity
17
c
a
b
c
a
b
Curved lines make continuity easier to follow.
Gestalt principles: closure and common region
18
inside outside
inside outside
Applications
19
20
Some cues are more powerful than others
Green Red Blue
Purple Red Purple
Color
21
Color basics
22
C
M Y
R
B G
There are many ways to visualize color.
23
24
Choosing a palette: general guidelines
● You need different palettes for continuous,
divergent, and discrete data.
● 10 colors max for reliable differentiation
● Vary your palette in hue and brightness.
qualitative diverging
sequential
25
Color blindness
26
What happens when you use the wrong palette?
27
Tips for color usage
When color coding large background areas
overlaid with small colored symbols, consider
using all low-saturation, high-value (pastel)
colors for the background, together with
high-saturation symbols on the foreground.
28
Be intuitive.
Where there are cultural biases for certain color
choices, adhere to them.
29
Good use of color
previous record
24 36 12 38 25
30
Monochromatic, complementary, & analogous colors
31
Form
32
100% ? 100% ?
33
100% 50%
½ area
½ radius
100% 25%
34
24 36 12 38 25
Choose form based on the desired
purpose of your visualization.
35
Distributions
Comparisons
Proportions
x-y relationships
Geospatial and chronological
Network
Or something else entirely
42
Some examples
43
44
45
46
47
48
49
50
Design
51
C.R.A.P. principles of graphic design
● Contrast: be bold in your differences
● Repetition: repeat visual elements to make visual themes
● Alignment: everything should align to something. Beware of centering.
● Proximity: related things should be closer together.
52
Title
Texty text
example text text
text to show
some good
design principles
about alignment
and lots of other
things.
TITLE
texty text
example text text
text to show
some good
design principles
about alignment
and lots of other
things.
How about an advertisement?
● The best ad ever
● With an image and all
● It’s really the best
● Check it out
How about an advertisement?
● The best ad ever
● With an image and all
● It’s really the best
● Check it out
53
54
55
56
57
Questions?
58
...I’m happy to help!
Jessica Cohen-Tanugi
jessica_cohen-tanugi@harvard.edu
Or search “visualization” at library.harvard.edu and contact me there.
Image sources
Cairo, Alberto. The Functional Art: An Introduction to
Information Graphics and Visualization. Berkeley, CA: New
Riders, 2012. Slides 30, 35, 48-50.
Ware, Colin. Information Visualization, Third Ed. San
Francisco, CA: Morgan Kaufmann, 2012. Slides 18, 25, 28.
Cotnoir, Leigh. “Hue, Value, Saturation.” Published on
learn.leighcotnoir.com; link here. Slide 22.
Wilke, Claus O. Fundamentals of Data Visualization.
License CC-By-NC-ND.
https://serialmentor.com/dataviz/. Slides 26-28, 36-39.
RGB color cubes by Horst Frank, CC-BY-SA, slide 23.
Fivethirtyeight plot1, plot2, slide 19.
XKCD RGB, LotR, slides 24 and 42.
Verdant Labs, Politics by job, slide 45.
NYTimes, Election Maps, slides 41-42, 54.
Washington Post, “How a Pope is Elected.” Slides 56-57.
David Polley and Briana Marshall. “Visualizing Library
Collection Data.” Slides 42, 44.
59
Image sources
Hassan, Umar. “Making Timeline Charts in Tableau
Step-by-Step.” Slide 40.
Grandjean, Martin (2014). "La connaissance est un
réseau". Les Cahiers du Numérique 10 (3): 37-54.
CC-BY-SA. Slide 41.
Kencf0618. Facebook network diagram, CC-BY-SA. Slide
41.
KennyLJ. “Drug Testing Example.” Slide 29.
M. C. Hansen et al. “High-Resolution Global Maps of
21st-Century Forest Cover Change.” Slide 29.
Hannah Anderson and Matt Daniels. “Film dialogue from
2,000 Screenplays, broken down by gender and age.”
Slides 46-47.
60
McWade, John. Color palette picker visual, Before and
After Magazine. Slide 55.
Brooks, Megan, and Lindahl, Chrissa. Syllabus before and
after, from Design Principles: CRAP. Slide 53.
Color tools and reading
● Color picker
● Color Brewer
● Bjango Color Creator
● Adobe’s (free) color palette tool
Zhang, Samantha. “Finding the Right Color Palettes for
Data Visualizations.” GraphicIQ, 2015. Link here.
Simmon, Robert. “The subtleties of color.” NASA Earth
Observatory, 2013. Link here.
Cool guide about harmonious color palettes from a UX
perspective:
https://uxplanet.org/color-theory-brief-guide-for-design
ers-76e11c57eaa
61
Visualization:
Wilke, Claus O. Fundamentals of Data Visualization.
License CC-By-NC-ND.
https://serialmentor.com/dataviz/. (free online!)
Cairo, Alberto. The Functional Art: An Introduction to
Information Graphics and Visualization. Berkeley, CA:
New Riders, 2012. (Available online through Hollis).
Graphic Design:
Williams, Robin. Non-Designer’s Design Book, Fourth
Ed. San Francisco, CA: Peachpit Press, 2014.
(Available online through Hollis).
Helpful reading

design principles for visualization

  • 1.
    Design Principles for Visualization JessCohen-Tanugi February 20, 2019 1:15pm-2:30pm, Fainsod Room Littauer Building, Room 324 1
  • 2.
    Visualization for dataexploration and presentation. 2 What we imagine visualization is like:
  • 3.
    Visualization for dataexploration and presentation. 3 ...10x What it’s actually like.
  • 4.
    Workflow for creatingvisualizations for presentation. ● Begin by defining the purpose of your visual(s) and its intended audience. ● Choose appropriate form(s) for intended function. ● Consider aesthetic/design principles. 4
  • 5.
    Workflow for creatingvisualizations for presentation. ● Begin by defining the purpose of your visual(s) and its intended audience. ● Choose appropriate form(s) for intended function. ● Consider aesthetic/design principles. 5 this presentation.
  • 6.
    What we’ll cover 6 ●The psychology of interpreting visuals ● Color ● Form (or types of visual you might consider) ● Quick overview of key graphic design principles
  • 7.
    Background and theory: Howdo our brains process visuals? 7
  • 8.
    Preattentive visual cues 39 2 8 1 0 2 4 3 5 8 7 1 3 4 5 9 2 0 4 6 2 7 3 2 2 9 9 4 8 2 7 5 1 0 3 8 1 9 4 0 2 6 3 5 3 9 2 8 1 0 2 4 3 5 8 7 1 3 4 5 9 2 0 4 6 2 7 3 2 2 9 9 5 8 1 2 5 1 0 6 8 1 9 4 0 2 6 3 5 8
  • 9.
    Why bother? Toadd complexity. 9
  • 10.
  • 11.
  • 12.
  • 13.
  • 14.
  • 15.
  • 16.
  • 17.
    Gestalt principles: continuity 17 c a b c a b Curvedlines make continuity easier to follow.
  • 18.
    Gestalt principles: closureand common region 18 inside outside inside outside
  • 19.
  • 20.
    20 Some cues aremore powerful than others Green Red Blue Purple Red Purple
  • 21.
  • 22.
  • 23.
    There are manyways to visualize color. 23
  • 24.
  • 25.
    Choosing a palette:general guidelines ● You need different palettes for continuous, divergent, and discrete data. ● 10 colors max for reliable differentiation ● Vary your palette in hue and brightness. qualitative diverging sequential 25
  • 26.
  • 27.
    What happens whenyou use the wrong palette? 27
  • 28.
    Tips for colorusage When color coding large background areas overlaid with small colored symbols, consider using all low-saturation, high-value (pastel) colors for the background, together with high-saturation symbols on the foreground. 28
  • 29.
    Be intuitive. Where thereare cultural biases for certain color choices, adhere to them. 29
  • 30.
    Good use ofcolor previous record 24 36 12 38 25 30
  • 31.
  • 32.
  • 33.
  • 34.
    100% 50% ½ area ½radius 100% 25% 34
  • 35.
    24 36 1238 25 Choose form based on the desired purpose of your visualization. 35
  • 36.
  • 37.
  • 38.
  • 39.
  • 40.
  • 41.
  • 42.
    Or something elseentirely 42
  • 43.
  • 44.
  • 45.
  • 46.
  • 47.
  • 48.
  • 49.
  • 50.
  • 51.
  • 52.
    C.R.A.P. principles ofgraphic design ● Contrast: be bold in your differences ● Repetition: repeat visual elements to make visual themes ● Alignment: everything should align to something. Beware of centering. ● Proximity: related things should be closer together. 52 Title Texty text example text text text to show some good design principles about alignment and lots of other things. TITLE texty text example text text text to show some good design principles about alignment and lots of other things. How about an advertisement? ● The best ad ever ● With an image and all ● It’s really the best ● Check it out How about an advertisement? ● The best ad ever ● With an image and all ● It’s really the best ● Check it out
  • 53.
  • 54.
  • 55.
  • 56.
  • 57.
  • 58.
    Questions? 58 ...I’m happy tohelp! Jessica Cohen-Tanugi jessica_cohen-tanugi@harvard.edu Or search “visualization” at library.harvard.edu and contact me there.
  • 59.
    Image sources Cairo, Alberto.The Functional Art: An Introduction to Information Graphics and Visualization. Berkeley, CA: New Riders, 2012. Slides 30, 35, 48-50. Ware, Colin. Information Visualization, Third Ed. San Francisco, CA: Morgan Kaufmann, 2012. Slides 18, 25, 28. Cotnoir, Leigh. “Hue, Value, Saturation.” Published on learn.leighcotnoir.com; link here. Slide 22. Wilke, Claus O. Fundamentals of Data Visualization. License CC-By-NC-ND. https://serialmentor.com/dataviz/. Slides 26-28, 36-39. RGB color cubes by Horst Frank, CC-BY-SA, slide 23. Fivethirtyeight plot1, plot2, slide 19. XKCD RGB, LotR, slides 24 and 42. Verdant Labs, Politics by job, slide 45. NYTimes, Election Maps, slides 41-42, 54. Washington Post, “How a Pope is Elected.” Slides 56-57. David Polley and Briana Marshall. “Visualizing Library Collection Data.” Slides 42, 44. 59
  • 60.
    Image sources Hassan, Umar.“Making Timeline Charts in Tableau Step-by-Step.” Slide 40. Grandjean, Martin (2014). "La connaissance est un réseau". Les Cahiers du Numérique 10 (3): 37-54. CC-BY-SA. Slide 41. Kencf0618. Facebook network diagram, CC-BY-SA. Slide 41. KennyLJ. “Drug Testing Example.” Slide 29. M. C. Hansen et al. “High-Resolution Global Maps of 21st-Century Forest Cover Change.” Slide 29. Hannah Anderson and Matt Daniels. “Film dialogue from 2,000 Screenplays, broken down by gender and age.” Slides 46-47. 60 McWade, John. Color palette picker visual, Before and After Magazine. Slide 55. Brooks, Megan, and Lindahl, Chrissa. Syllabus before and after, from Design Principles: CRAP. Slide 53.
  • 61.
    Color tools andreading ● Color picker ● Color Brewer ● Bjango Color Creator ● Adobe’s (free) color palette tool Zhang, Samantha. “Finding the Right Color Palettes for Data Visualizations.” GraphicIQ, 2015. Link here. Simmon, Robert. “The subtleties of color.” NASA Earth Observatory, 2013. Link here. Cool guide about harmonious color palettes from a UX perspective: https://uxplanet.org/color-theory-brief-guide-for-design ers-76e11c57eaa 61 Visualization: Wilke, Claus O. Fundamentals of Data Visualization. License CC-By-NC-ND. https://serialmentor.com/dataviz/. (free online!) Cairo, Alberto. The Functional Art: An Introduction to Information Graphics and Visualization. Berkeley, CA: New Riders, 2012. (Available online through Hollis). Graphic Design: Williams, Robin. Non-Designer’s Design Book, Fourth Ed. San Francisco, CA: Peachpit Press, 2014. (Available online through Hollis). Helpful reading