This document provides an overview and categorization of various marketing research techniques. It separates the techniques into mature techniques that have been used for some time, such as correlation analysis and regression analysis, and modern techniques that are newer, such as decision trees, dynamic programming, and technological forecasting. For several of the techniques, a brief explanation of the approach is given. The overall purpose is to familiarize management with the key research tools used by researchers.
The document discusses Taguchi screening designs, which are a type of experimental design used in product development to identify the main factors affecting a process using a minimal number of tests. It explains key terms like experimental design, screening design, and Taguchi method. The document compares screening designs to full factorials and lists advantages and disadvantages of each. It provides details on how to set up and analyze Taguchi screening designs, including determining variables and levels, selecting a screening design, setting up the test matrix, analyzing main effects plots, and confirming results. Resources on experimental design are also listed.
Guidelines to Understanding Design of Experiment and Reliability Predictionijsrd.com
This paper will focus on how to plan experiments effectively and how to analyse data correctly. Practical and correct methods for analysing data from life testing will also be provided. This paper gives an extensive overview of reliability issues, definitions and prediction methods currently used in the industry. It defines different methods and correlations between these methods in order to make reliability comparison statements from different manufacturers' in easy way that may use different prediction methods and databases for failure rates. The paper finds however such comparison very difficult and risky unless the conditions for the reliability statements are scrutinized and analysed in detail.
Generalized Analysis of Value Behavior over Time
as a
Project Performance Predictor
As projects have grown more complex our performance analysis frameworks have
remained largely unchanged even as newer more powerful tools have become available
to manage and manipulate large volumes of data. Newer analytical tools provide deeper
insights into existing data sets especially from a statistical point of view but we continue
to use traditional project metrics to assess project performance on both a retrospective
as well as prospective basis.
This document discusses 21 parameters for designing rigorous, robust, and realistic operational tests. The parameters unite principles of design of experiments with test architecture and execution considerations. Some key parameters discussed include having sufficient sample sizes to ensure adequate confidence and power in conclusions, using continuous and precise primary measures of performance, including and strategically controlling all relevant factors and factor levels, and ensuring like trial conditions are alike during test execution. The goal is to systematically characterize system performance across different conditions rather than just verify requirements in a single set of conditions.
This document summarizes a knowledge engineering approach using analytic hierarchy process (AHP) to resolve conflicts between experts in risk-related decision making. It proposes using a modified version of AHP to increase transparency in the analysis procedure. This allows identification of major causes of inter-expert discrepancy, which are differences in unstated assumptions and subjective weightings of risk factors. The document demonstrates how AHP can systematically decompose complex decision problems, evaluate alternatives based on multiple criteria, and aggregate results to provide an overall evaluation that incorporates differing expert opinions in a consistent manner.
This document discusses using design failure mode and effects analysis (dFMEA) to improve quality function deployment (QFD) and the theory of inventive problem solving (TRIZ) for computational simulation of component durability. It provides background on dFMEA processes and outlines how dFMEA can be applied to optimize durability simulation by considering potential failure modes and their causes early in the design process. Robustness tools like p-diagrams and boundary diagrams are also discussed as complementary to dFMEA for preventing failures through robust design.
The document discusses various techniques for project planning and cost estimation in software development projects. It covers topics such as project planning, scheduling, risk analysis, cost estimation models like COCOMO, and agile planning techniques like release planning in XP. Project planning involves breaking work into tasks, assigning resources, anticipating risks. Cost is estimated using experience-based techniques or algorithmic models that take into account factors like size, reuse, and team capabilities. Agile methods use iterative planning to select stories for increments based on priorities and progress.
Gear up Your Career with ASQ Certified Reliability Engineer (CRE) CertificationMeghna Arora
Start Here---> http://bit.ly/2BV2GbO <---Get complete detail on CRE exam guide to crack Reliability Engineer. You can collect all information on CRE tutorial, practice test, books, study material, exam questions, and syllabus. Firm your knowledge on Reliability Engineer and get ready to crack CRE certification. Explore all information on CRE exam with the number of questions, passing percentage, and time duration to complete the test.
This document discusses various optimization techniques used in pharmaceutical development. It begins with defining optimization and providing an outline of topics to be covered, including key terms, parameters, experimental designs, applied methods, and references. Experimental designs discussed include factorial, response surface, central composite, Box-Behnken, Plackett-Burman, and Taguchi designs. Applied optimization methods include classic optimization techniques using calculus as well as statistical methods like EVOP. The objective of pharmaceutical optimization is to develop the optimal formulation while reducing costs through fewer experiments.
This document provides an overview of operational excellence and design of experiments (DOE). It defines key DOE terms and concepts, including factors, levels, interactions, resolution, coding/decoding variables. It discusses the objectives of different DOE designs (screening, modeling, optimizing) and considerations for choosing a design based on factors, levels, and resources. Guidelines are given for planning, executing, and analyzing a DOE. Examples are provided to illustrate DOE concepts like resolution, coding variables, and a full factorial design. The overall purpose is to introduce the reader to the technique of DOE for improving processes.
The document discusses analyzing software architectures and making design decisions. It describes several benefits of architecture evaluation such as cost savings, early problem detection, and improved quality. It also outlines techniques for architecture evaluation including ATAM and CBAM. The document discusses moving from single systems to product lines, using off-the-shelf components which requires managing architectural mismatches, and searching for compatible components. Finally, it examines how software architecture may evolve in the future as programming languages and tools continue to develop.
1. Software project estimation involves decomposing a project into smaller problems like major functions and activities. Estimates can be based on similar past projects, decomposition techniques, or empirical models.
2. Accurate estimates depend on properly estimating the size of the software product using techniques like lines of code, function points, or standard components. Baseline metrics from past projects are then applied to the size estimates.
3. Decomposition techniques involve estimating the effort needed for each task or function and combining them. Process-based estimation decomposes the software process into tasks while problem-based estimation decomposes the problem.
Data Evaluation and Modeling for Product Definition Engineering - ISE 677Justin Davies
This document discusses process planning and control for drafting activities at a product design engineering department of a gas turbine energy company. It summarizes the steps taken to analyze the current state of operations, identify inefficiencies, and develop metrics to measure performance and enable planning. Initial analysis using network flow diagrams revealed instances of rework loops and delays. Data from time logs was analyzed but found to have skewed distributions, making it difficult to establish baselines or track trends. Further analysis highlighted issues with the time logging tool and subjective estimates. A normalization method using confidence intervals was developed to establish a measurement baseline and enable improved planning and workload management.
Operations research is a scientific approach to problem solving and decision making that is useful for managing organizations. It has its origins in World War II and is now widely used in business and industry. Some key areas where operations research models are applied include forecasting, production scheduling, inventory control, and transportation. Models are an essential part of operations research and can take various forms like physical, mathematical, or conceptual representations of real-world problems. Models are classified in different ways such as by their structure, purpose, solution method, or whether they consider deterministic or probabilistic systems. Operations research techniques help solve complex business problems through mathematical analysis and support improved organizational performance.
This document presents a new approach to measuring generic attributes (GAs) as part of process appraisals. It defines two GAs - Usefulness and Cost Effectiveness. Usefulness measures how well process outputs meet user needs. Cost Effectiveness measures whether the benefits of process outputs are worth the resources invested. The approach improves on prior GA definitions by focusing measurements on key process outputs, distinguishing between producers and users of outputs, and using objective evidence. It provides a practical method for incorporating GAs into process appraisals to evaluate the real-world performance and value of processes.
Optimization technology and screening design sathish h tSatishHT1
This document discusses various design of experiment methodologies including screening designs and optimization designs. It provides examples of factorial designs, response surface designs like central composite designs and Box-Behnken designs, and three-level full factorial designs. It also gives an example of using a fractional factorial design to screen critical processing parameters in a wet granulation coating process and selecting a three-level full factorial design to optimize two factors, blending speed and time, in a dry mixing process to investigate their interactive and quadratic effects on the response.
Conceptualization of a Domain Specific Simulator for Requirements Prioritizationresearchinventy
This paper conceptualizes a domain specific simulator for requirements prioritization; its aims at helping to identify appropriate prioritization strategies for a project in hand. The possible existing scenarios are difficult to analyze; they involve different variables, like the selection of: stakeholders (their availability, expertise, and importance); prioritization criteria; and prioritization methods. To demonstrate the feasibility of the proposed simulator elements, a well established general purpose simulator, called Arena, was used. The results demonstrate that, it is possible to build the suggested scenarios in order to study and make inferences about the prioritization strategies.
Detailed description of the use case point estimation method use to estimate the size of Application before Developing it. This Model is used in Software Engineering Field
1. The document discusses various project selection methods, economic models for evaluating projects, and key project metrics like IRR, payback period, ROI, EVA, and opportunity cost.
2. It also covers topics related to project change management including change control, integrated change control, corrective and preventive actions, and how they impact project baselines.
3. Additional areas covered include scope management, quality planning, risk management, communication management, and procurement contract types.
This document discusses design of experiments (DoE) and its application in formulation development. It defines key terms like independent variables, dependent variables, levels, quality target product profile, critical process parameters, and critical quality attributes. It describes different types of DoE like factorial designs, response surface designs, central composite design, and Box-Behnken design. It provides an example of using a three-factor, three-level Box-Behnken design to investigate formulation variables affecting droplet size, drug release, and solubility of a fenofibrate SMEDDS formulation. Statistical software was used to fit the experimental results to a quadratic mathematical model.
This document discusses architecture evaluation methods. It describes what an architecture is and important quality attributes like usability, functionality, and reliability. It explains that evaluating an architecture early identifies problems and risks. Methods discussed include SAAM, which uses scenarios from stakeholder perspectives to classify how the architecture would handle direct and indirect scenarios, and identify components that would need modification. Evaluating architectures provides benefits like clarifying goals and risks, while also requiring costs of time and money.
DMAIC addressed Bearnson S-N tracking for all product.Bill Bearnson
1) The document describes the DMAIC process for continuous improvement. It consists of five steps: Define, Measure, Analyze, Improve, and Control.
2) An example project at L-3 CSW aimed to track configurations of delivered products to reduce rework, diagnose issues more quickly, and improve service. They lacked a centralized database to record hardware changes.
3) The root cause was high production demand requiring faster turnaround times. Records of configurations and changes were kept in multiple places, causing delays and redundant work to diagnose returned units. The project combined data from five sources into a searchable master database to improve traceability of configurations.
Effect of Temporal Collaboration Network, Maintenance Activity, and Experienc...ESEM 2014
Context: Number of defects fixed in a given month is used as an input for several project management decisions such as release time, maintenance effort estimation and software quality assessment. Past activity of developers and testers may help us understand the future number of reported defects. Goal: To find a simple and easy to implement solution, predicting defect exposure. Method: We propose a temporal collaboration network model that uses the history of collaboration among developers, testers, and other issue originators to estimate the defect exposure for the next month. Results: Our empirical results show that temporal collaboration model could be used to predict the number of exposed defects in the next month with R2 values of 0.73. We also show that temporality gives a more realistic picture of collaboration network compared to a static one. Conclusions: We believe that our novel approach may be used to better plan for the upcoming releases, helping managers to make evidence based decisions
Architecture evaluation methods help assess an architecture's ability to meet quality goals like usability, reliability and performance. The Software Architecture Analysis Method (SAAM) uses scenarios to evaluate an architecture. SAAM involves stakeholders developing prioritized scenarios, describing the architecture, classifying scenarios, performing scenario evaluations, and generating an overall assessment. Scenarios can be direct, testing current functionality, or indirect, requiring changes to assess modification difficulty. SAAM identifies issues like many scenarios affecting the same components. Architecture evaluations are beneficial early in development to surface tradeoffs and risks.
Risks are potential problems that might affect the successful completion of a software project. Risks involve uncertainty and potential losses. Risk analysis and management are intended to help a software team understand and manage uncertainty during the development process. The important thing is to remember that things can go wrong and to make plans to minimize their impact when they do. The work product is called a Risk Mitigation, Monitoring, and Management Plan (RMMM).
This document discusses the role of engineering analysis in design. It begins by defining analysis as breaking down objects into basic elements to understand their essence. Analysis involves applying tools like mathematics and physics to study objects and identify relationships. Analysis provides internal guidance for projects and is critical for design. The document then discusses different aspects of applying analysis, including the relationship between analysis and experience, when theoretical guidance should be provided in design, and how to handle discrepancies between theory and experiment. It also discusses developing both logical and intuitive thinking skills in engineers and the complementary roles of analysis and creativity in design. Finally, it covers topics like reliability, safety, statistics, and examples of engineering projects.
The document discusses the differences between traditional notions of software engineering and a more empirical "real software engineering" approach. It argues that software is different from other engineering domains due to its complexity, unpredictability, and ability to change rapidly through testing and experimentation. A defined, documentation-heavy process is not suitable for software. Instead, an empirical approach using techniques like pair programming, short iterations, and frequent testing allows software to be engineered effectively through a process of continuous adaptation.
This document discusses optimization problems in engineering applications. It begins by defining optimization and describing how it can be applied to engineering problems to minimize costs or maximize benefits. Some examples of engineering applications that can be optimized are described, such as designing structures for minimum cost or maximum efficiency. The document then discusses procedures for solving optimization problems, including recognizing and defining the problem, constructing a model, and implementing solutions. It also describes different types of optimization problems and methods for solving linear programming problems, including the graphical and simplex methods.
The document discusses Design for Six Sigma (DFSS) and its 14 step process. It begins with defining customer requirements and needs, then measuring key product characteristics. Next it analyzes potential problems, develops conceptual designs, and conducts reliability analysis. Steps also include optimizing the design through techniques like robust design and tolerance mapping. The process concludes with verifying the design meets predictions, developing manufacturing controls, and validating the design transition. The overall goal of DFSS is to design products and processes that meet customer needs with built-in quality from the beginning.
Benchmarking is an improvement process where a company measures its performance against best-in-class companies to determine how they achieved high performance levels and then uses that information to improve its own performance. A Black Belt is a full-time Six Sigma project leader who is certified after extensive training and successful completion of projects under a Master Black Belt's guidance. The "Breakthrough Strategy" involves four phases - Measure, Analyze, Improve and Control - to drive data-driven Six Sigma process improvement.
This document provides information about project management quality assurance including forms, tools, and strategies. It discusses quality assurance management and outlines several quality management tools: check sheets, control charts, Pareto charts, scatter plots, Ishikawa diagrams, and histograms. These tools can help assess quality requirements, identify issues, and improve processes. The document also lists additional topics related to project management quality assurance that are available as PDF downloads.
In the present paper, applicability and
capability of A.I techniques for effort estimation prediction has
been investigated. It is seen that neuro fuzzy models are very
robust, characterized by fast computation, capable of handling
the distorted data. Due to the presence of data non-linearity, it is
an efficient quantitative tool to predict effort estimation. The one
hidden layer network has been developed named as OHLANFIS
using MATLAB simulation environment.
Here the initial parameters of the OHLANFIS are
identified using the subtractive clustering method. Parameters of
the Gaussian membership function are optimally determined
using the hybrid learning algorithm. From the analysis it is seen
that the Effort Estimation prediction model developed using
OHLANFIS technique has been able to perform well over normal
ANFIS Model.
The document proposes updated definitions for technology, manufacturing, and services readiness levels based on lean product development principles. It argues the current definitions promote a flawed "build-test-fix" approach and presents alternative "Lean TRL", "Lean MRL", and "SRL" definitions grounded in robust design, design for six sigma, and lean principles. The updated levels aim to characterize and validate performance earlier to reduce costly late iterations compared to the conventional approach.
Requirement analysis is the process of determining user expectations for a new or modified product. It bridges the planning and production stages of a project to ensure all expectations are understood and addressed. Requirement analysis includes reviewing the entire process from the user's perspective and creating use case diagrams and prototypes. Conducting requirement analysis is important as it allows a product to meet stakeholder expectations by identifying features, ensuring proper analysis, and giving stakeholders a chance to provide feedback.
Value realisation can be described as the extracted value from project or from underlying processes. To extract a value, innovation is the key in every project.
The document discusses system architecture and defines several key concepts:
- An architecture describes an operational concept, processes, components, and relationships among components. It includes functional and physical architectures.
- Structured analysis is a process-oriented approach that uses functional decomposition and models like activity, data, rule, and dynamics models.
- The object-oriented approach uses UML diagrams to model static and dynamic behavior.
- Architectures must be evaluated based on verification, consistency, correctness, performance, and requirements.
- The DoD architecture framework defines operational, system, and technical standard views with multiple representations. It uses functional decomposition.
The document discusses system architecture and functional analysis. It begins by defining system architecture as the process of creating complex, unprecedented systems. It then discusses defining architectures, including operational concepts, processes, components, and functional vs physical architectures. It covers structured analysis approaches, including functional decomposition models, data models, rule models, and performance evaluation. Object-oriented approaches and the DoD architecture framework are also summarized. The document then discusses functional analysis, including elements like functions, functional diagrams, processing instructions, and control flow. Methods like functional decomposition, simple vs complete functionalities, and evaluating functional architectures are also covered.
The document discusses system architecture and functional analysis. It covers:
1. The definition of system architecture as the process of creating complex, unprecedented systems to meet ill-defined requirements driven by evolving technology and globalization.
2. Key elements of architectures including the operational concept, processes, components, and selection of systems in a system of systems.
3. Functional analysis examines the activities a system must perform to achieve outputs by transforming inputs. It considers functions, data flows, processing instructions, and control logic.
4. Functional decomposition breaks down a top-level function into subordinate functions using a hierarchical tree structure. Composition builds up from simple functionalities to complete functionalities.
This document proposes applying kanban scheduling techniques to systems engineering activities in rapid response environments. It describes how systems engineering could be modeled as a set of continuous and taskable services that flow through a kanban scheduling system. This approach aims to improve integration and use of scarce SE resources, provide flexibility and predictability, enable visibility and coordination across projects, and reduce governance overhead. The document defines key aspects of a kanban scheduling system for SE, including work items, activities, resources, queues, and flow metrics. It argues this approach could better support SE in rapid response compared to traditional methods.
Software Engineering Important Short Question for ExamsMuhammadTalha436
The document discusses various topics related to software engineering including:
1. The software development life cycle (SDLC) and its phases like requirements, design, implementation, testing, etc.
2. The waterfall model and its phases from modeling to maintenance.
3. The purpose of feasibility studies, data flow diagrams, and entity relationship diagrams.
4. Different types of testing done during the testing phase like unit, integration, system, black box and white box testing.
AFITC 2018 - Using Process Maturity and Agile to Strengthen Cyber SecurityDjindo Lee
The premise of this innovative development effort is that the merging of process maturity (>CMMI 3) and agile DevSecOps can contribute to cyber hardness/resiliency without sacrificing responsiveness, capability and quality. The target of this case study was a federal agency that required increased feature delivery rates to better meet the demand for system updates (to include existing cyber threats), low production defect density and vulnerability forecasting/minimization. Using Discrete Event Simulation (DES) to model the entire Agile process provided a holistic approach to capturing and depicting the sprint lifecycle. The model accounted for the lifecycle including development of user stories, design, development and test within individual sprints. The payoff was a twenty percent increase in user stories per release than originally planned and a production defect density of only three percent. This approach may be applied to improve the security posture of the Air Force systems as they are being built.
This is the part of the presentation done by a PMP Workgroup which includes the project managers from NashTech, Trobz and Besco to study the Project Management and get the PMP certification. This part describes the process of Sequencing Activities in the Project Schedule Management knowledge area.
Cybernetics in supply chain managementLuis Cabrera
This document discusses the role of operations research and simulation modeling in developing a cybernetic dynamic simulation model of a manufacturing supply chain system. It notes that production planning is a key but complex component that benefits from mathematical algorithms and computer modeling. Simulation allows analyzing complex systems with many variables and obtaining solutions that aren't possible with closed-form equations. The document provides examples of why simulation is useful and discusses representing real-world processes and testing different configurations and policies.
Technology assessment case study implementation and adoption of a statistical...D-Wise
This document discusses d-Wise Technologies' work with a pharmaceutical client to implement a Statistical Computing Environment (SCE). The SCE is a clinical data repository and analytics platform using SAS Drug Development software. D-Wise helped develop a strategic implementation plan in phases, prioritizing quick wins. They facilitated meetings to define the project scope and priorities. The resulting plan took an iterative approach to rolling out the SCE and addressing change management challenges. A pilot implementation of the SCE core technology was also recommended.
Proceedings of the 2015 Industrial and Systems Engineering Res.docxwkyra78
Proceedings of the 2015 Industrial and Systems Engineering Research Conference
S. Cetinkaya and J. K. Ryan, eds.
Use of Symbolic Regression for Lean Six Sigma Projects
Daniel Moreno-Sanchez, MSc.
Jacobo Tijerina-Aguilera, MSc.
Universidad de Monterrey
San Pedro Garza Garcia, NL 66238, Mexico
Arlethe Yari Aguilar-Villarreal, MEng.
Universidad Autonoma de Nuevo Leon
San Nicolas de los Garza, NL 66451, Mexico
Abstract
Lean Six Sigma projects and the quality engineering profession have to deal with an extensive selection of tools
most of them requiring specialized training. The increased availability of standard statistical software motivates the
use of advanced data science techniques to identify relationships between potential causes and project metrics. In
these circumstances, Symbolic Regression has received increased attention from researchers and practitioners to
uncover the intrinsic relationships hidden within complex data without requiring specialized training for its
implementation. The objective of this paper is to evaluate the advantages and drawbacks of using computer assisted
Symbolic Regression within the Analyze phase of a Lean Six Sigma project. An application of this approach in a
service industry project is also presented.
Keywords
Symbolic Regression, Data Science, Lean Six Sigma
1. Introduction
Lean Six Sigma (LSS) has become a well-known hybrid methodology for quality and productivity improvement in
organizations. Its wide adoption in several industries has shaped Process Innovation and Operational Excellence
initiatives, enabling LSS to become a main topic in quality practitioner sites of interest [1], recognized Six Sigma
(SS) certification body of knowledge contents [2], and professional society conferences [3].
However LSS projects and the quality engineering profession have to deal with an extensive selection of tools most
of them requiring specialized training. To assist LSS practitioners it is common to categorize tools based on the
traditional DMAIC model which stands for Define, Measure, Analyze, Improve, and Control phases. Table 1
presents an overview of the main tools that are commonly used in each phase of a LSS project, allowing team
members to progressively develop an understanding between realizing each phase’s intent and how the selected
tools can contribute to that purpose.
This paper focuses on the Analyze phase where tools for statistical model building are most likely to be selected.
The increased availability of standard statistical software motivates the use of advanced data science techniques to
identify relationships between potential causes and project metrics. In these circumstances Symbolic Regression
(SR) has received increased attention from researchers and practitioners even though SR is still in an early stage of
commercial availability.
The objective of this paper is to evaluate the advantages and drawbacks o ...
Similar to Design for Reliability Readiness Plan in DFSS (20)
Using recycled concrete aggregates (RCA) for pavements is crucial to achieving sustainability. Implementing RCA for new pavement can minimize carbon footprint, conserve natural resources, reduce harmful emissions, and lower life cycle costs. Compared to natural aggregate (NA), RCA pavement has fewer comprehensive studies and sustainability assessments.
A SYSTEMATIC RISK ASSESSMENT APPROACH FOR SECURING THE SMART IRRIGATION SYSTEMSIJNSA Journal
The smart irrigation system represents an innovative approach to optimize water usage in agricultural and landscaping practices. The integration of cutting-edge technologies, including sensors, actuators, and data analysis, empowers this system to provide accurate monitoring and control of irrigation processes by leveraging real-time environmental conditions. The main objective of a smart irrigation system is to optimize water efficiency, minimize expenses, and foster the adoption of sustainable water management methods. This paper conducts a systematic risk assessment by exploring the key components/assets and their functionalities in the smart irrigation system. The crucial role of sensors in gathering data on soil moisture, weather patterns, and plant well-being is emphasized in this system. These sensors enable intelligent decision-making in irrigation scheduling and water distribution, leading to enhanced water efficiency and sustainable water management practices. Actuators enable automated control of irrigation devices, ensuring precise and targeted water delivery to plants. Additionally, the paper addresses the potential threat and vulnerabilities associated with smart irrigation systems. It discusses limitations of the system, such as power constraints and computational capabilities, and calculates the potential security risks. The paper suggests possible risk treatment methods for effective secure system operation. In conclusion, the paper emphasizes the significant benefits of implementing smart irrigation systems, including improved water conservation, increased crop yield, and reduced environmental impact. Additionally, based on the security analysis conducted, the paper recommends the implementation of countermeasures and security approaches to address vulnerabilities and ensure the integrity and reliability of the system. By incorporating these measures, smart irrigation technology can revolutionize water management practices in agriculture, promoting sustainability, resource efficiency, and safeguarding against potential security threats.
Redefining brain tumor segmentation: a cutting-edge convolutional neural netw...IJECEIAES
Medical image analysis has witnessed significant advancements with deep learning techniques. In the domain of brain tumor segmentation, the ability to
precisely delineate tumor boundaries from magnetic resonance imaging (MRI)
scans holds profound implications for diagnosis. This study presents an ensemble convolutional neural network (CNN) with transfer learning, integrating
the state-of-the-art Deeplabv3+ architecture with the ResNet18 backbone. The
model is rigorously trained and evaluated, exhibiting remarkable performance
metrics, including an impressive global accuracy of 99.286%, a high-class accuracy of 82.191%, a mean intersection over union (IoU) of 79.900%, a weighted
IoU of 98.620%, and a Boundary F1 (BF) score of 83.303%. Notably, a detailed comparative analysis with existing methods showcases the superiority of
our proposed model. These findings underscore the model’s competence in precise brain tumor localization, underscoring its potential to revolutionize medical
image analysis and enhance healthcare outcomes. This research paves the way
for future exploration and optimization of advanced CNN models in medical
imaging, emphasizing addressing false positives and resource efficiency.
Literature Review Basics and Understanding Reference Management.pptxDr Ramhari Poudyal
Three-day training on academic research focuses on analytical tools at United Technical College, supported by the University Grant Commission, Nepal. 24-26 May 2024
KuberTENes Birthday Bash Guadalajara - K8sGPT first impressionsVictor Morales
K8sGPT is a tool that analyzes and diagnoses Kubernetes clusters. This presentation was used to share the requirements and dependencies to deploy K8sGPT in a local environment.
ACEP Magazine edition 4th launched on 05.06.2024Rahul
This document provides information about the third edition of the magazine "Sthapatya" published by the Association of Civil Engineers (Practicing) Aurangabad. It includes messages from current and past presidents of ACEP, memories and photos from past ACEP events, information on life time achievement awards given by ACEP, and a technical article on concrete maintenance, repairs and strengthening. The document highlights activities of ACEP and provides a technical educational article for members.
Batteries -Introduction – Types of Batteries – discharging and charging of battery - characteristics of battery –battery rating- various tests on battery- – Primary battery: silver button cell- Secondary battery :Ni-Cd battery-modern battery: lithium ion battery-maintenance of batteries-choices of batteries for electric vehicle applications.
Fuel Cells: Introduction- importance and classification of fuel cells - description, principle, components, applications of fuel cells: H2-O2 fuel cell, alkaline fuel cell, molten carbonate fuel cell and direct methanol fuel cells.
Advanced control scheme of doubly fed induction generator for wind turbine us...IJECEIAES
This paper describes a speed control device for generating electrical energy on an electricity network based on the doubly fed induction generator (DFIG) used for wind power conversion systems. At first, a double-fed induction generator model was constructed. A control law is formulated to govern the flow of energy between the stator of a DFIG and the energy network using three types of controllers: proportional integral (PI), sliding mode controller (SMC) and second order sliding mode controller (SOSMC). Their different results in terms of power reference tracking, reaction to unexpected speed fluctuations, sensitivity to perturbations, and resilience against machine parameter alterations are compared. MATLAB/Simulink was used to conduct the simulations for the preceding study. Multiple simulations have shown very satisfying results, and the investigations demonstrate the efficacy and power-enhancing capabilities of the suggested control system.
CHINA’S GEO-ECONOMIC OUTREACH IN CENTRAL ASIAN COUNTRIES AND FUTURE PROSPECTjpsjournal1
The rivalry between prominent international actors for dominance over Central Asia's hydrocarbon
reserves and the ancient silk trade route, along with China's diplomatic endeavours in the area, has been
referred to as the "New Great Game." This research centres on the power struggle, considering
geopolitical, geostrategic, and geoeconomic variables. Topics including trade, political hegemony, oil
politics, and conventional and nontraditional security are all explored and explained by the researcher.
Using Mackinder's Heartland, Spykman Rimland, and Hegemonic Stability theories, examines China's role
in Central Asia. This study adheres to the empirical epistemological method and has taken care of
objectivity. This study analyze primary and secondary research documents critically to elaborate role of
china’s geo economic outreach in central Asian countries and its future prospect. China is thriving in trade,
pipeline politics, and winning states, according to this study, thanks to important instruments like the
Shanghai Cooperation Organisation and the Belt and Road Economic Initiative. According to this study,
China is seeing significant success in commerce, pipeline politics, and gaining influence on other
governments. This success may be attributed to the effective utilisation of key tools such as the Shanghai
Cooperation Organisation and the Belt and Road Economic Initiative.
A review on techniques and modelling methodologies used for checking electrom...nooriasukmaningtyas
The proper function of the integrated circuit (IC) in an inhibiting electromagnetic environment has always been a serious concern throughout the decades of revolution in the world of electronics, from disjunct devices to today’s integrated circuit technology, where billions of transistors are combined on a single chip. The automotive industry and smart vehicles in particular, are confronting design issues such as being prone to electromagnetic interference (EMI). Electronic control devices calculate incorrect outputs because of EMI and sensors give misleading values which can prove fatal in case of automotives. In this paper, the authors have non exhaustively tried to review research work concerned with the investigation of EMI in ICs and prediction of this EMI using various modelling methodologies and measurement setups.
A review on techniques and modelling methodologies used for checking electrom...
Design for Reliability Readiness Plan in DFSS
1. ABOUTthe
AUTHORS
“Readiness Plan,” p. 9
Matthew Hu (matthew.hu@hp.com) is a senior quality program manager for
Hewlett-Packard Co. in Houston. He earned his doctorate in quality and reliability
engineering from Wayne State University in Detroit. Hu is a senior member of
ASQ and holds ASQ certifications as a reliability engineer and a quality engineer.
“No Silver Bullet,” p. 17
Francisco A. Hernandez Jr. (hernandezjr_francisco@bah.com) is an associate at
Booz Allen Hamilton in Washington, D.C. He earned an MBA from the University of San
Francisco. Hernandez is an ASQ member and an ASQ-certified Six Sigma Black Belt.
“As Easy as 1, 3, 9?” p. 23
Dan Zwillinger (zwilling@az-tec.com) is a consultant in Boston. He
earned a doctorate in applied mathematics from the California Institute of
Technology in Pasadena. Zwillinger is an ASQ-certified Six Sigma Black Belt.
s i x s i g m a f o r u m m a g a z i n e I a u g u s t 2 0 1 3 I 3
call for articles
Six Sigma Forum Magazine is seeking articles for publication.
For information on the review process, types
of articles considered, and the submission
requirements, go to www.asq.org/pub/sixsigma.
2. S
ystem reliability is a key requirement for a system to function suc-
cessfully under the full range of conditions experienced in the oil
industry. From a probabilistic viewpoint, reliability is defined as the
probability a system will meet its intended function under stated conditions
for a specified period of time; therefore, to predict reliability, you must
know three things:
1. Function.
2. Stated conditions.
3. The specified useful life or time period.
A typical textbook that addresses reliability will present a set of proba-
bilistic concepts, such as a survival function, failure rates and mean times
between failures. These concepts are related to a model of the causes of
failure, such as component reliabilities or material and environmental
variability. To quantify, specified operating conditions are defined as an
agreed-upon range of allowable conditions or an estimated probability
density function for uncertain or variable parameters. This approach is well
suited to calculating predicted failure rates when all of the data are available.
To improve reliability prediction capability when useful data are not avail-
able or not sufficient, an alternative approach can be:
• Identify all potential function failure modes, make a risk assessment
and implement countermeasures.
• Make the product insensitive to user environments.
• Identify shortfalls in verification test plans and enhance verification
tests to ensure detection of all failure modes.
• Execute efficient verification tests that demonstrate a product is mis-
take free and robust under real-world use conditions.
System reliability requires fulfilling two critical conditions: mistake avoid-
ance and robustness.1
Mistake, in this case, is defined as the error due to design decision and
manufacturing operations. Examples of mistakes in product development
include missing components, installing a component backwards or interpret-
ing a software command as being expressed in inches when it’s actually in
centimeters. Product reliability can be improved by reducing the incidence
of such mistakes through a combination of knowledge-based engineering
and problem-solving processes, such as Six Sigma’s define, measure, analyze,
improve and control (DMAIC).
Robustness is the ability of a system to function (that is, insensitive to the
user’s environment to avoid failure) under the full range of conditions that
may be experienced in the field.
System design faces two different challenges:
1. Developing a system that functions under tightly controlled conditions,
such as in a laboratory.
2. Making that system function reliably throughout its life cycle as it
experiences a broad set of real-world environmental and operating
conditions.
dfss
Readiness Plan
Transfer function-
based design to
improve product
reliability and
robustness
in design for
six sigma
By Matthew Hu,
Hewlett-Packard Co.
s i x s i g m a f o r u m m a g a z i n e I a u g u s t 2 0 1 3 I 9
3. Readiness Plan
10 I a u g u s t 2 0 1 3 I W W W . AS Q . ORG
An example of this real-world challenge is effective
system reliability engineering. The most cost effective
and least time consuming way to make a reliable prod-
uct—one that’s insensitive to the user environment, or
robust—is to start in the development or design phase
by discovering and preventing failure modes soon after
they are created, and implementing countermeasures
before production.
This article covers the second challenge—robust-
ness—by proactively factoring design for reliability
(DFR) efforts through transfer function-based robust-
ness improvement in the design for Six Sigma (DFSS)
approach. DFSS is a method that calls on many of the
fundamental design tools such as robust design. By
using DFSS along with a well-defined reliability plan,
you can know when to use which tool and how to
integrate each together to produce a reliable product
in the shortest amount of time.
A transfer function is a useful tool, if it’s validated
properly, that you can leverage to understand physics,
explore design space and optimize a design in terms of
reliability and robustness. Knowing the transfer func-
tion Y = f(X) between input and output, you’re able
to simulate the design performance with minimum
hardware requirements or without building prototypes
or building minimum prototypes. The variables in the
transfer function can be characterized from an engi-
neering viewpoint. Transfer functions then can enable
engineers to introduce variation into the models to
understand how the distribution of variation can alter
the desired performance by the following:
• Find the combination of control factors settings
that allow the system to achieve its ideal function.
• Remain insensitive to those variables that can-
not be controlled or that are not intended to be
controlled.
This approach allows engineers to predict what will
happen in actual applications. The essence of the
robust design approach is to design built-in quality.
Instead of trying to eliminate or reduce the causes
for product performance variability, it is preferable to
adjust the product design so product performance is
insensitive to the effects of uncontrolled (noise) varia-
tions through transfer function deployment.
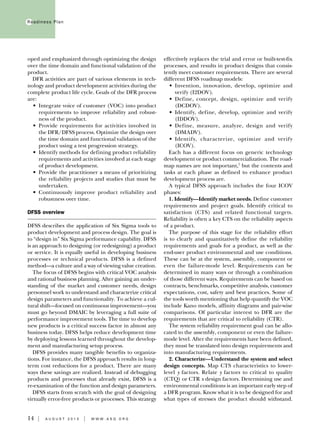
Transfer function overview
A transfer function is a relationship between input
(lower-level requirements) and output (higher-level
requirements). Transfer functions are set up as equa-
tions and are expressed in Y = f(X) terms. Transfer
functions are either developed analytically or experi-
mentally that directly measure the customer needs.
Y is the output response measurement such as prod-
uct strength or customer satisfaction. The transfer
function explains the transformation of the inputs
into the output. X is any input process step that is
involved in producing the output, and Y is the intend-
ed design functions cascaded from critical to satisfac-
tion (CTS) and others. The transfer function may be
mathematically derived (for example, spring force
and displacement [Y = kx]), and empirically (induc-
tive) obtained from a design of experiment (DoE) or
regression based on the historical data (for example,
Y = a0+a1x1+a2x22+… polynomial approximation).
In general, a transfer function is established through
an analytical or empirical approach. For a proper
transfer function development, a rational structure
of a design is needed to assess where to start the
transfer function development. The transfer function
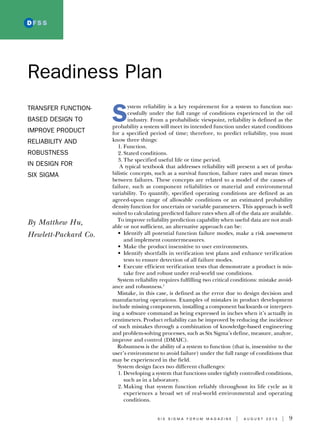
?
Select
measurable Y
Develop Y = f(X)
Assess Y = f(X)
Prediction
Are there any
previously known?
Can model
and pattern be
confirmed?
Yes
No
Induction
(from the specific to the general)
Deduction
(from the general to the specific)
Generated data
Design of experiment
Observed data
Regression
Logical foundations
• Physics equation
for example:
f = ma, y = f(x)
• Axioms
Engineering logic
CAE models
Finite elements
Function decomposition
Y=a0
+a1
x1
+a2
x2
2
+ ...
CAE = computer-aided engineering
No
Yes
Adapted from Matthew Hu and Kai Yang, “Transfer Function
Development in Design for Six Sigma Framework,” Society for
Automotive Engineering Journal, April 11, 2005.
Figure 1. Transfer function development
process flow
4. Readiness Plan
development process is similar to the inductive and
deductive feedback loop. The process of developing or
updating a transfer function is highly iterative, moving
frequently between the inductive and deductive paths.
Occasionally, the transfer function is known explicitly
and can be determined through the understanding of
the physics of the system. At other times, the transfer
function is unknown and must be estimated empiri-
cally through directed experiments or by the analysis
of already available data. Figure 1 shows how a transfer
function can be established.2
Deductive reasoning is the process by which an engi-
neer makes conclusions based on previously known
facts such as:
• Logical foundations—for example, physics
equations, the study of structure, change and
space patterns, and axioms.
• Engineering logic—for example, finite element
and mathematical modeling-proposed engi-
neering design.
This method of reasoning is a step-by-step process
of drawing conclusions based on previously known
truths from engineering validation. Although deduc-
tive reasoning seems rather simple, it can be mislead-
ing in more than one way. When deductive reasoning
leads to faulty conclusions, the reason is often that the
premises were incorrect; thus, the model validation is
important.
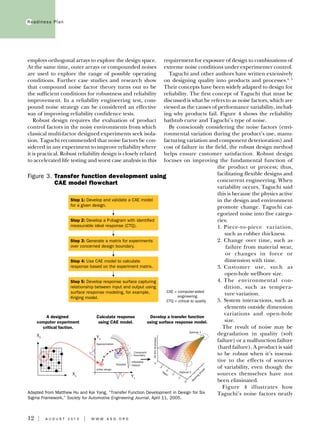
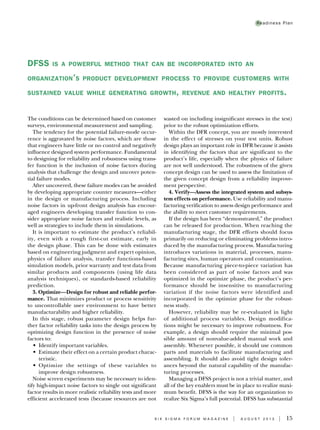
Transfer functions can be schematically represented
by the P-diagram used in robust engineering design,
as shown in Figure 2. A product can be divided into
functionally oriented operating systems. Function is
a key word and basic need for describing your prod-
uct or behavior. Regardless of what method is used
to facilitate a design, they all have to start with the
understanding of functions. Questions include: “What
is the definition of function?” and “How is the func-
tion defined in these disciplines of a specific design?”
Understanding the specific meanings of function (or
the definition of function) within each of these dis-
ciplines could help take the advantages of tools to
improve design efficiency and effectiveness.
Transfer functions can enable engineers and scien-
tists to introduce variation into the models to under-
stand how the distribution of variation can alter the
desired performance. A flowchart showing develop-
ment of a transfer function using the computer-aided
engineering (CAE) model is shown in Figure 3 (p. 12).
Inductive reasoning is the process of arriving at a
conclusion based on a set of observations (from the
specific to the general—for example, through DoE or
regression analysis). Inductive reasoning is valuable
because it allows engineers or scientists to form ideas
about groups of things in real life. In engineering,
inductive reasoning helps organize what is observed
into engineering hypotheses that can be proved using
more reliable methods. The process of inductive rea-
soning almost always is the way ideas are formed about
things. After those ideas form, it is possible to system-
atically determine (using formal validation) whether
the initial ideas were right, wrong or somewhere in
between.
Robust design overview
Robust design, also known as Taguchi parameter
design, can be used to achieve robust reliability; that
is, to make a product’s reliability insensitive to uncon-
trollable user environments. Robust design is the heart
of DFSS.
An important development in reliability engineering
is robust design pioneered by Genichi Taguchi.3
For
any design concept, there is a potentially large space
of control factor settings that will nominally place the
function at the desired target value. Taguchi’s method
s i x s i g m a f o r u m m a g a z i n e I a u g u s t 2 0 1 3 I 11
Figure 2. P-diagram
Output response
Y=f(XIS
, XCF
, XNF
)
= ß M+[f(M, XCF
, XNF
) – ßM]
= ß M ideal functional
relationship
Control factors (XCF
)
Noise factors (XNF
)
Input signal
M
Error states
Y
M
ß
Ideal function
Y=ß M
P-diagram
Adapted from Matthew Hu and Kai Yang, “Transfer Function
Development in Design for Six Sigma Framework,” Society for
Automotive Engineering Journal, April 11, 2005.
5. 12 I a u g u s t 2 0 1 3 I W W W . AS Q . ORG
Readiness Plan
employs orthogonal arrays to explore the design space.
At the same time, outer arrays or compounded noises
are used to explore the range of possible operating
conditions. Further case studies and research show
that compound noise factor theory turns out to be
the sufficient conditions for robustness and reliability
improvement. In a reliability engineering test, com-
pound noise strategy can be considered an effective
way of improving reliability confidence tests.
Robust design requires the evaluation of product
control factors in the noisy environments from which
classical multi-factor designed experiments seek isola-
tion. Taguchi recommended that noise factors be con-
sidered in any experiment to improve reliability where
it is practical. Robust reliability design is closely related
to accelerated life testing and worst case analysis in this
requirement for exposure of design to combinations of
extreme noise conditions under experimenter control.
Taguchi and other authors have written extensively
on designing quality into products and processes.4, 5
Their concepts have been widely adapted to design for
reliability. The first concept of Taguchi that must be
discussed is what he refers to as noise factors, which are
viewed as the causes of performance variability, includ-
ing why products fail. Figure 4 shows the reliability
bathtub curve and Taguchi’s type of noise.
By consciously considering the noise factors (envi-
ronmental variation during the product’s use, manu-
facturing variation and component deterioration) and
cost of failure in the field, the robust design method
helps ensure customer satisfaction. Robust design
focuses on improving the fundamental function of
the product or process; thus,
facilitating flexible designs and
concurrent engineering. When
variability occurs, Taguchi said
this is because the physics active
in the design and environment
promote change. Taguchi cat-
egorized noise into five catego-
ries:
1. Piece-to-piece variation,
such as rubber thickness.
2. Change over time, such as
failure from material wear,
or changes in force or
dimension with time.
3. Customer use, such as
open-hole wellbore size.
4. The environmental con-
dition, such as tempera-
ture variation.
5. System interactions, such as
elements outside dimension
variations and open-hole
size.
The result of noise may be
degradation in quality (soft
failure) or a malfunction failure
(hard failure). A product is said
to be robust when it’s insensi-
tive to the effects of sources
of variability, even though the
sources themselves have not
been eliminated.
Figure 4 illustrates how
Taguchi’s noise factors neatly
Figure 3. Transfer function development using
CAE model flowchart
Step 1: Develop and validate a CAE model
for a given design.
Step 2: Develop a P-diagram with identified
measurable ideal response (CTQ).
Step 3: Generate a matrix for experiments
over concerned design boundary.
Step 4: Use CAE model to calculate
response based on the experiment matrix.
Step 5: Develop response surface capturing
relationship between input and output using
surface response modeling, for example,
Kriging model.
A designed
computer experiment
critical faction.
Calculate response
using CAE model.
Develop a transfer function
using surface response model.
X2 Y2
X1 Y1
CAE = computer-aided
engineering
CTQ = critical to quality
Initial design
Approximation
Feasible
Infeasible
(failed)
Constraint
boundary
Oilfilmthickness
Taper
4
3
2
2
1
0
Bearing
phase
Optimal 2
Optimal 1
Adapted from Matthew Hu and Kai Yang, “Transfer Function Development in Design for Six
Sigma Framework,” Society for Automotive Engineering Journal, April 11, 2005.
6. fit within the accepted model of product failures in
reliability and their relation to the bathtub curve.
Robustness and reliability improvement
Categorically, there are five strategies for improving
robustness and thus reliability:
1. Change the design concept or technology.
2. Make the design insensitive to noise factors.
3. Reduce or remove the noise factors.
4. Use a compensation device (for example,
dynamically tuned absorbers).
5. Send the failure mode to another part of the
system (trade-off) where it will do less harm.
As noted earlier, the second strategy for making the
design insensitive to noise factors is the focus of this
article.
M.S. Phadke stated that there are three fundamental
ways to improve the reliability of a product during the
design stage:6
1. Reduce the sensitivity of the product’s function
to the variation in the product parameters.
2. Reduce the rate of change of the product
parameters.
3. Include redundancy.
The most cost-effective approach for reliability
improvement is to find appropriate continuous quality
characteristics and reduce their sensitivity to all noise
factors. Phadke provides simple examples of a robust
design approach. In actual application, however, more
than one strategy may be necessary.
DFR overview
DFR is a process. Specifically, DFR describes the
entire set of tools that support product and process
design (typically from early in the concept stage all
the way through to product obsolescence) to ensure
that customer expectations for reliability are fully met
throughout the life of the product with low overall
life cycle costs. In other words, DFR is a systematic,
streamlined, concurrent engineering program in
which reliability engineering is woven into the total
development cycle.
The purpose of the DFR process is to provide
requirements for DFR activities, which are intended
to be an integral part of every product development
effort to continuously improve product reliability and
robustness. The reliability process integrates with a
generic technology and product development process,
and can be tailored as specified in the technology and
product development process. The product develop-
ment process defines the scope and applicability. The
reliability plan documents the tailoring of the DFR
activities.
The reliability plan is created by the design team.
It is the responsibility of the design team to imple-
ment the DFR by completing the activities outlined in
this plan. The team must leverage a set of reliability
engineering tools along with a proper understanding
of when and how to use these tools throughout the
design cycle. This process encompasses a variety of
tools and practices, and describes the overall order of
deployment that an organization must follow to design
reliability into its products. The reliability is part of the
DFSS scorecard. DFR tasks can be well aligned with
and embedded in a DFSS roadmap.
To make reliability a key product requirement and
understand where reliability efforts stand in terms of
the DFR process for designing and manufacturing for
reliability, a DFR assessment scorecard can be help-
ful. The DFR assessment drives reliability goal setting,
understanding the quality history, tool selection activi-
ties, testing strategies and reliability demonstration
through DFR gates review.
The DFR process can follow the DFSS roadmap—for
example, the identify, design, optimize and validate
(IDOV) framework. With reliability in mind, prod-
uct program teams can identify the boundary and
scope of system requirements and design the product.
Meaningful test progression strategies can be devel-
Readiness Plan
s i x s i g m a f o r u m m a g a z i n e I a u g u s t 2 0 1 3 I 13
Figure 4. Reliability bathtub curve and
types of noise mapping
Failure rate
Stress
Strength
Time
Affected by
outer noises
Affected by
inner noises
Failures occur
in overlap
DFR
IFR
CFR
a. Infant
mortality
noise #1
c. Wear
out
noise #2
b. Useful life
noise #3/4/5
Affected by customer use variation
Affected by manufacturing variation
CFR = constant failure rate
DFR = decreased failure rate
IFR = increased failure rate
7. 14 I a u g u s t 2 0 1 3 I W W W . AS Q . ORG
Readiness Plan
oped and emphasized through optimizing the design
over the time domain and functional validation of the
product.
DFR activities are part of various elements in tech-
nology and product development activities during the
complete product life cycle. Goals of the DFR process
are:
• Integrate voice of customer (VOC) into product
requirements to improve reliability and robust-
ness of the product.
• Provide requirements for activities involved in
the DFR/DFSS process. Optimize the design over
the time domain and functional validation of the
product using a test progression strategy.
• Identify methods for defining product reliability
requirements and activities involved at each stage
of product development.
• Provide the practitioner a means of prioritizing
the reliability projects and studies that must be
undertaken.
• Continuously improve product reliability and
robustness over time.
DFSS overview
DFSS describes the application of Six Sigma tools to
product development and process design. The goal is
to “design in” Six Sigma performance capability. DFSS
is an approach to designing (or redesigning) a product
or service. It is equally useful in developing business
processes or technical products. DFSS is a defined
method—a culture and a way of viewing value creation.
The focus of DFSS begins with critical VOC analysis
and rational business planning. After gaining an under-
standing of the market and customer needs, design
personnel work to understand and characterize critical
design parameters and functionality. To achieve a cul-
tural shift—focused on continuous improvement—you
must go beyond DMAIC by leveraging a full suite of
performance improvement tools. The time to develop
new products is a critical success factor in almost any
business today. DFSS helps reduce development time
by deploying lessons learned throughout the develop-
ment and manufacturing setup process.
DFSS provides many tangible benefits to organiza-
tions. For instance, the DFSS approach results in long-
term cost reductions for a product. There are many
ways these savings are realized. Instead of debugging
products and processes that already exist, DFSS is a
re-examination of the function and design parameters.
DFSS starts from scratch with the goal of designing
virtually error-free products or processes. This strategy
effectively replaces the trial and error or built-test-fix
processes, and results in product designs that consis-
tently meet customer requirements. There are several
different DFSS roadmap models:
• Invention, innovation, develop, optimize and
verify (I2DOV).
• Define, concept, design, optimize and verify
(DCDOV).
• Identify, define, develop, optimize and verify
(IDDOV).
• Define, measure, analyze, design and verify
(DMADV).
• Identify, characterize, optimize and verify
(ICOV).
Each has a different focus on generic technology
development or product commercialization. The road-
map names are not important,7
but the contents and
tasks at each phase as defined to enhance product
development process are.
A typical DFSS approach includes the four ICOV
phases:
1. Identify—Identify market needs. Define customer
requirements and project goals. Identify critical to
satisfaction (CTS) and related functional targets.
Reliability is often a key CTS on the reliability aspects
of a product.
The purpose of this stage for the reliability effort
is to clearly and quantitatively define the reliability
requirements and goals for a product, as well as the
end-user product environmental and use conditions.
These can be at the system, assembly, component or
even the failure-mode level. Requirements can be
determined in many ways or through a combination
of those different ways. Requirements can be based on
contracts, benchmarks, competitive analysis, customer
expectations, cost, safety and best practices. Some of
the tools worth mentioning that help quantify the VOC
include Kano models, affinity diagrams and pair-wise
comparisons. Of particular interest to DFR are the
requirements that are critical to reliability (CTR).
The system reliability requirement goal can be allo-
cated to the assembly, component or even the failure-
mode level. After the requirements have been defined,
they must be translated into design requirements and
into manufacturing requirements.
2. Characterize—Understand the system and select
design concepts. Map CTS characteristics to lower-
level y factors. Relate y factors to critical to quality
(CTQ) or CTR x design factors. Determining use and
environmental conditions is an important early step of
a DFR program. Know what it is to be designed for and
what types of stresses the product should withstand.
8. The conditions can be determined based on customer
surveys, environmental measurement and sampling.
The tendency for the potential failure-mode occur-
rence is aggravated by noise factors, which are those
that engineers have little or no control and negatively
influence designed system performance. Fundamental
to designing for reliability and robustness using trans-
fer function is the inclusion of noise factors during
analysis that challenge the design and uncover poten-
tial failure modes.
After uncovered, these failure modes can be avoided
by developing appropriate counter measures—either
in the design or manufacturing process. Including
noise factors in up-front design analysis has encour-
aged engineers developing transfer function to con-
sider appropriate noise factors and realistic levels, as
well as strategies to include them in simulations.
It is important to estimate the product’s reliabil-
ity, even with a rough first-cut estimate, early in
the design phase. This can be done with estimates
based on engineering judgment and expert opinion,
physics of failure analysis, transfer functions-based
simulation models, prior warranty and test data from
similar products and components (using life data
analysis techniques), or standards-based reliability
prediction.
3. Optimize—Design for robust and reliable perfor-
mance. That minimizes product or process sensitivity
to uncontrollable user environment to have better
manufacturability and higher reliability.
In this stage, robust parameter design helps fur-
ther factor reliability tasks into the design process by
optimizing design function in the presence of noise
factors to:
• Identify important variables.
• Estimate their effect on a certain product charac-
teristic.
• Optimize the settings of these variables to
improve design robustness.
Noise screen experiments may be necessary to iden-
tify high-impact noise factors to single out significant
factor results in more realistic reliability tests and more
efficient accelerated tests (because resources are not
wasted on including insignificant stresses in the test)
prior to the robust optimization efforts.
Within the DFR concept, you are mostly interested
in the effect of stresses on your test units. Robust
design plays an important role in DFR because it assists
in identifying the factors that are significant to the
product’s life, especially when the physics of failure
are not well understood. The robustness of the given
concept design can be used to assess the limitation of
the given concept design from a reliability improve-
ment perspective.
4. Verify—Assess the integrated system and subsys-
tem effects on performance. Use reliability and manu-
facturing verification to assess design performance and
the ability to meet customer requirements.
If the design has been “demonstrated,” the product
can be released for production. When reaching the
manufacturing stage, the DFR efforts should focus
primarily on reducing or eliminating problems intro-
duced by the manufacturing process. Manufacturing
introduces variations in material, processes, manu-
facturing sites, human operators and contamination.
Because manufacturing piece-to-piece variation has
been considered as part of noise factors and was
optimized in the optimize phase, the product’s per-
formance should be insensitive to manufacturing
variation if the noise factors were identified and
incorporated in the optimize phase for the robust-
ness study.
However, reliability may be re-evaluated in light
of additional process variables. Design modifica-
tions might be necessary to improve robustness. For
example, a design should require the minimal pos-
sible amount of nonvalue-added manual work and
assembly. Whenever possible, it should use common
parts and materials to facilitate manufacturing and
assembling. It should also avoid tight design toler-
ances beyond the natural capability of the manufac-
turing processes.
Managing a DFSS project is not a trivial matter, and
all of the key enablers must be in place to realize maxi-
mum benefit. DFSS is the way for an organization to
realize Six Sigma’s full potential. DFSS has substantial
Readiness Plan
s i x s i g m a f o r u m m a g a z i n e I a u g u s t 2 0 1 3 I 15
DFSS is a powerful method that can be incorporated into an
organization’s product development process to provide customers with
sustained value while generating growth, revenue and healthy profits.
9. 16 I a u g u s t 2 0 1 3 I W W W . AS Q . ORG
Readiness Plan
effects on long-term profitability through improved
products and efficiencies. It results in increased
customer satisfaction, improved market share and
increased profit potential.
As you already have seen, reliability is a function of
time and, therefore, depends on age. This implies that
the useful life of a particular item may be defined. It
turns out this concept is useful in Six Sigma because—
by definition—DFSS is interested in designing a prod-
uct to a specified life. The assessment of reliability
usually involves testing and analysis of stress, strength
and environmental factors, and should always include
improper use by the end user. A reliable design should
anticipate all that can go wrong. DFR can be viewed as
a means to maintain and sustain Six Sigma capabilities
over time and is one tool set in the DFSS method.
Using a structured process to gain insight to the
customer’s needs and translate them to tangibles, CTQ
product specifications significantly reduces cycle time
and ensures a higher probability of success. Using
metrics, data and a rigorous approach, you can gain
fundamental knowledge about the critical parameters
of the product. This shared knowledge is instrumental
in producing and selling high quality, consistent, cost
competitive and profitable products.
DFSS is a powerful method that can be incorporated
into an organization’s existing product development
process to provide its customers with sustained value
while generating growth, revenue and healthy profits
for itself.
Reliability and DFSS
Reliability is one of the most important characteristics
of an engineering system. Reliability can be measured
as robustness over time. A reliable product is insensi-
tive to noise (uncontrollable user conditions) over
time. Insufficient data or lack of useful reliability field
data presents challenges of conducting meaningful
reliability analysis, prediction and, therefore, proper
decision making.
Analytical reliability and robustness using transfer
functions enable engineers to introduce variation (for
example, manufacturing piece-to-piece variation and
aging) into the analytical models to understand how
the distribution of variation can alter the desired per-
formance. Reliability and robustness can be analyzed
and optimized through transfer functions. Potential
failure modes may be uncovered and discovered
through a properly developed transfer function. Noise
factors can be identified and included in transfer
functions to uncover potential failure modes for reli-
ability improvements in the up-front design phase.
The design of swell packers for use in the energy
industry is a perfect example of being challenged for
proper reliability prediction when useful data are not
available.
Product development has a huge impact on rev-
enue stream and reliability. Enhancing product devel-
opment process with DFSS disciplines will improve
the product delivery process to develop a customized
DFR process with required tools to support specific
reliability tasks. It’s more cost effective and less time
consuming to make design insensitive to uncontrol-
lable user environments using transfer function.
DFR tasks can be best accomplished through a DFSS
roadmap.
EDITOR’S NOTE
Six Sigma Forum Magazine will publish the second installment of Hu’s article
in the November 2013 edition. That article will present a case study of swell
packer reliability improvement using transfer function.
REFERENCES
1. Don Clausing and Daniel D. Frey, Improving System Reliability by Failure-
Mode Avoidance Including Four Concept Design Strategies, Wiley InterScience,
2006.
2. Matthew Hu and Kai Yang, “Transfer Function Development in Design
for Six Sigma Framework,” Society for Automotive Engineering Journal, April
11, 2005.
3. Genichi Taguchi and Yoshiko Yokoyama, Taguchi Methods: Design of Experi-
ments, American Supplier Institute, 1993.
4. Madhav S. Phadke, Quality Engineering Using Robust Design, Prentice-Hall,
1989.
5. Genichi Taguchi, Subir Chowdhury and Yuin Wu, Taguchi Quality Engineer-
ing Handbook, Wiley, 2004.
6. Phadke, Quality Engineering Using Robust Design, see reference 4.
7. Hu and Yang, “Transfer Function Development in Design for Six Sigma
Framework,” see reference 2.
BIBLIOGRAPHY
Box, George E.P., “Scientific Methods: The Generation of Knowledge and
Quality,” Quality Progress, January 1997, pp. 47-50.
Cabadas, Joseph, “Robust Engineering Eliminates Unnecessary Expenses at
Ford,” U.S. Auto Scene, April 12, 1999.
Davis, Tim, “Measuring Robustness as a Parameter in a Transfer Function,”
Society of Automotive Engineers (SAE) International technical paper,
presented at SAE World Congress and Exhibition, March 8, 2004.
Hu, Matthew, John M. Pieprzak and John Glowa, “Essentials of Design
Robustness in Design for Six Sigma (DFSS) Methodology,” SAE Interna-
tional technical paper, presented at SAE World Congress and Exhibition,
March 8, 2004.