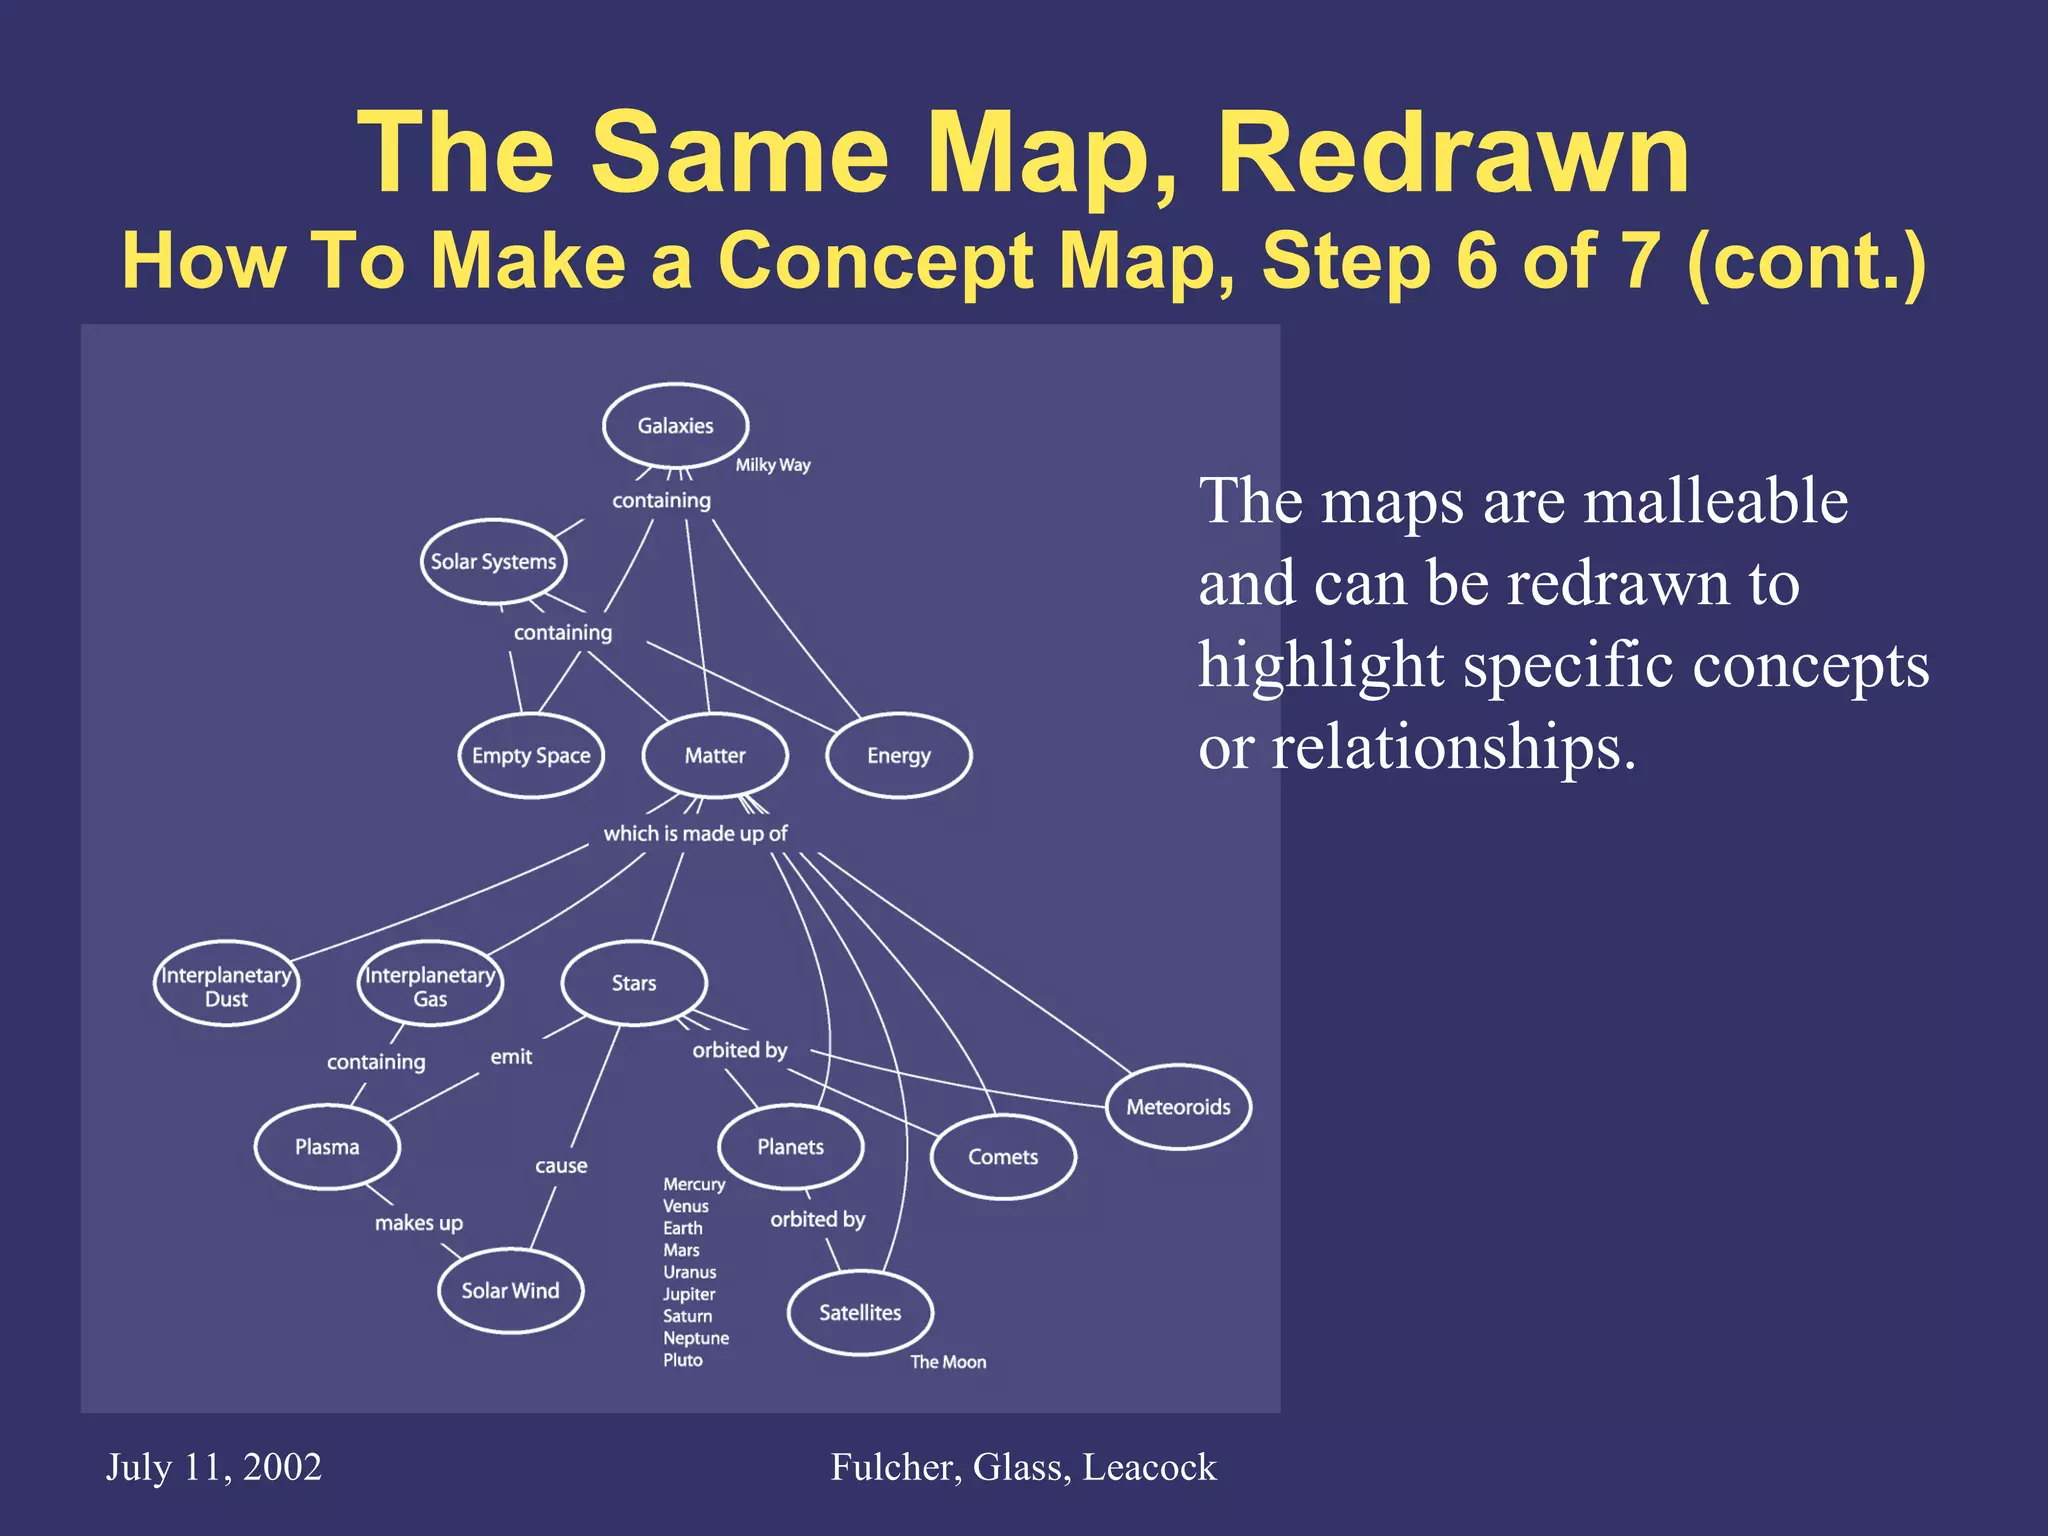
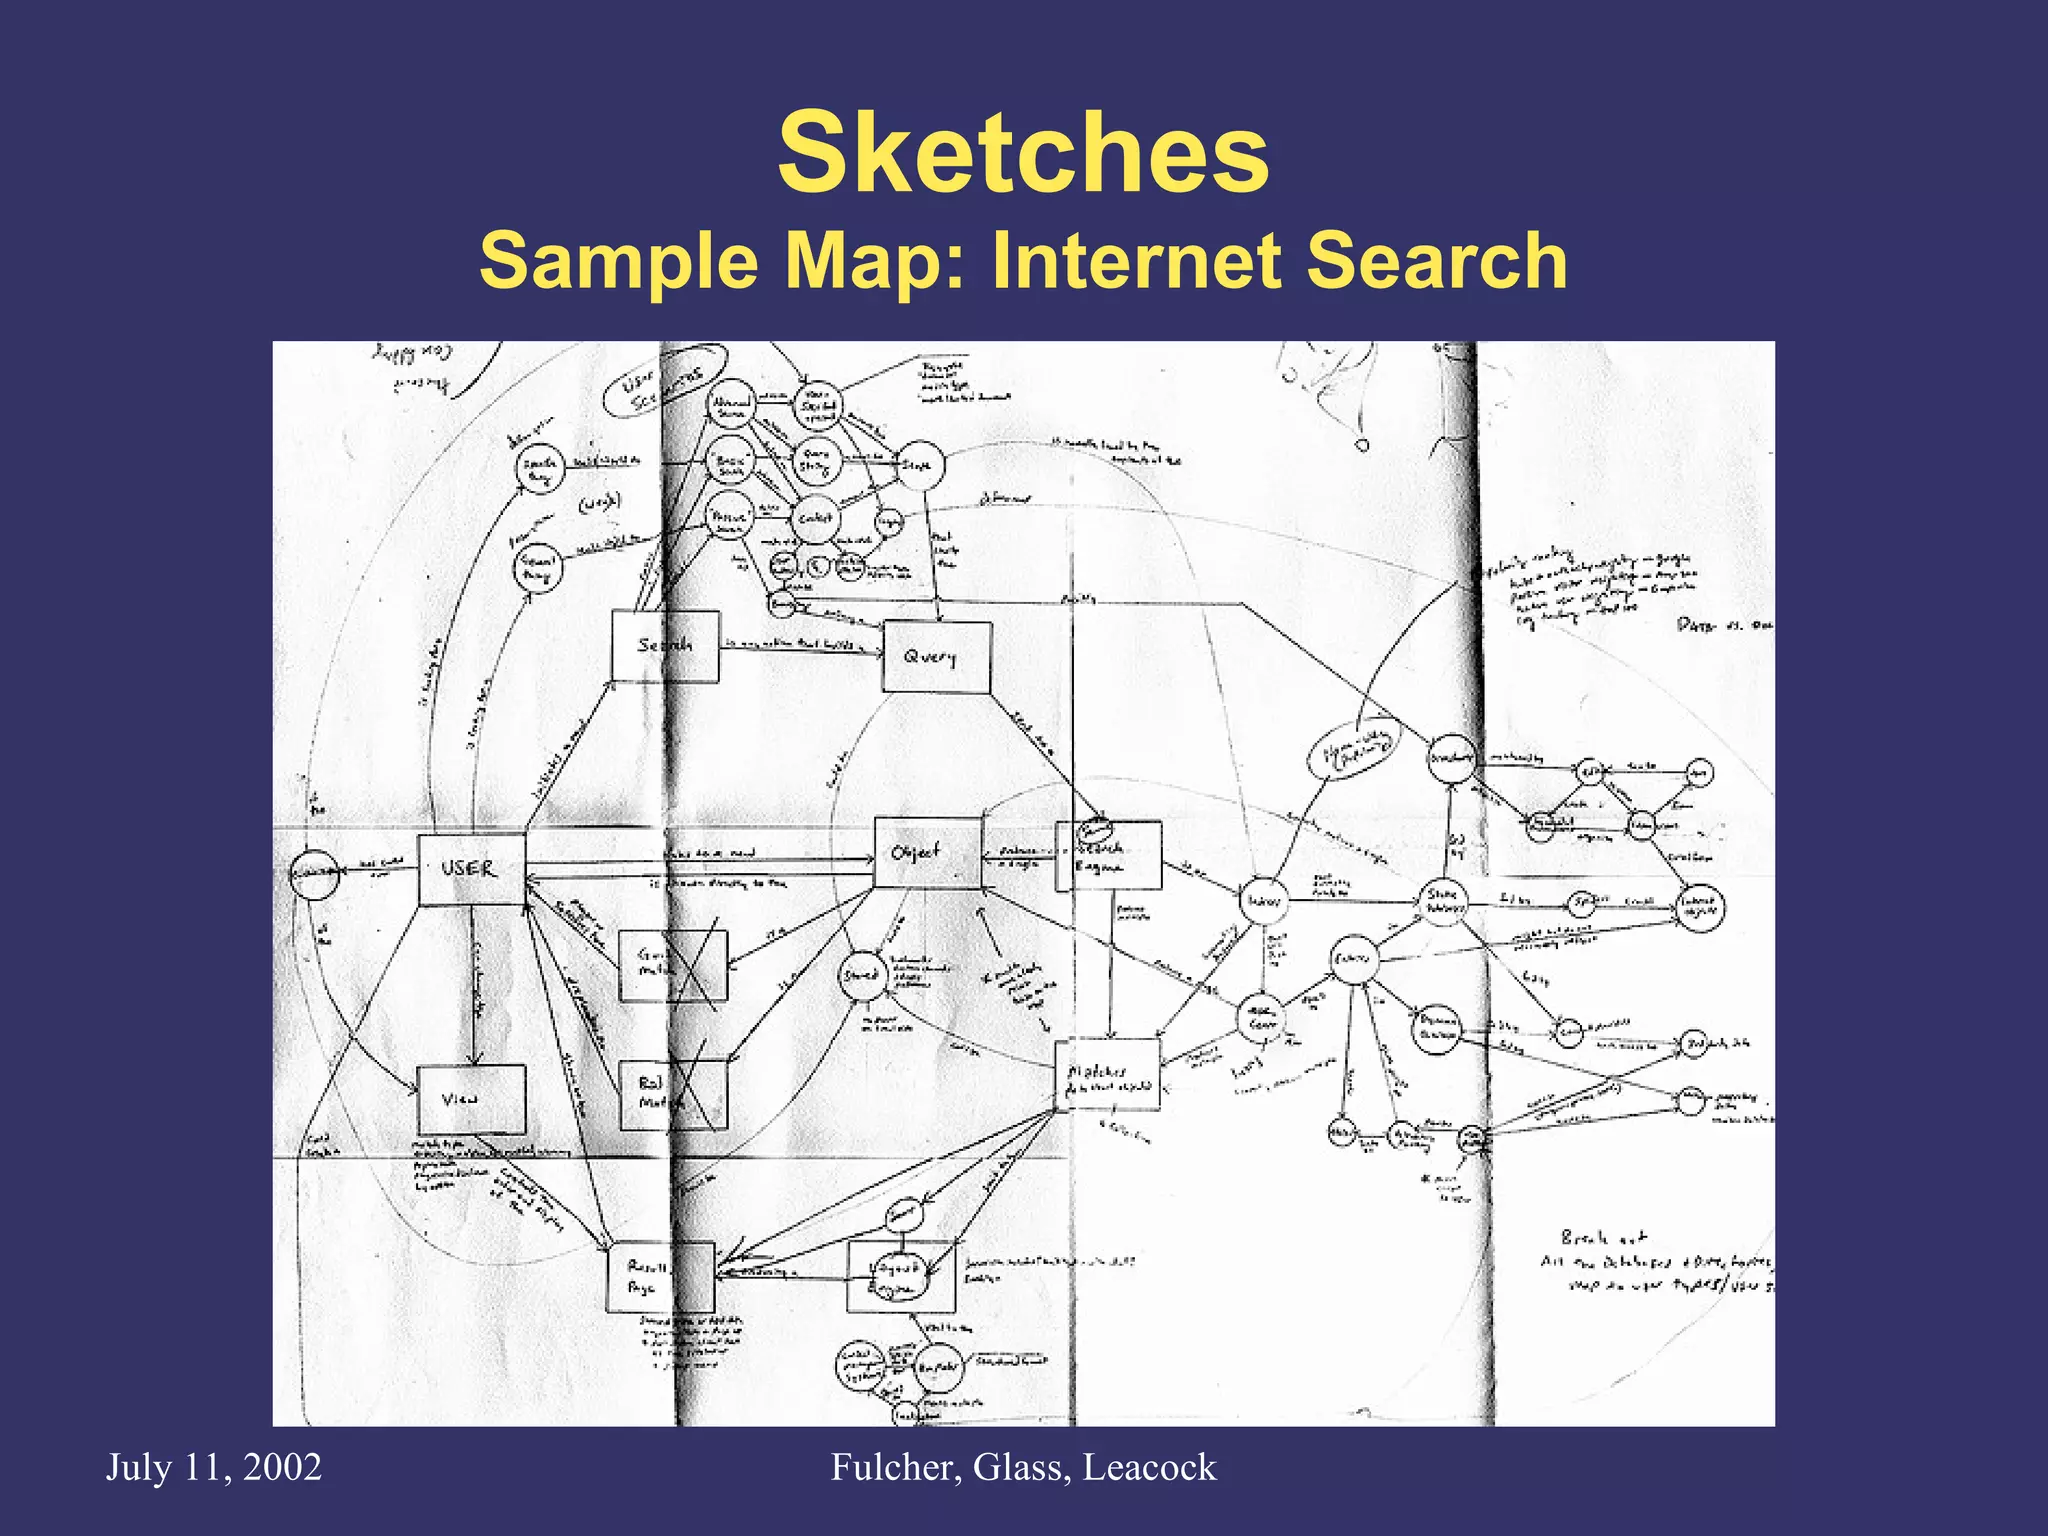
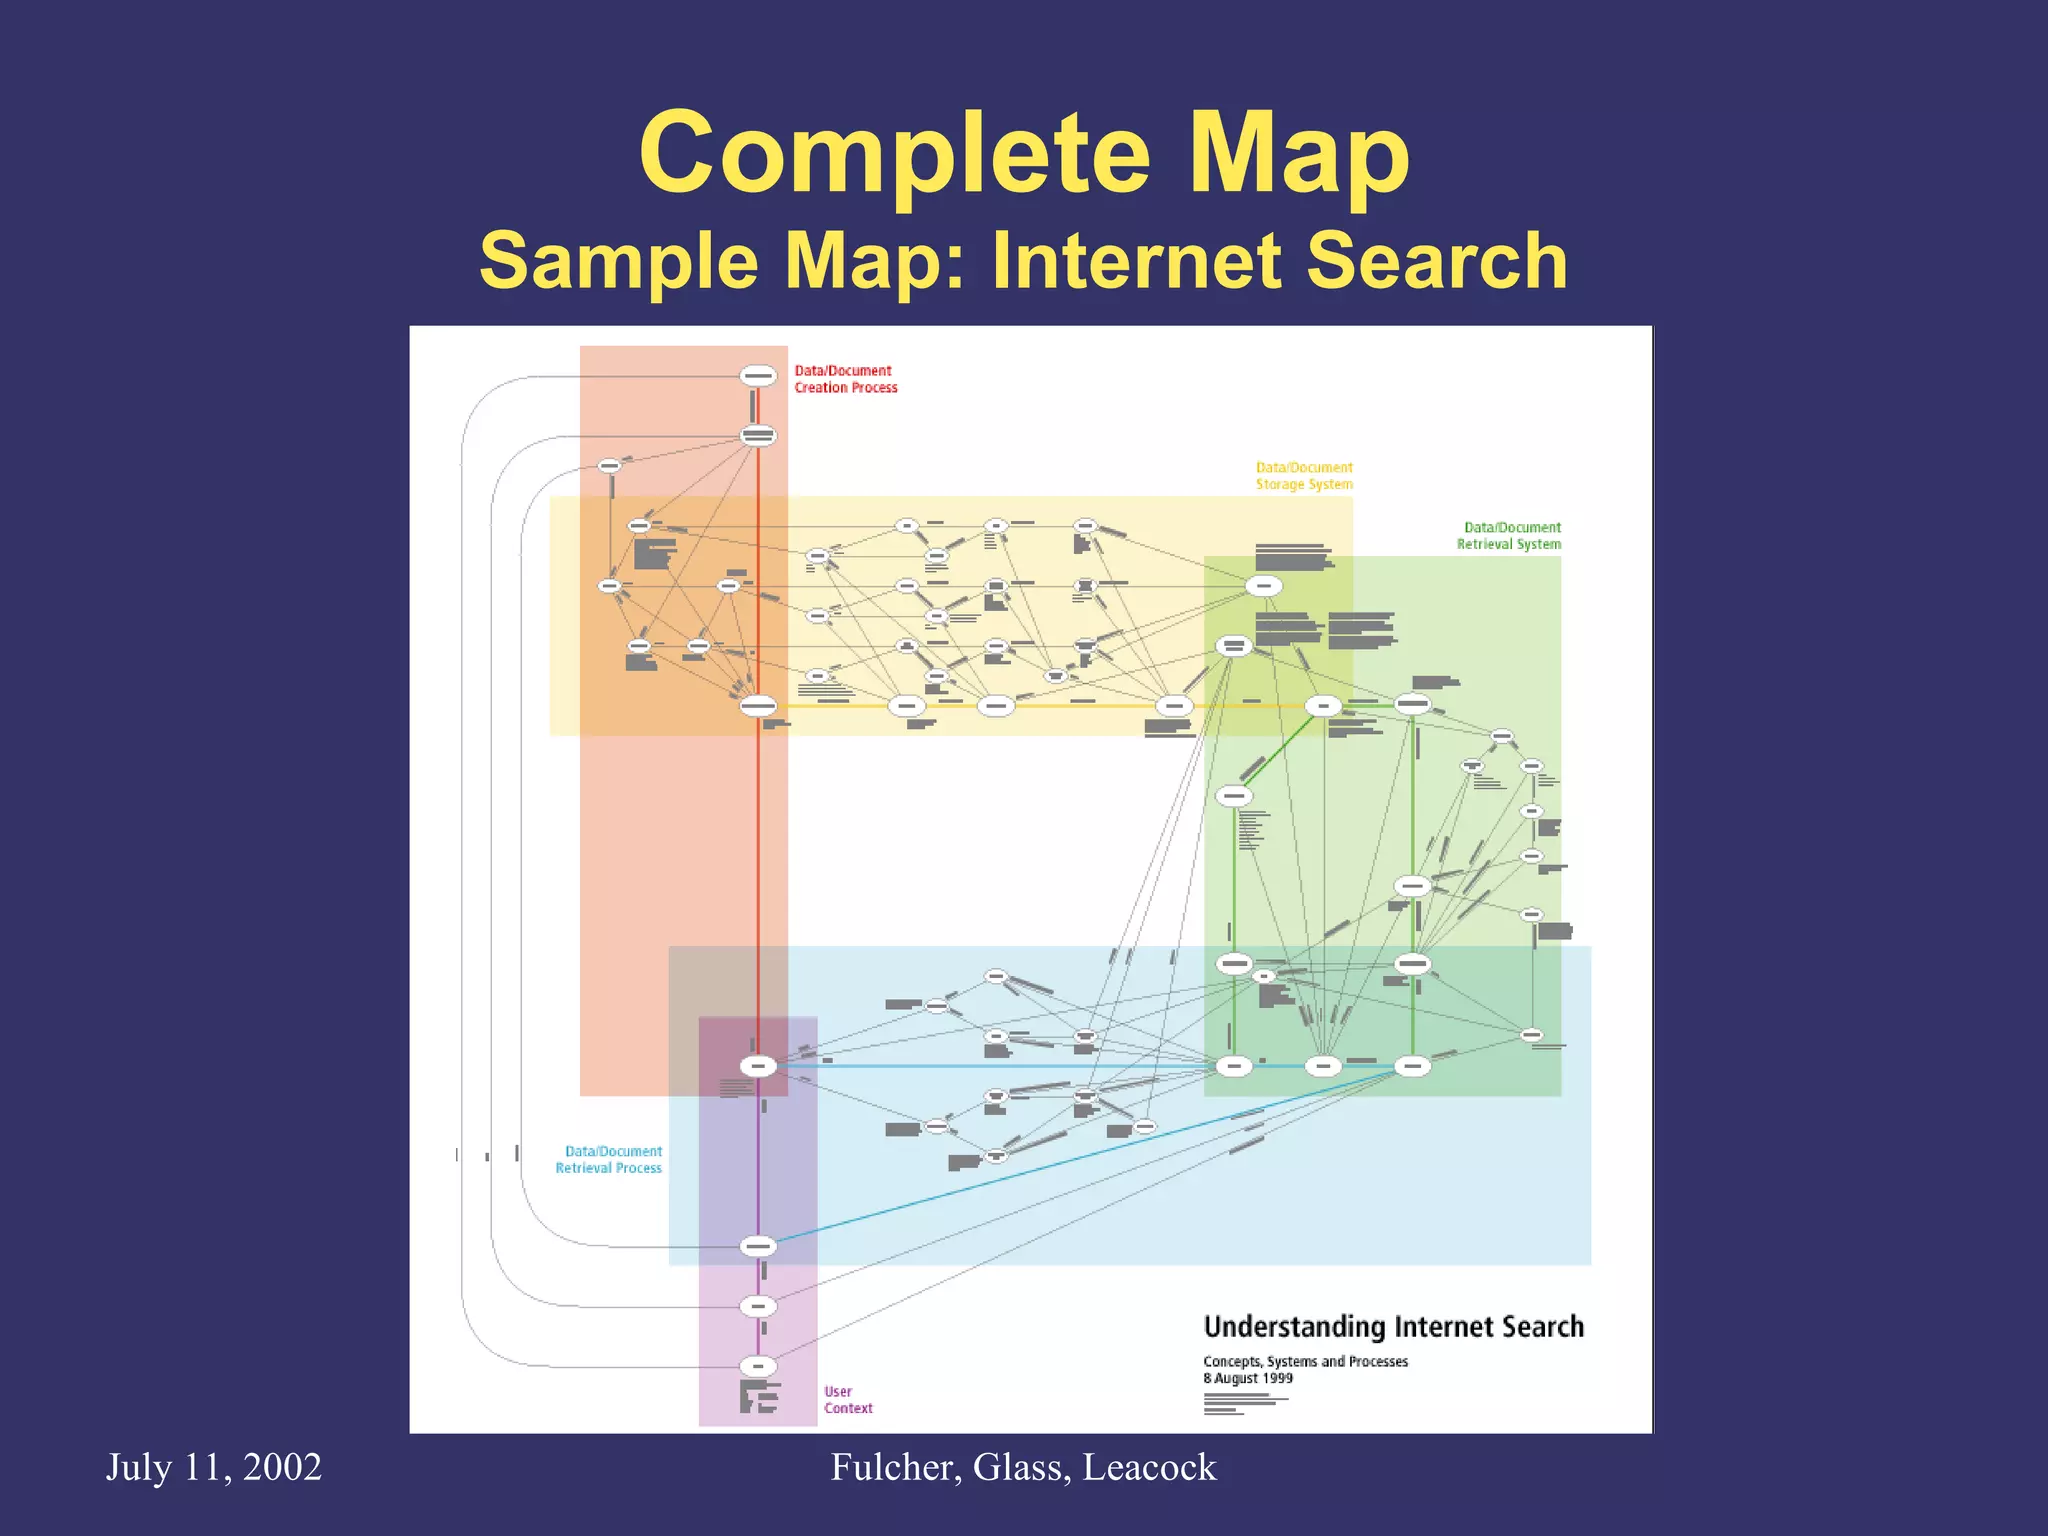
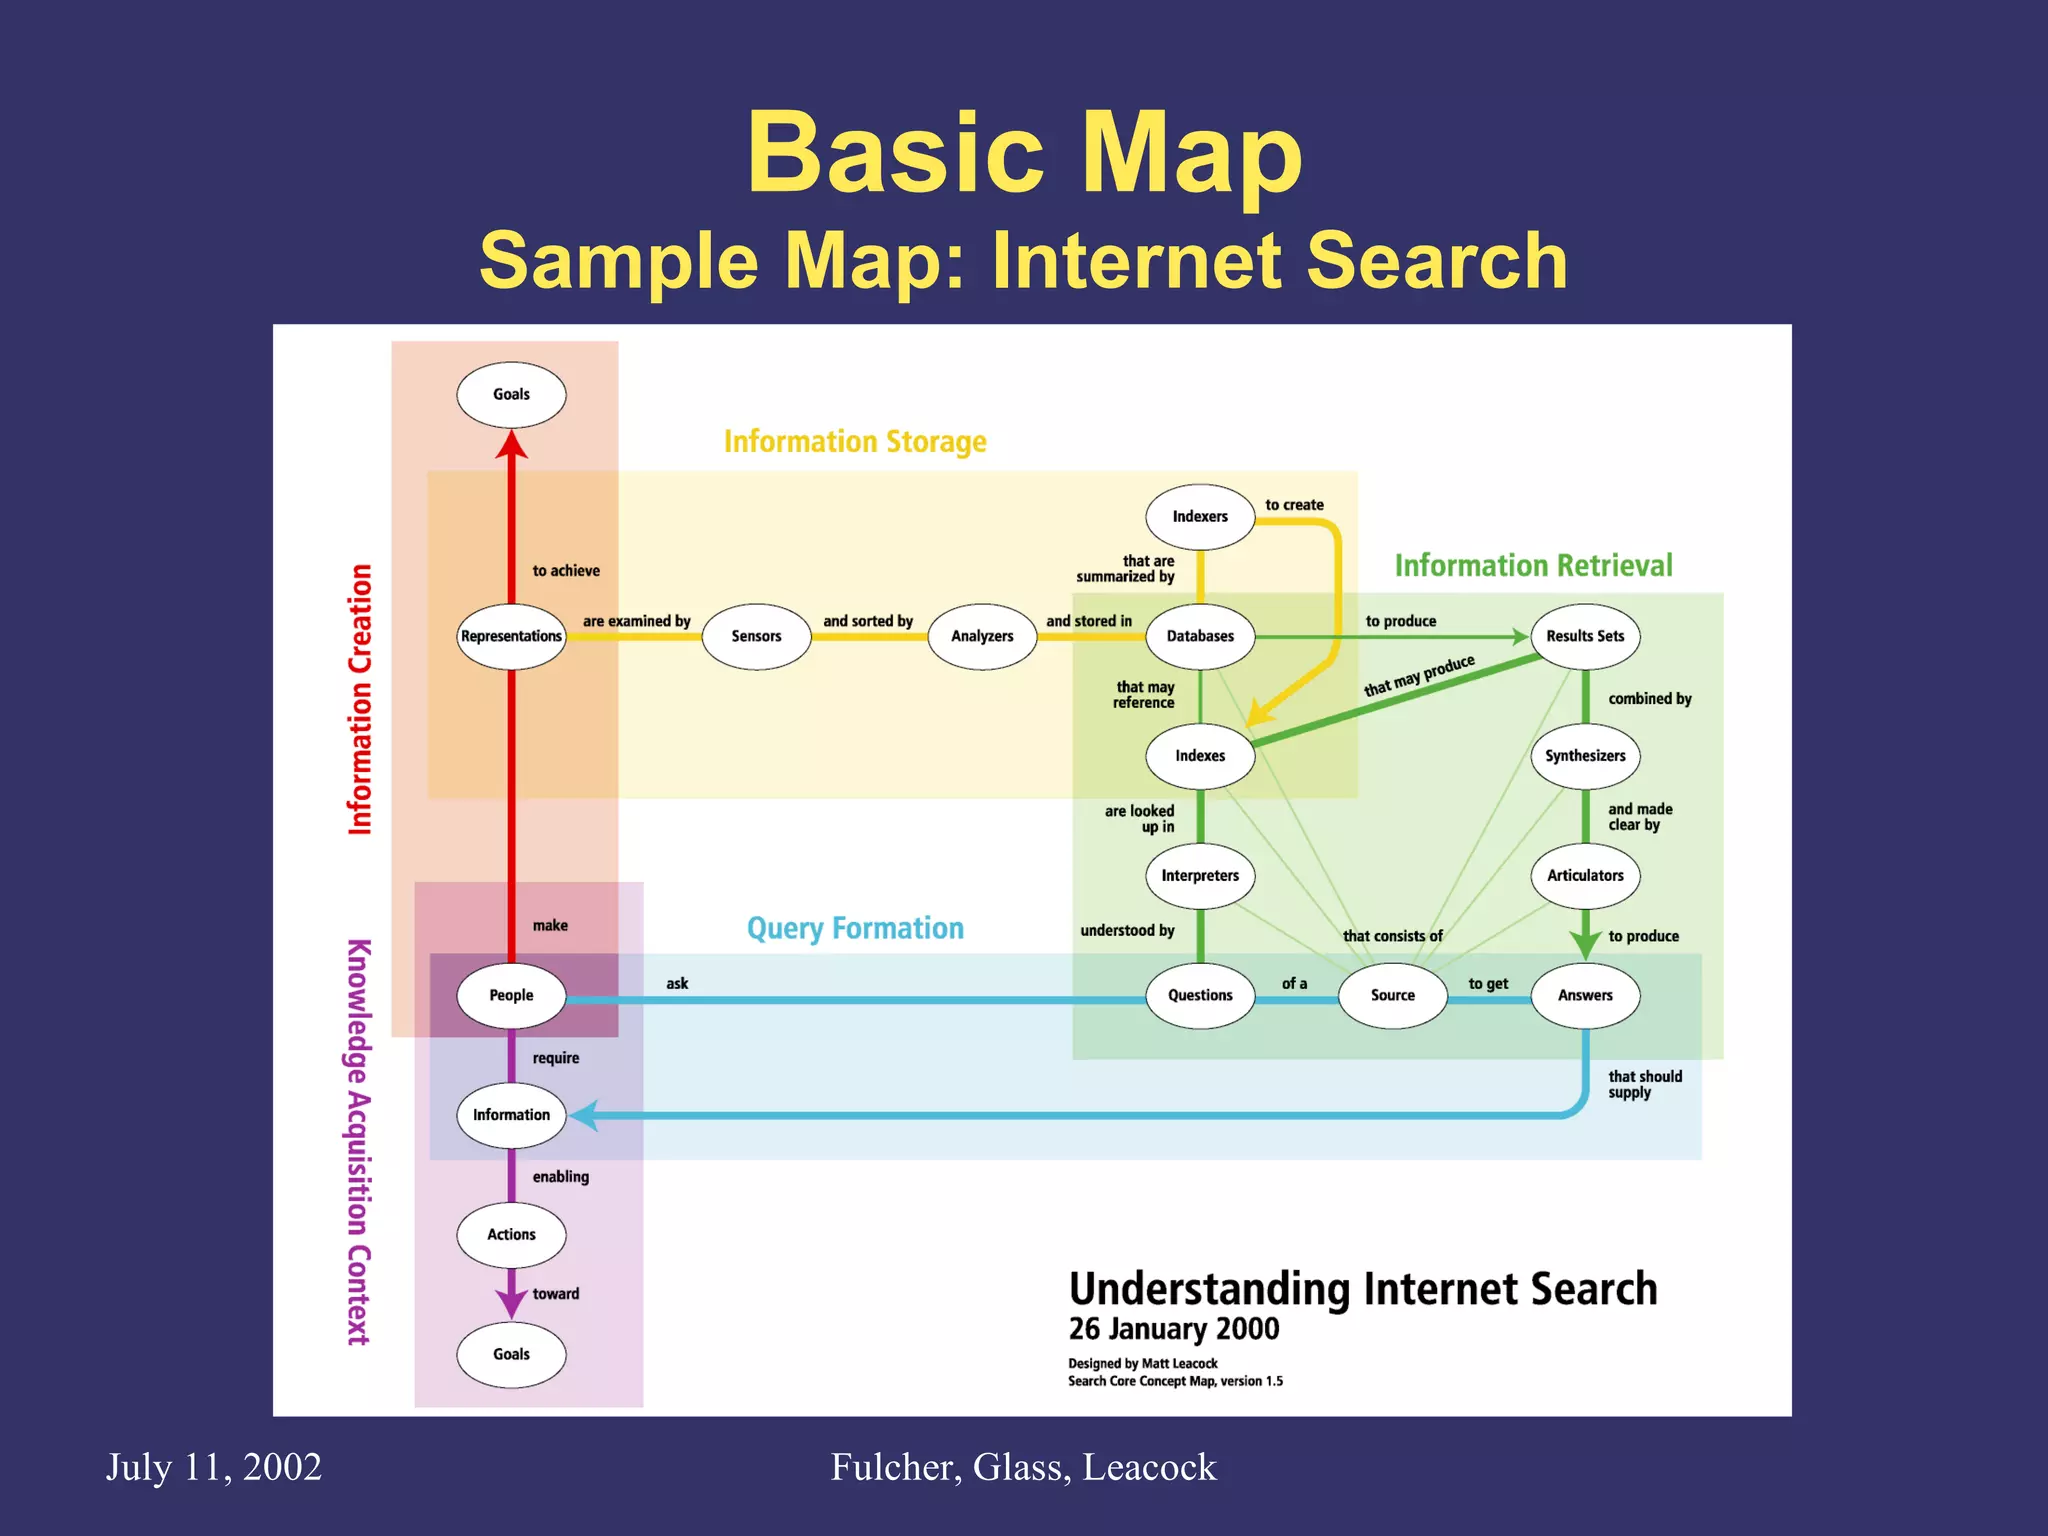
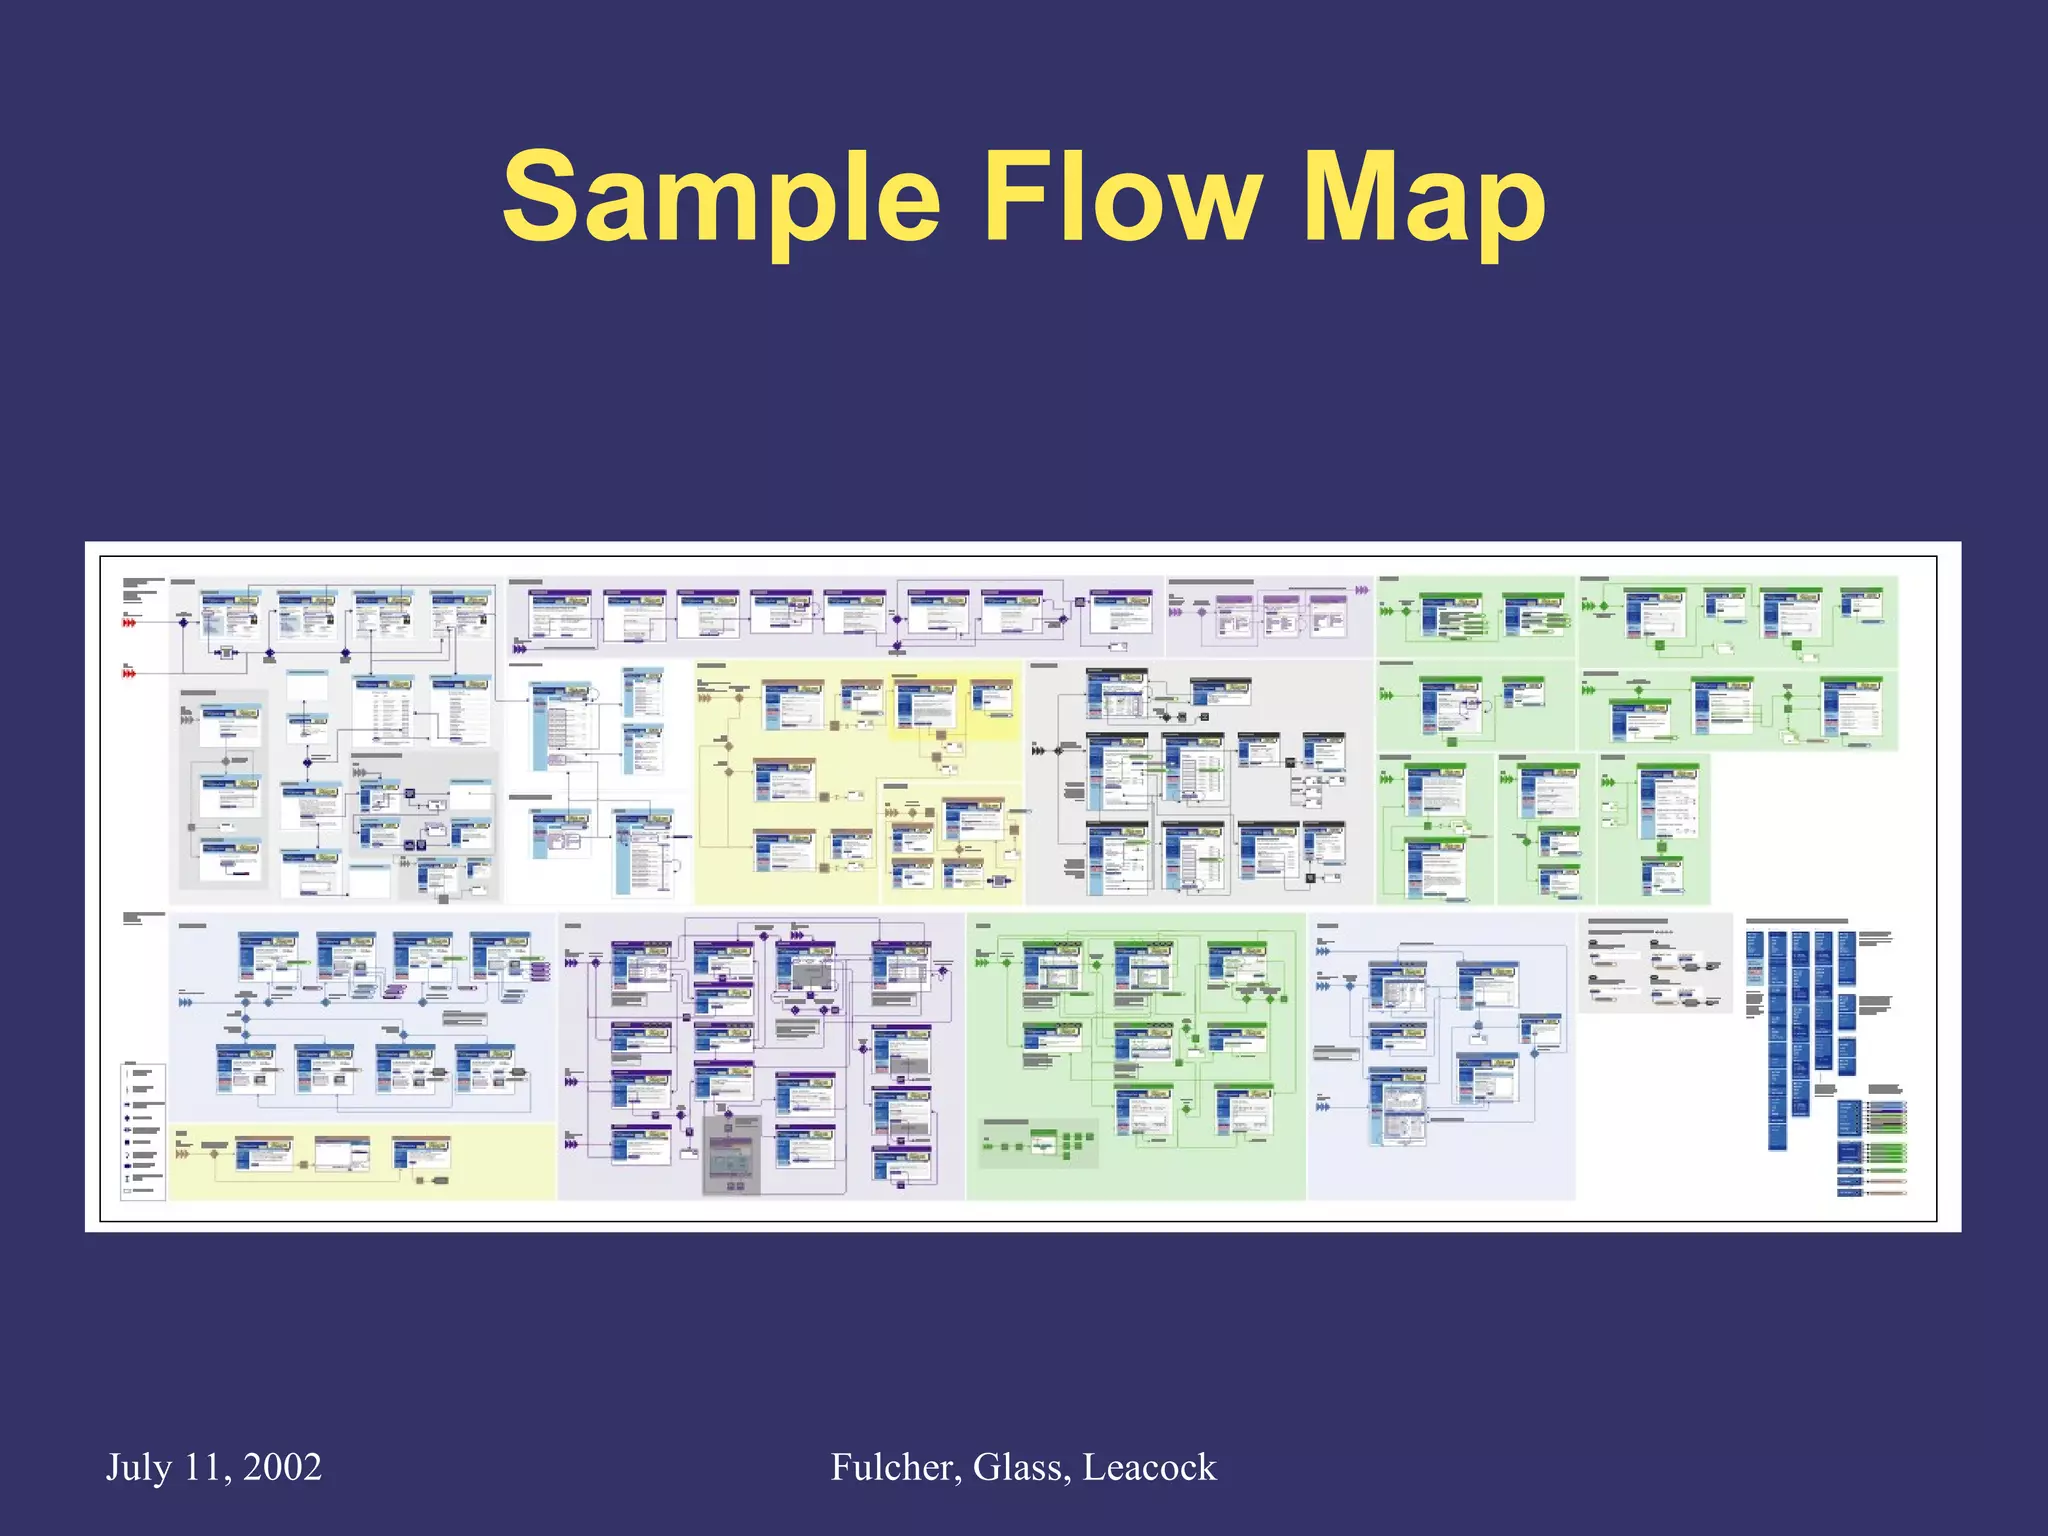
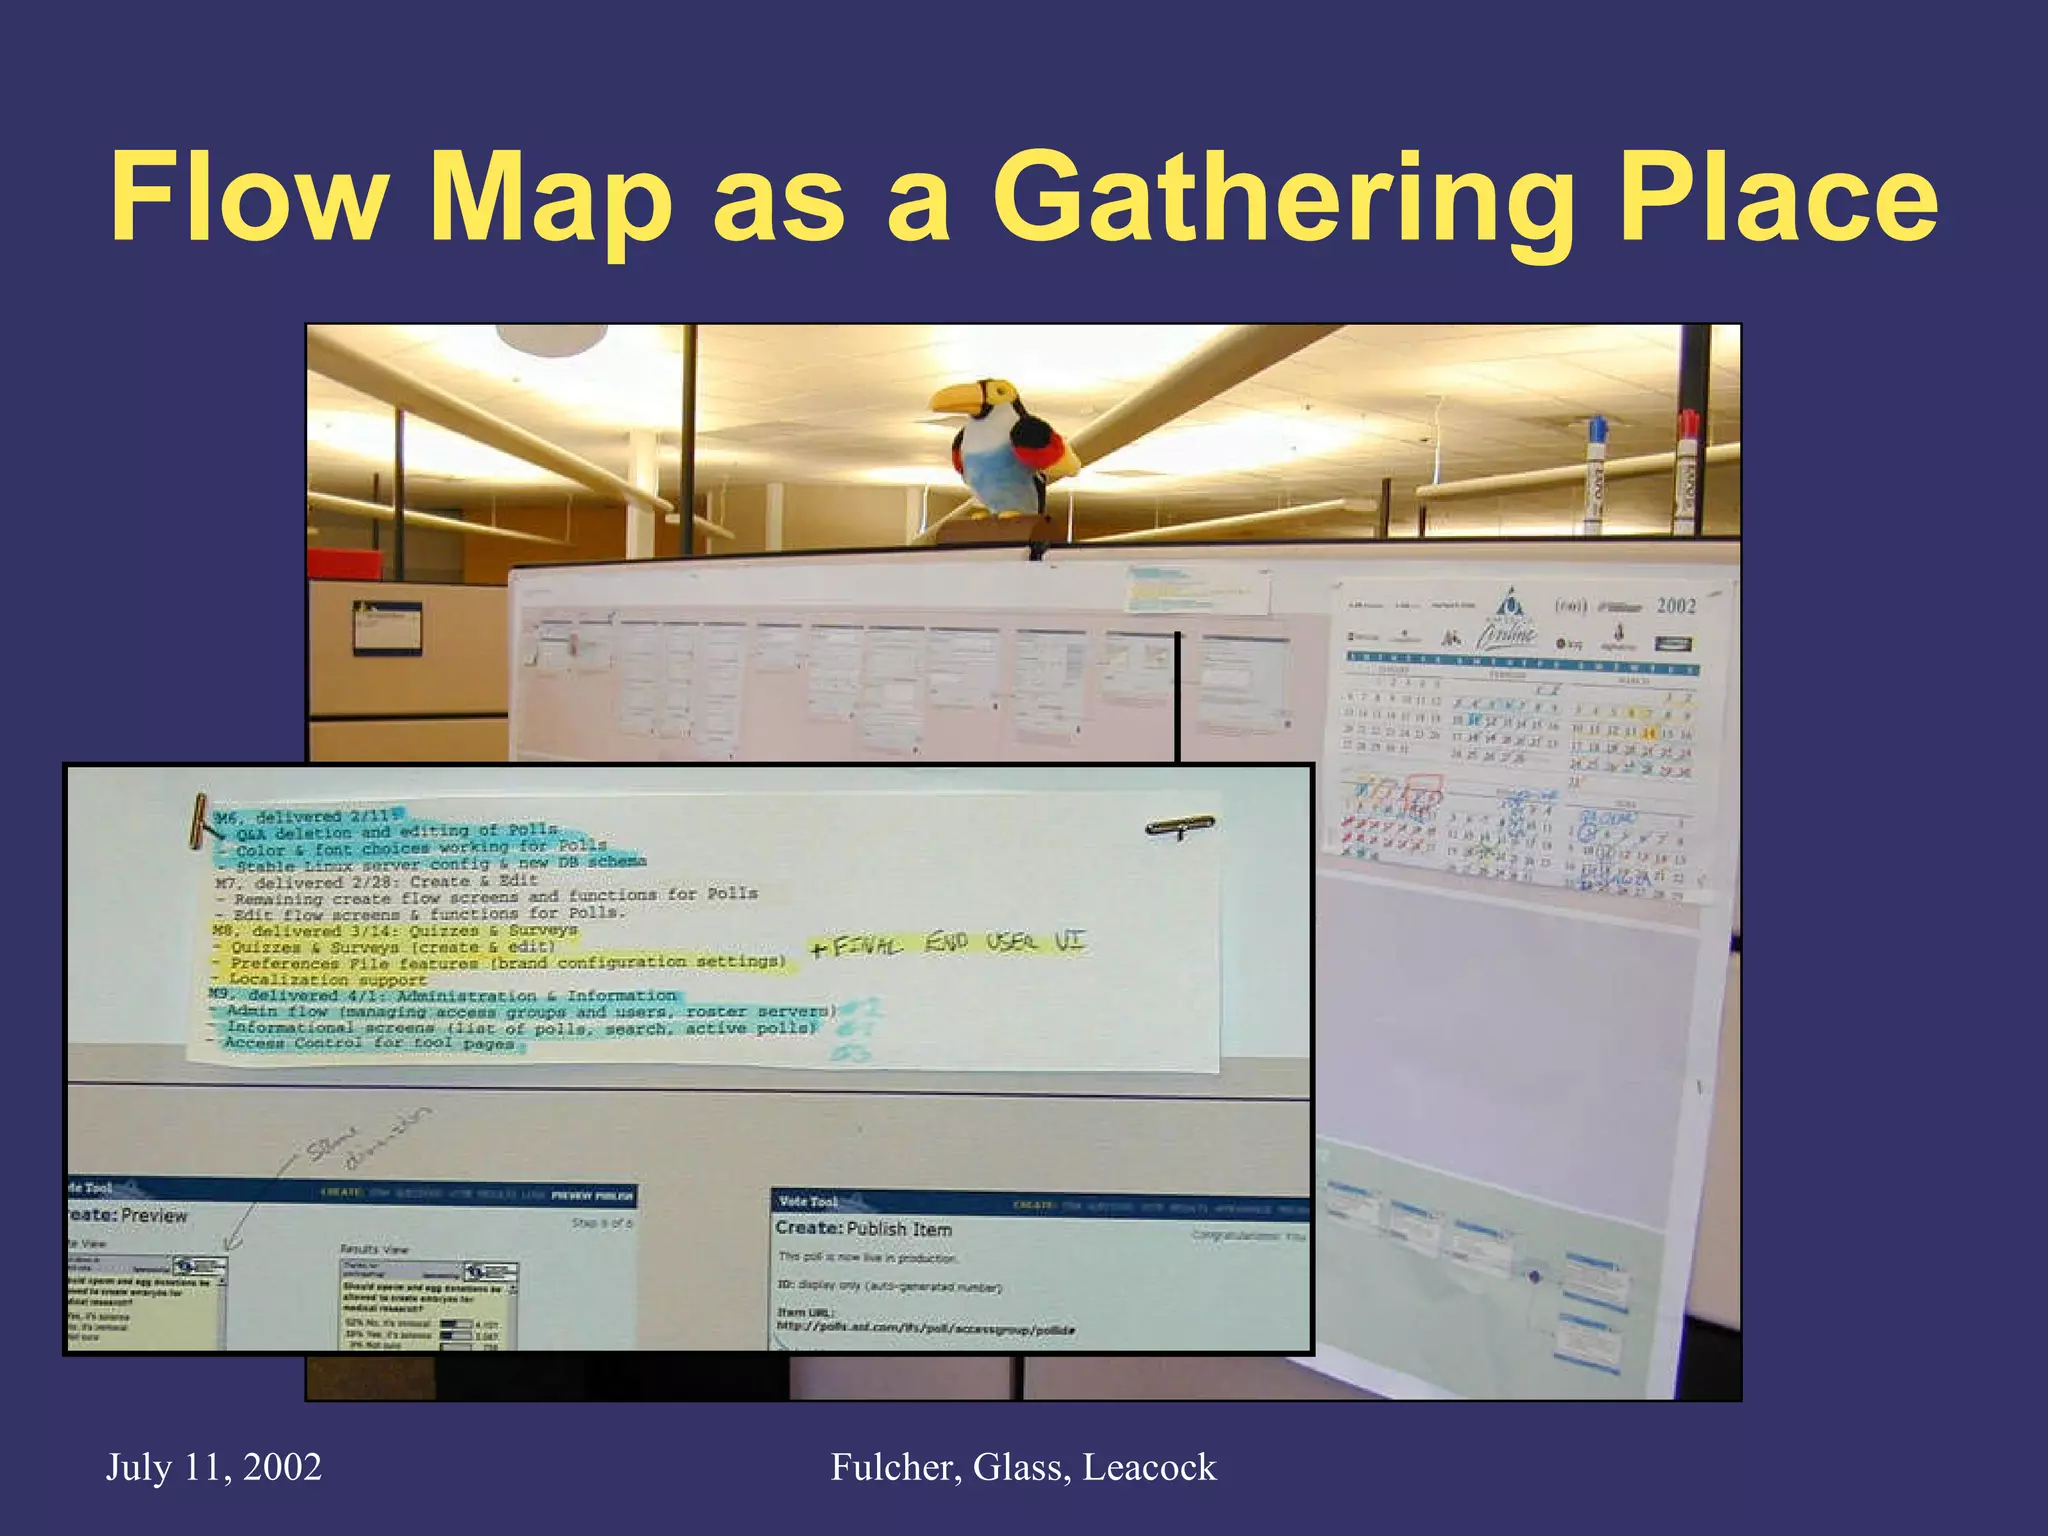
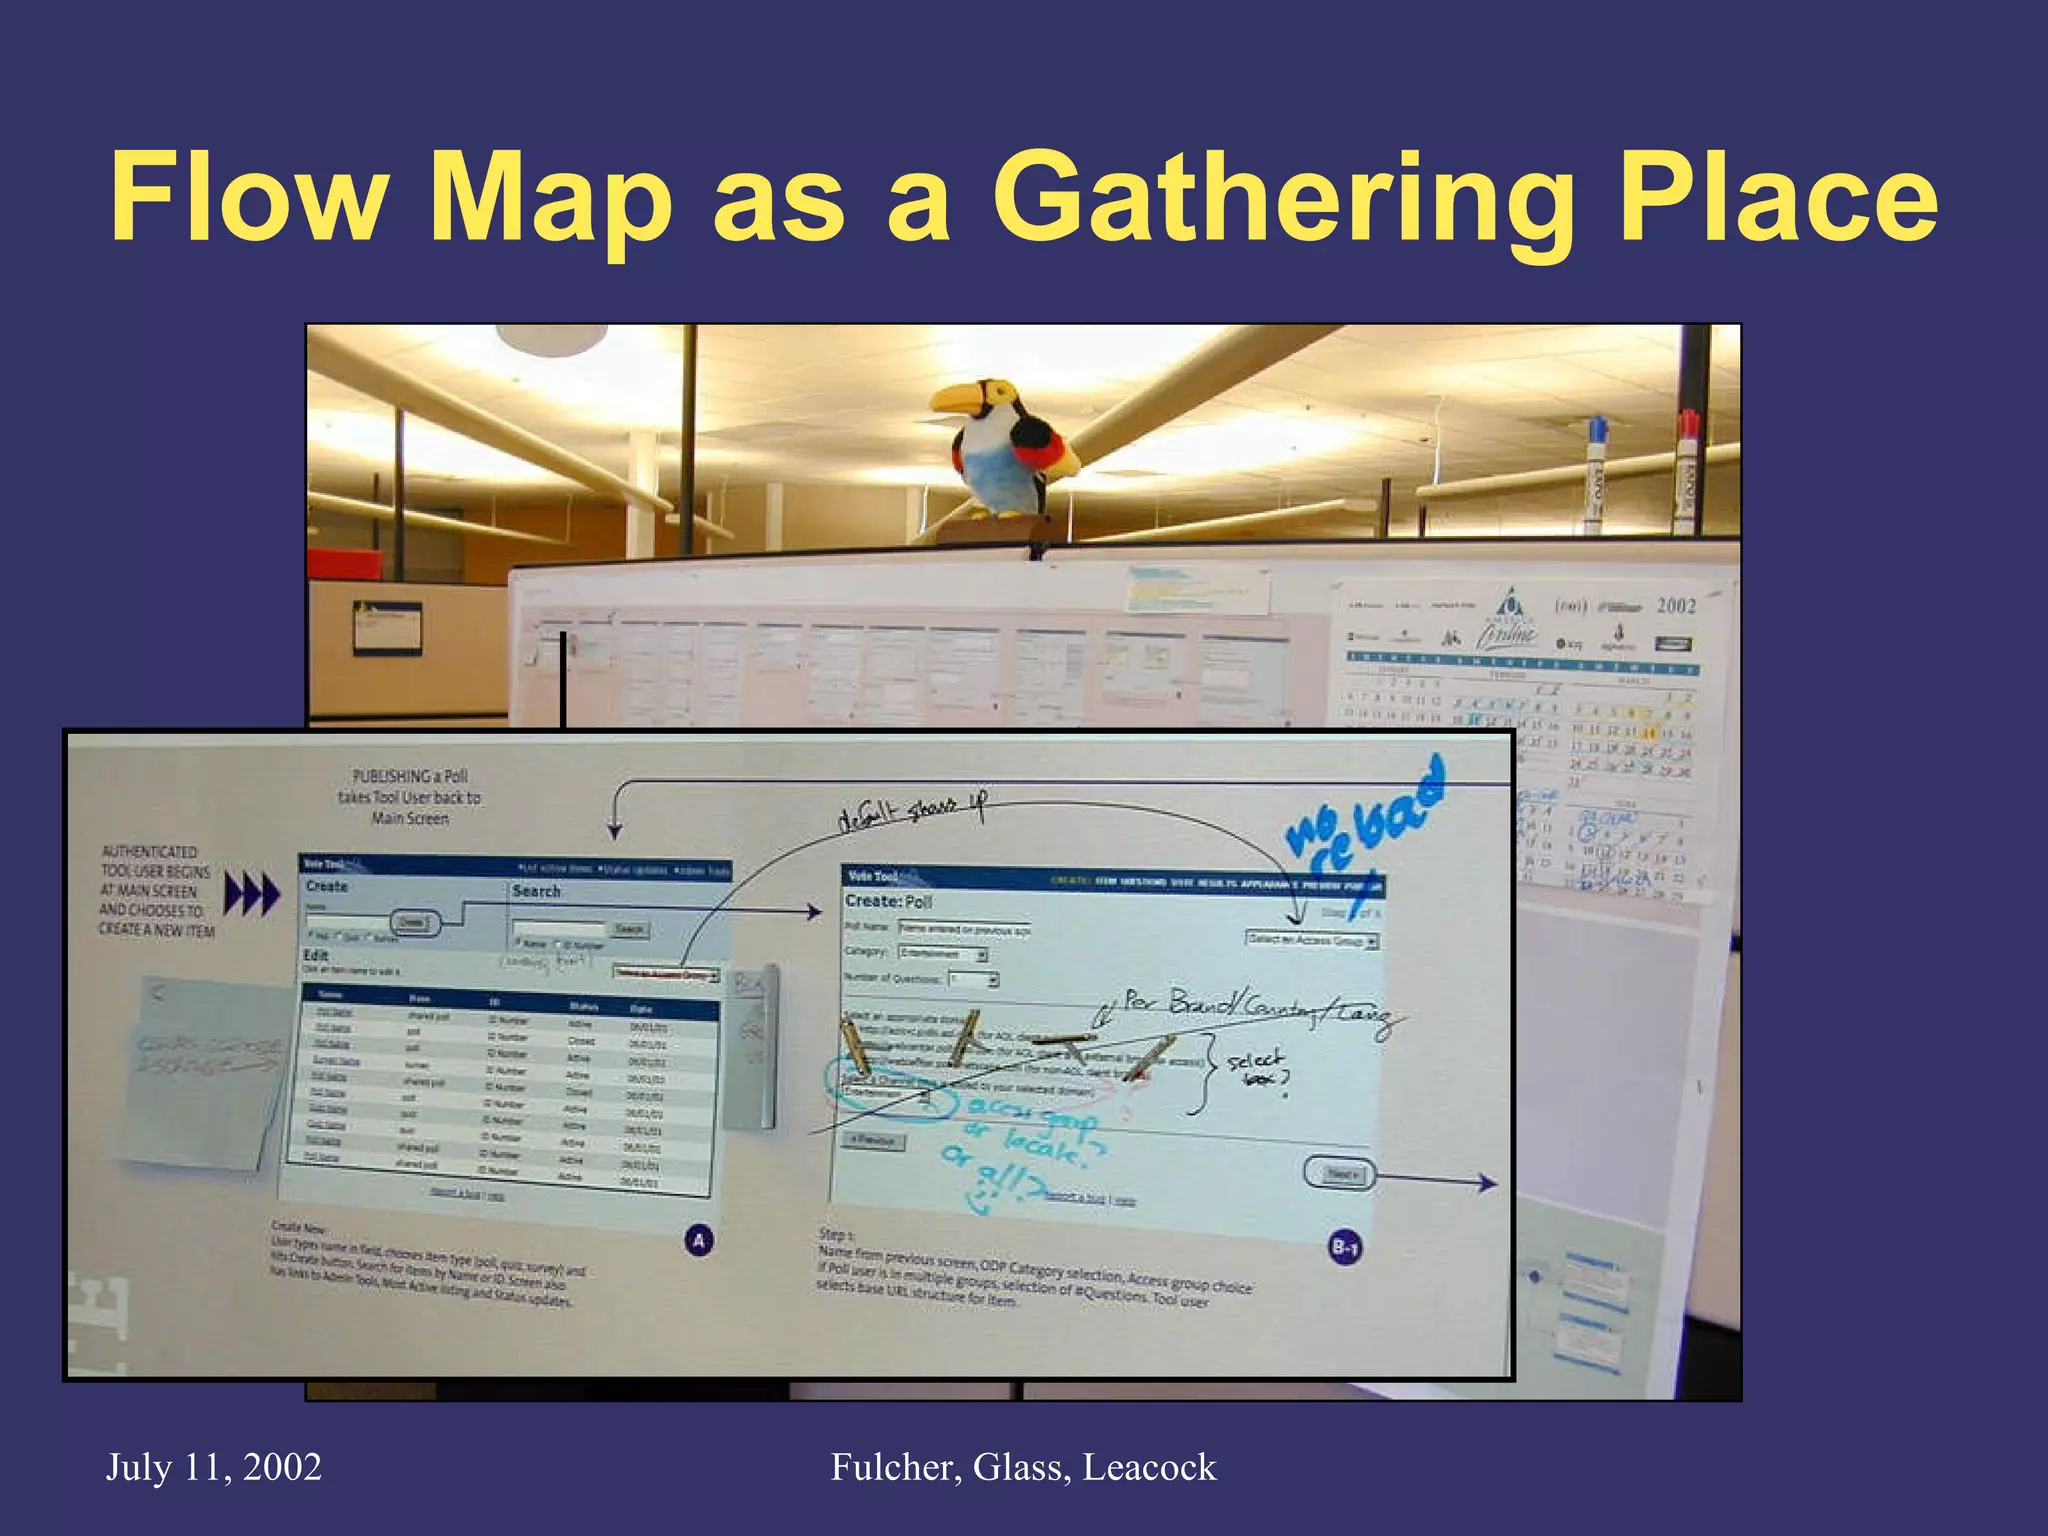
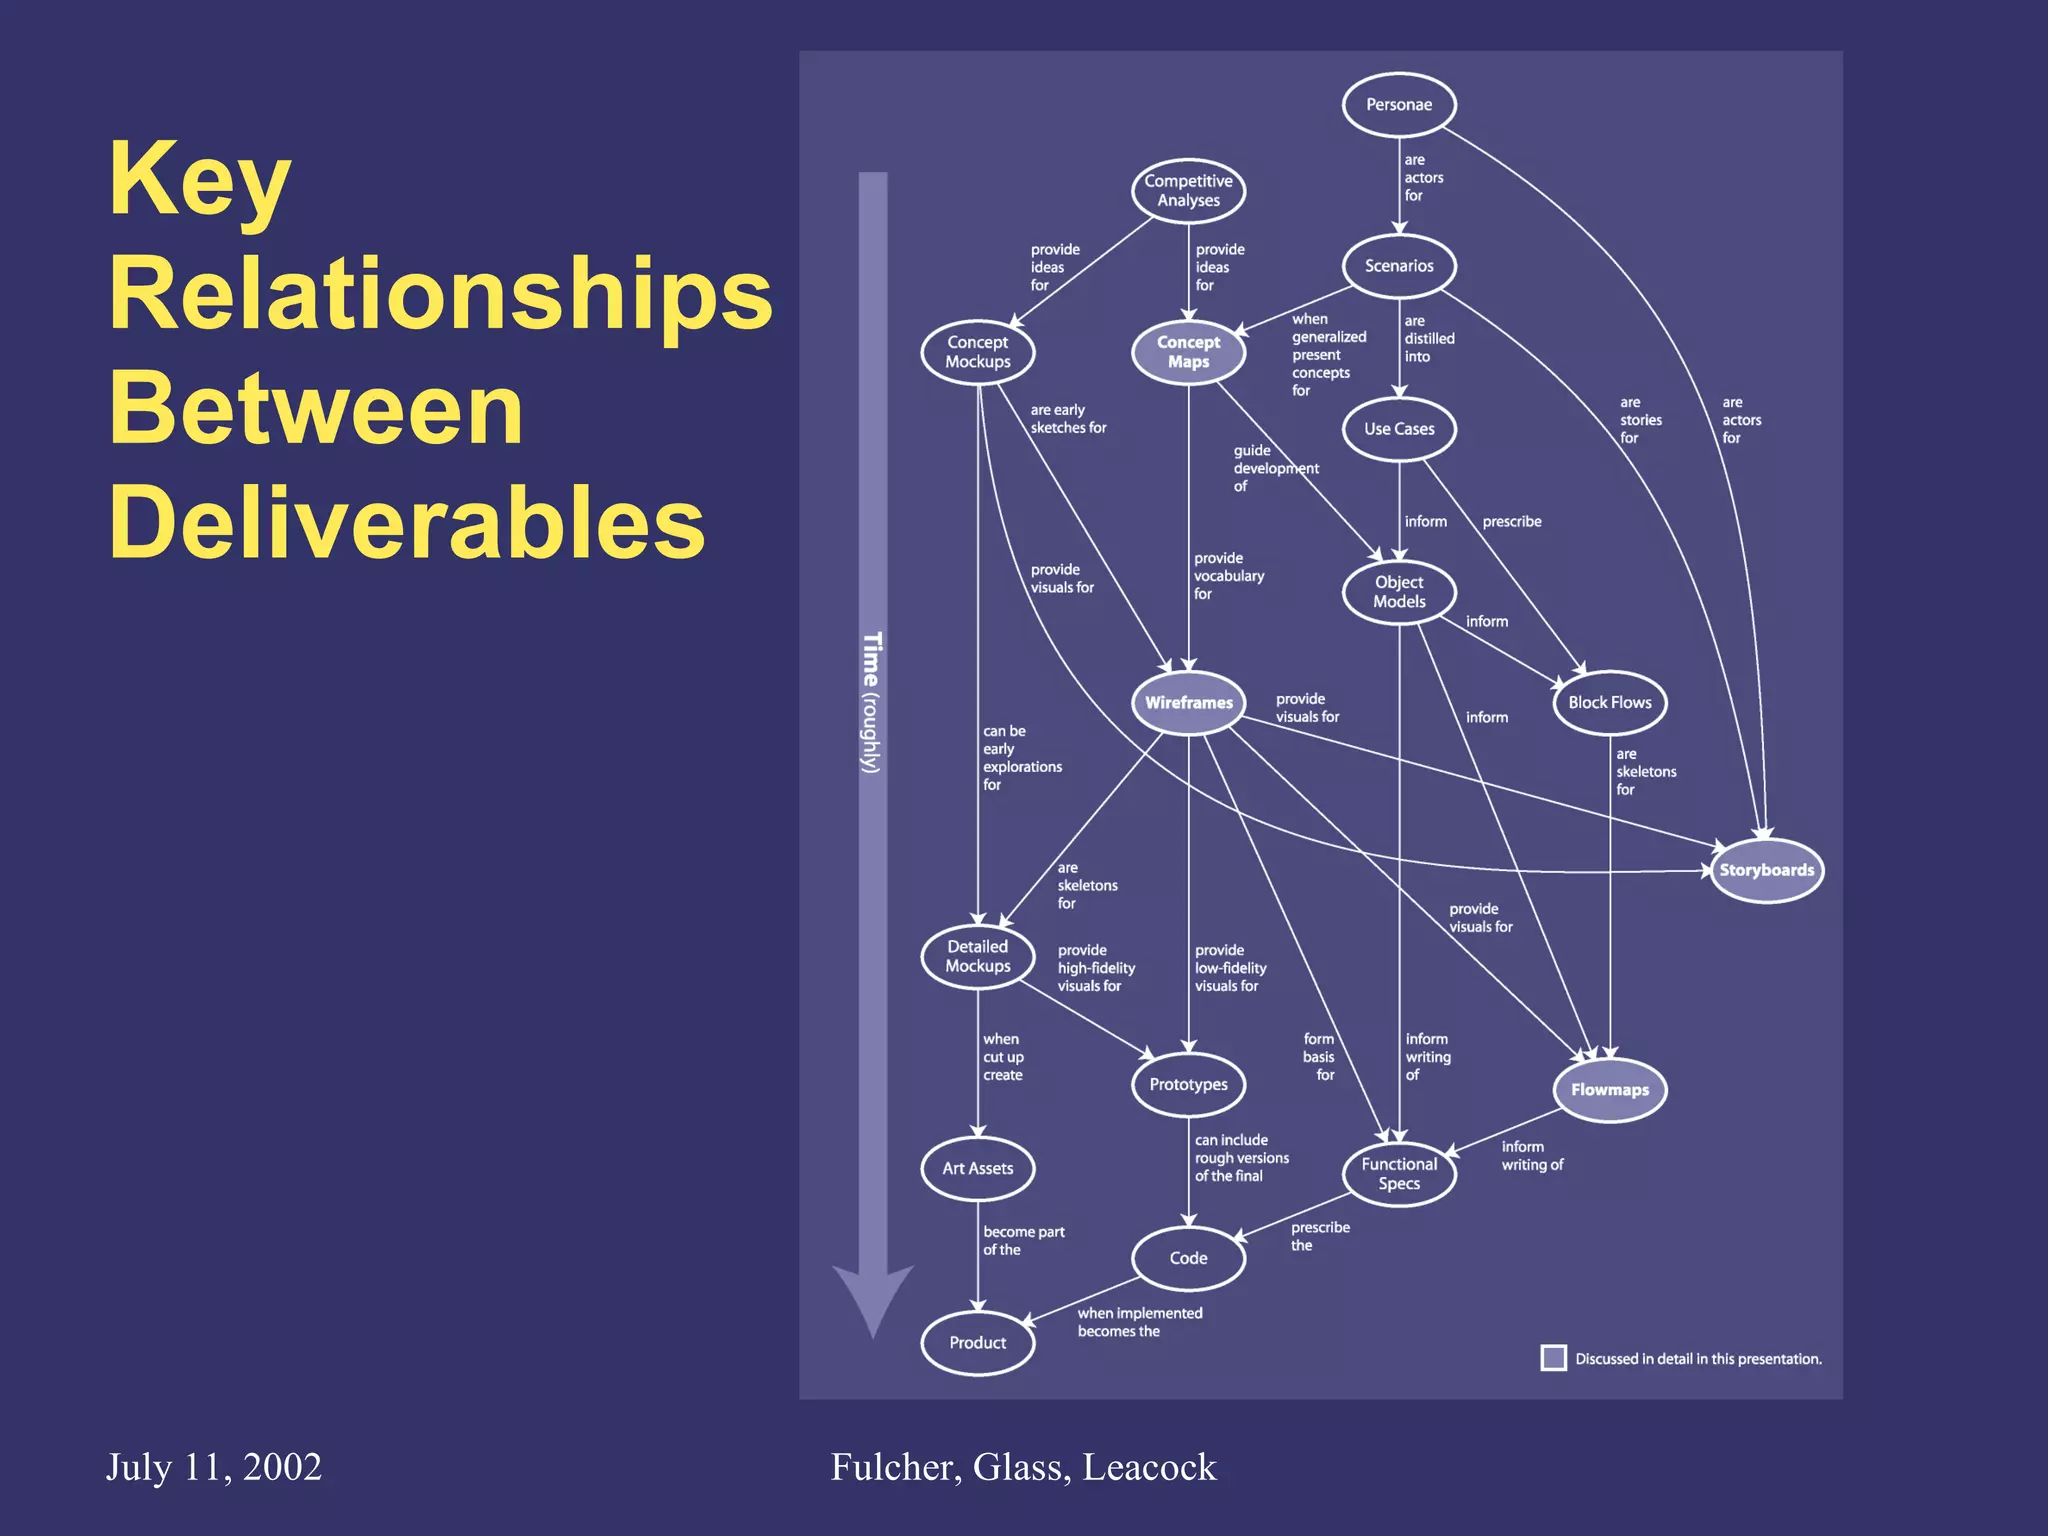
Deliverables that Clarify, Focus, and Improve Design Rich Fulcher, Bryce Glass, Matt Leacock, AOL Design Skills and Methods Beginner/Intermediate We will discuss the benefits of using  concept maps, wireframes, storyboards, and flow maps, and tips on how to produce each.
Deliverables that Clarify, Focus, and Improve Design Overview: Introduction Concept Maps Wireframes and Storyboards Flow Maps Conclusion Please don’t hold questions for the end—ask anytime during the presentation.
What Do We Mean by “Deliverables?” (Good) design is a participatory process, relying on cooperation and communication between: Designers (UI, visual, information architects) Engineers (managers, front-end, back-end) Product managers Business owners Project managers Deliverables are the documents that communicate the state of the design to fellow team members
And do we  really  believe “Clarify, Focus, and Improve Design?” Yes! Deliverables aid in communicating a product vision Are valuable for soliciting stakeholder feedback Makes whole team more accountable for design direction Deliverables help give design a greater voice in product development Being accountable for producing and sticking to deliverables make UI a full peer in development process Presents an opportunity to introduce user-centered design methodologies, and more opportunities to make sure findings of user research are not “lost in the shuffle”
The Deliverables  We’ll Talk About Today Concept Maps Early, high-level explorations of the ‘space’ the product will live in Wireframes Rough functional descriptions of specific user views Storyboards Compelling narratives that walk idealized “users” through sample tasks Flow Maps Complete blueprints of the views, logic, and pathways through an application
Things We Won’t (directly) Be Talking About Today A specific user-centered design process Some other well-known deliverables: User Personae Use Cases Prototypes (etc) Software tools for producing these deliverables
Humanized Design for Human Teammates The conference theme: “ If technology is to improve the human experience, it needs to respect human expectations, tendencies, and dignity” How we approach the design of deliverables: Documents are only truly successful if they provide value to at least some subset of team We need to understand the needs and expectations of our teammates, and design accordingly Much of this talk will focus on the benefits of deliverables for our audience
Concept Maps Matt Leacock
Concept Maps High-level maps Represent a set of meaningful relationships between a collection of concepts Covered in detail in Novak and Gowin’s  Learning How to Learn  (1985)
Anatomy of a Concept Map
Benefits for the Designer The  process  of drawing the map: Helps designer understand the domain  Is a creative process – new discoveries are made as the map is drawn Helps establish credibility with the team The map itself: Offers the first chance to interject the user as a guiding concept for the product
How to Make a Concept Map Identify the Main Concept List Related Concepts Draw a Rough Map Interview Team Members and Domain Experts Identify Synonyms and Instances Redraw, Redraw, Redraw Get Feedback from Team (Repeat 4-7)
Identify the Main Concept How To Make a Concept Map, Step 1 of 7 Identify the main concept Keeps the map focused Define the main concept Leads to many related concepts
List Related Concepts How To Make a Concept Map, Step 2 of 7 Jot down the concepts that come to mind first Don’t worry about: Organizing the words How important the concepts are How complete the list is Example for “Solar System”: Solar System Star Planets Sun Space Earth Moon Comets
Draw a Rough Map How To Make a Concept Map, Step 3 of 7 Don’t worry about drawing it perfectly Start with a large sheet of paper Add in linking words after you draw the links
Interview Others How To Make a Concept Map, Step 4 of 7 Show your sketch to team members and domain experts and ask them for additional concepts Generate a long list of concepts Example for “Solar System”: Solar System Galaxy Star Moon Satellites Sun Void Space Planets Earth Jupiter Saturn Uranus Neptune Mercury Venus Mars Pluto Comets Milky Way Meteoroids Interplanetary Medium Energy Interplanetary Dust Interplanetary Gas Plasma Solar Wind Comets
Identify Synonyms and Instances How To Make a Concept Map, Step 5 of 7 Combine synonyms into one concept List instances next to their parent concept Examples: Synonym Elimination Void, Vacuum, Space (Use “Space” for all three concepts) Instance Clustering Mars, Earth, Mercury, Jupiter (List next to Planets) Andromeda, Milky Way (List next to Galaxy)
Redraw, Redraw, Redraw How To Make a Concept Map, Step 6 of 7 Each time you redraw the map, you’ll discover new connections The map is never done
The Same Map, Redrawn How To Make a Concept Map, Step 6 of 7 (cont.) The maps are malleable and can be redrawn to highlight specific concepts or relationships.
Get Feedback from Team How To Make a Concept Map, Step 7 of 7 Check for understanding Validate relationships between concepts Check for completeness In the process, you’re building an agreement over what the concepts are and how they relate to each other.
Discover More with Matrices How To Make a Concept Map Create a matrix of the concepts Look for intersections of interest Add these as new links on your map
Look for an Organizing Principle How To Make a Concept Map Examples: Choose a dominant proposition Use a hierarchy Use overlapping propositions Use scale to aid reading order Larger concepts more important Use progressive builds or separate maps to gradually show additional complexity
Benefits for the Audience Concept Maps Defines a common vocabulary Quickly aggregates strands of team knowledge Becomes the  lingua franca  for cross-discipline meetings and communication Takes group knowledge out of minds and puts it on paper Brings new members up to speed quickly Reduces impact of departing team members Can encapsulate business or technology models as well as user-centered models
Sample Map: Internet Search Done for Netscape in 1999 Search was a new business for Netscape Had little domain knowledge and new to team
Sketches Sample Map: Internet Search
Complete Map Sample Map: Internet Search
Complete Map Sample Map: Internet Search Source:  http://www.oilzine.com
Basic Map Sample Map: Internet Search
Complete Map Sample Map: Internet Search
Wireframes and  Storyboards Rich Fulcher
Wireframes Appeared in the early 1960s as part of early Computer-Aided Design systems Represent complex objects through simple primitives (lines and points) in order to make it quick to render and easy to manipulate Source:  www. tnt . uni - hannover .de/org
Wireframes in UI Design A  wireframe  is a rough layout of a specific user view Skeletal view Shows contents as outlines or simple primitives Not concerned with branding or visual design  Shows organization of information and controls Positioning Clustering Ordering Hierarchy
Sample Wireframe
Sample Wireframe
Benefits for the Audience - Wireframes Business owners and product managers: Show “vision” for product Facilitate organizational buy-in process Visual Designers: Skeleton for visual exploration Engineers and technical writers: Guide work estimates
Benefits for the Designer - Wireframes As first output of design which “feels like” a UI, wireframes generate stakeholder conversation Correct invalid assumptions Check if key tasks and business objectives are supported Compared to mockups, wireframes are faster to produce and can be iterated more rapidly Wireframes can be used to compare multiple design solutions cheaply and quickly  Wireframes can be used in lo-fi usability testing early in development cycle Test as paper or lightweight prototype (clickable image maps)
Working with Wireframes Pen and paper are fine initially
Working with Wireframes Vector-based drawing packages can create flexible wireframes quickly
Working with Wireframes Iterate frequently  Make use of flexibility of fidelity Start simple Increase fidelity as you iterate
Storyboards In film and TV, storyboards are used to plan key shots in a sequence -  a visual script They demonstrate how the shots relate to each other to form a whole experience Source: Josh Sheppard,  www.thestoryboardartist.com
Storyboards in UI Design A  storyboard  uses a sequence of wireframes following a particular scenario to illustrate a sample series of interactions. Highlights the key interactions that correspond to a user’s experience of a particular task. Focused on a target user, not an “everyuser”
Sample Storyboard Frame
Benefits for the Audience - Storyboards Business owners and product managers: Storyboards speak to the “feel” of the product  Convey a larger sense of user experience Executives: Storyboards tell story of a legitimate user task External stakeholders, new team members: Storyboards can be an introduction to the product
Benefits for the Designer - Storyboards Do a better job than wireframes of focusing stakeholder feedback on tasks and behaviors Facilitate “walking through” design when stakeholders are remote (ie conference calls)
Working with Storyboards Choose representative and compelling scenarios Do focus on new views / interactions Don’t focus on familiar behaviors (logging in, etc) Don’t create a single comprehensive storyboard Create multiple story segments Each segment depicts a distinct user task Show clear entry and completion steps
Working with Storyboards Don’t rely on a storyboard to speak for itself Annotate storyboards with context Film storyboards are often shown in context with script, which includes dialog and stage directions Develop a lightweight user persona (the actor) Include user motivations Use an appropriate level of detail You don’t have to show every mouse click or string of text entered
Flow Maps Bryce Glass
Flow Maps A  flow map  is the comprehensive, canonical representation of a product’s scope, features and functionality. Shows all screens In multiple states With edge cases Shows relationships between screens  Gives insight into application logic But it’s not specifically an engineering diagram
Sample Flow Map
Benefits for the Audience Business owners and product managers: flow map shows the product in its entirety, aids in understanding of technical & design issues Engineers and technical writers: flow map shows scope and complexity of product Provide ‘checksheet’ for tracking job completion, and an index for tracking assets. Quality Assurance: QA/QE uses map to build test plans
Flow Map as a Gathering Place
Benefits for the Designer Grand Overview Provides a holistic, at-a-glance overview of the scope and ‘texture’ of a product Read it like a topographical map - use the ‘peaks’ and ‘valleys’ to gauge your level of effort. Helps establish ownership of the user experience for a product.  Map becomes the  de facto  tool for settling issues, answering questions Complements PRD, but adds some dimensions that are missing from that document.
Benefits for the Designer (Cont.) Shows Interrelationships  between  application functions and screens On a scale  larger  than that of Storyboards  To a degree  greater  than that of Block Diagrams Helps designer to visualize the complete solution that they’re providing Suggests alternative design solutions Identifies higher-order design patterns
Benefits for the Designer (Cont.) Use the map to combat feature creep Ask ‘feature contributors’ to ‘place’ their suggestions in the larger context of the overall product. Points out larger repercussions Gives a sense of level of effort
Working with flow maps Pencil and paper are a valuable first step Think about large functional areas and allot enough space for all major features (plan on creep) You will quickly leave pencil & paper behind Move to a vector illustration program. For ease of maintenance: Visio, OmniGraffle For control and scalability: Illustrator, Freehand, or a page layout program
Strategy: Progressive Cognition Scannable at a glance… The executive-level view Readable with some attention… Most team conversations take place at this level Deeper, rich understandings can be layered in.
Scannable at a Glance Use discrete color coding to separate functional areas, improve  the readability of the map.
Readable, with some attention Practice good basic information design to ensure that the readers’ attention is not lost. Tasteful color-coding  Be diligent about aligning elements & leaving whitespace Easier to read Leaves room for scribbled notes, team comments, etc. Keep screens at a size that is human-readable at full-scale.
Readable, with some attention (Cont.) Identify higher-order patterns and refer to them in object-oriented visual hierarchies Give intelligible and unique names to all screens Give unique numbers to all screens Try a grid system!
Readable, with some attention (Cont.) Develop a standard visual language
Readable, with some attention (Cont.) Maintain a sense of narrative. Tell a consistent story with your screens. Example: Create a Group, the Johnson Clan. Leverage the work done at the storyboarding stage Arbitrary name/data changes are confusing and will harm the maps effectiveness.
Layer in deeper understanding Add value to the map by making it more useful for team members. Don’t do this at the expense of clarity, readability or your own valuable time.
Layer in deeper understanding Include engineering details State information, or data passed from screen to screen Page URLs, if these can be known in advance (or suggestions, if they can’t be.) Include infrastructure details Integration points with  other  products. Pass-off points to Partner sites, etc. Sidebars focused on specific elements or topics Eg. Behavior of Navigation widget
If you’re succesful… Everyone will want one. (This is good and bad.) Maintenance will become an issue. Be cognizant of the proper place for flow maps in the design and development process. (Don’t jump in too early.) Buy more paper and ink!
Conclusion The common thread:  facilitating team communication Different representations focus the conversation on different issues at different stages of development We’ve focused on four types of deliverables, but there are many others Strength comes from inter-relations of deliverables Work done at one stage is re-used and refined in later ones These inter-relations are not strictly linear
Key Relationships Between Deliverables
More Information Packet www.leacock.com/deliverables This presentation PDF kits for: Concept Maps Wireframes Storyboards Block Diagrams Flow Maps
Deliverables that Clarify, Focus, and Improve Design Rich Fulcher, Bryce Glass, Matt Leacock, AOL Design Skills and Methods Beginner/Intermediate We will discuss the benefits of using  concept maps, wireframes, storyboards, and flow maps, and tips on how to produce each.

Deliverables that Clarify, Focus, and Improve Design

  • 1.
    Deliverables that Clarify,Focus, and Improve Design Rich Fulcher, Bryce Glass, Matt Leacock, AOL Design Skills and Methods Beginner/Intermediate We will discuss the benefits of using concept maps, wireframes, storyboards, and flow maps, and tips on how to produce each.
  • 2.
    Deliverables that Clarify,Focus, and Improve Design Overview: Introduction Concept Maps Wireframes and Storyboards Flow Maps Conclusion Please don’t hold questions for the end—ask anytime during the presentation.
  • 3.
    What Do WeMean by “Deliverables?” (Good) design is a participatory process, relying on cooperation and communication between: Designers (UI, visual, information architects) Engineers (managers, front-end, back-end) Product managers Business owners Project managers Deliverables are the documents that communicate the state of the design to fellow team members
  • 4.
    And do we really believe “Clarify, Focus, and Improve Design?” Yes! Deliverables aid in communicating a product vision Are valuable for soliciting stakeholder feedback Makes whole team more accountable for design direction Deliverables help give design a greater voice in product development Being accountable for producing and sticking to deliverables make UI a full peer in development process Presents an opportunity to introduce user-centered design methodologies, and more opportunities to make sure findings of user research are not “lost in the shuffle”
  • 5.
    The Deliverables We’ll Talk About Today Concept Maps Early, high-level explorations of the ‘space’ the product will live in Wireframes Rough functional descriptions of specific user views Storyboards Compelling narratives that walk idealized “users” through sample tasks Flow Maps Complete blueprints of the views, logic, and pathways through an application
  • 6.
    Things We Won’t(directly) Be Talking About Today A specific user-centered design process Some other well-known deliverables: User Personae Use Cases Prototypes (etc) Software tools for producing these deliverables
  • 7.
    Humanized Design forHuman Teammates The conference theme: “ If technology is to improve the human experience, it needs to respect human expectations, tendencies, and dignity” How we approach the design of deliverables: Documents are only truly successful if they provide value to at least some subset of team We need to understand the needs and expectations of our teammates, and design accordingly Much of this talk will focus on the benefits of deliverables for our audience
  • 8.
  • 9.
    Concept Maps High-levelmaps Represent a set of meaningful relationships between a collection of concepts Covered in detail in Novak and Gowin’s Learning How to Learn (1985)
  • 10.
    Anatomy of aConcept Map
  • 11.
    Anatomy of aConcept Map
  • 12.
    Anatomy of aConcept Map
  • 13.
    Benefits for theDesigner The process of drawing the map: Helps designer understand the domain Is a creative process – new discoveries are made as the map is drawn Helps establish credibility with the team The map itself: Offers the first chance to interject the user as a guiding concept for the product
  • 14.
    How to Makea Concept Map Identify the Main Concept List Related Concepts Draw a Rough Map Interview Team Members and Domain Experts Identify Synonyms and Instances Redraw, Redraw, Redraw Get Feedback from Team (Repeat 4-7)
  • 15.
    Identify the MainConcept How To Make a Concept Map, Step 1 of 7 Identify the main concept Keeps the map focused Define the main concept Leads to many related concepts
  • 16.
    List Related ConceptsHow To Make a Concept Map, Step 2 of 7 Jot down the concepts that come to mind first Don’t worry about: Organizing the words How important the concepts are How complete the list is Example for “Solar System”: Solar System Star Planets Sun Space Earth Moon Comets
  • 17.
    Draw a RoughMap How To Make a Concept Map, Step 3 of 7 Don’t worry about drawing it perfectly Start with a large sheet of paper Add in linking words after you draw the links
  • 18.
    Interview Others HowTo Make a Concept Map, Step 4 of 7 Show your sketch to team members and domain experts and ask them for additional concepts Generate a long list of concepts Example for “Solar System”: Solar System Galaxy Star Moon Satellites Sun Void Space Planets Earth Jupiter Saturn Uranus Neptune Mercury Venus Mars Pluto Comets Milky Way Meteoroids Interplanetary Medium Energy Interplanetary Dust Interplanetary Gas Plasma Solar Wind Comets
  • 19.
    Identify Synonyms andInstances How To Make a Concept Map, Step 5 of 7 Combine synonyms into one concept List instances next to their parent concept Examples: Synonym Elimination Void, Vacuum, Space (Use “Space” for all three concepts) Instance Clustering Mars, Earth, Mercury, Jupiter (List next to Planets) Andromeda, Milky Way (List next to Galaxy)
  • 20.
    Redraw, Redraw, RedrawHow To Make a Concept Map, Step 6 of 7 Each time you redraw the map, you’ll discover new connections The map is never done
  • 21.
    The Same Map,Redrawn How To Make a Concept Map, Step 6 of 7 (cont.) The maps are malleable and can be redrawn to highlight specific concepts or relationships.
  • 22.
    Get Feedback fromTeam How To Make a Concept Map, Step 7 of 7 Check for understanding Validate relationships between concepts Check for completeness In the process, you’re building an agreement over what the concepts are and how they relate to each other.
  • 23.
    Discover More withMatrices How To Make a Concept Map Create a matrix of the concepts Look for intersections of interest Add these as new links on your map
  • 24.
    Look for anOrganizing Principle How To Make a Concept Map Examples: Choose a dominant proposition Use a hierarchy Use overlapping propositions Use scale to aid reading order Larger concepts more important Use progressive builds or separate maps to gradually show additional complexity
  • 25.
    Benefits for theAudience Concept Maps Defines a common vocabulary Quickly aggregates strands of team knowledge Becomes the lingua franca for cross-discipline meetings and communication Takes group knowledge out of minds and puts it on paper Brings new members up to speed quickly Reduces impact of departing team members Can encapsulate business or technology models as well as user-centered models
  • 26.
    Sample Map: InternetSearch Done for Netscape in 1999 Search was a new business for Netscape Had little domain knowledge and new to team
  • 27.
    Sketches Sample Map:Internet Search
  • 28.
    Complete Map SampleMap: Internet Search
  • 29.
    Complete Map SampleMap: Internet Search Source: http://www.oilzine.com
  • 30.
    Basic Map SampleMap: Internet Search
  • 31.
    Complete Map SampleMap: Internet Search
  • 32.
    Wireframes and Storyboards Rich Fulcher
  • 33.
    Wireframes Appeared inthe early 1960s as part of early Computer-Aided Design systems Represent complex objects through simple primitives (lines and points) in order to make it quick to render and easy to manipulate Source: www. tnt . uni - hannover .de/org
  • 34.
    Wireframes in UIDesign A wireframe is a rough layout of a specific user view Skeletal view Shows contents as outlines or simple primitives Not concerned with branding or visual design Shows organization of information and controls Positioning Clustering Ordering Hierarchy
  • 35.
  • 36.
  • 37.
    Benefits for theAudience - Wireframes Business owners and product managers: Show “vision” for product Facilitate organizational buy-in process Visual Designers: Skeleton for visual exploration Engineers and technical writers: Guide work estimates
  • 38.
    Benefits for theDesigner - Wireframes As first output of design which “feels like” a UI, wireframes generate stakeholder conversation Correct invalid assumptions Check if key tasks and business objectives are supported Compared to mockups, wireframes are faster to produce and can be iterated more rapidly Wireframes can be used to compare multiple design solutions cheaply and quickly Wireframes can be used in lo-fi usability testing early in development cycle Test as paper or lightweight prototype (clickable image maps)
  • 39.
    Working with WireframesPen and paper are fine initially
  • 40.
    Working with WireframesVector-based drawing packages can create flexible wireframes quickly
  • 41.
    Working with WireframesIterate frequently Make use of flexibility of fidelity Start simple Increase fidelity as you iterate
  • 42.
    Storyboards In filmand TV, storyboards are used to plan key shots in a sequence - a visual script They demonstrate how the shots relate to each other to form a whole experience Source: Josh Sheppard, www.thestoryboardartist.com
  • 43.
    Storyboards in UIDesign A storyboard uses a sequence of wireframes following a particular scenario to illustrate a sample series of interactions. Highlights the key interactions that correspond to a user’s experience of a particular task. Focused on a target user, not an “everyuser”
  • 44.
  • 45.
    Benefits for theAudience - Storyboards Business owners and product managers: Storyboards speak to the “feel” of the product Convey a larger sense of user experience Executives: Storyboards tell story of a legitimate user task External stakeholders, new team members: Storyboards can be an introduction to the product
  • 46.
    Benefits for theDesigner - Storyboards Do a better job than wireframes of focusing stakeholder feedback on tasks and behaviors Facilitate “walking through” design when stakeholders are remote (ie conference calls)
  • 47.
    Working with StoryboardsChoose representative and compelling scenarios Do focus on new views / interactions Don’t focus on familiar behaviors (logging in, etc) Don’t create a single comprehensive storyboard Create multiple story segments Each segment depicts a distinct user task Show clear entry and completion steps
  • 48.
    Working with StoryboardsDon’t rely on a storyboard to speak for itself Annotate storyboards with context Film storyboards are often shown in context with script, which includes dialog and stage directions Develop a lightweight user persona (the actor) Include user motivations Use an appropriate level of detail You don’t have to show every mouse click or string of text entered
  • 49.
  • 50.
    Flow Maps A flow map is the comprehensive, canonical representation of a product’s scope, features and functionality. Shows all screens In multiple states With edge cases Shows relationships between screens Gives insight into application logic But it’s not specifically an engineering diagram
  • 51.
  • 52.
    Benefits for theAudience Business owners and product managers: flow map shows the product in its entirety, aids in understanding of technical & design issues Engineers and technical writers: flow map shows scope and complexity of product Provide ‘checksheet’ for tracking job completion, and an index for tracking assets. Quality Assurance: QA/QE uses map to build test plans
  • 53.
    Flow Map asa Gathering Place
  • 54.
    Flow Map asa Gathering Place
  • 55.
    Flow Map asa Gathering Place
  • 56.
    Flow Map asa Gathering Place
  • 57.
    Benefits for theDesigner Grand Overview Provides a holistic, at-a-glance overview of the scope and ‘texture’ of a product Read it like a topographical map - use the ‘peaks’ and ‘valleys’ to gauge your level of effort. Helps establish ownership of the user experience for a product. Map becomes the de facto tool for settling issues, answering questions Complements PRD, but adds some dimensions that are missing from that document.
  • 58.
    Benefits for theDesigner (Cont.) Shows Interrelationships between application functions and screens On a scale larger than that of Storyboards To a degree greater than that of Block Diagrams Helps designer to visualize the complete solution that they’re providing Suggests alternative design solutions Identifies higher-order design patterns
  • 59.
    Benefits for theDesigner (Cont.) Use the map to combat feature creep Ask ‘feature contributors’ to ‘place’ their suggestions in the larger context of the overall product. Points out larger repercussions Gives a sense of level of effort
  • 60.
    Working with flowmaps Pencil and paper are a valuable first step Think about large functional areas and allot enough space for all major features (plan on creep) You will quickly leave pencil & paper behind Move to a vector illustration program. For ease of maintenance: Visio, OmniGraffle For control and scalability: Illustrator, Freehand, or a page layout program
  • 61.
    Strategy: Progressive CognitionScannable at a glance… The executive-level view Readable with some attention… Most team conversations take place at this level Deeper, rich understandings can be layered in.
  • 62.
    Scannable at aGlance Use discrete color coding to separate functional areas, improve the readability of the map.
  • 63.
    Readable, with someattention Practice good basic information design to ensure that the readers’ attention is not lost. Tasteful color-coding Be diligent about aligning elements & leaving whitespace Easier to read Leaves room for scribbled notes, team comments, etc. Keep screens at a size that is human-readable at full-scale.
  • 64.
    Readable, with someattention (Cont.) Identify higher-order patterns and refer to them in object-oriented visual hierarchies Give intelligible and unique names to all screens Give unique numbers to all screens Try a grid system!
  • 65.
    Readable, with someattention (Cont.) Develop a standard visual language
  • 66.
    Readable, with someattention (Cont.) Maintain a sense of narrative. Tell a consistent story with your screens. Example: Create a Group, the Johnson Clan. Leverage the work done at the storyboarding stage Arbitrary name/data changes are confusing and will harm the maps effectiveness.
  • 67.
    Layer in deeperunderstanding Add value to the map by making it more useful for team members. Don’t do this at the expense of clarity, readability or your own valuable time.
  • 68.
    Layer in deeperunderstanding Include engineering details State information, or data passed from screen to screen Page URLs, if these can be known in advance (or suggestions, if they can’t be.) Include infrastructure details Integration points with other products. Pass-off points to Partner sites, etc. Sidebars focused on specific elements or topics Eg. Behavior of Navigation widget
  • 69.
    If you’re succesful…Everyone will want one. (This is good and bad.) Maintenance will become an issue. Be cognizant of the proper place for flow maps in the design and development process. (Don’t jump in too early.) Buy more paper and ink!
  • 70.
    Conclusion The commonthread: facilitating team communication Different representations focus the conversation on different issues at different stages of development We’ve focused on four types of deliverables, but there are many others Strength comes from inter-relations of deliverables Work done at one stage is re-used and refined in later ones These inter-relations are not strictly linear
  • 71.
  • 72.
    More Information Packetwww.leacock.com/deliverables This presentation PDF kits for: Concept Maps Wireframes Storyboards Block Diagrams Flow Maps
  • 73.
    Deliverables that Clarify,Focus, and Improve Design Rich Fulcher, Bryce Glass, Matt Leacock, AOL Design Skills and Methods Beginner/Intermediate We will discuss the benefits of using concept maps, wireframes, storyboards, and flow maps, and tips on how to produce each.

Editor's Notes

  • #6 We’ll divide the discussion between Matt, Bryce, and myself … but these are all deliverables which each of use and find value in
  • #34 Wireframes were a simple way to display 3D objects on 2D surface
  • #36 Divides window into segments Shows controls very simply … consider scrollbar and buttons
  • #37 Divides window into segments Shows controls very simply … consider scrollbar and buttons Even the more detailed but (the emoticon drop down) represents a multitude of functions (font, font size, style, color, etc)
  • #40 This is for the message boards application
  • #41 This is the same view as shown in previous sketch
  • #42 The top slide simply divides window into broad areas, and groups together the user questions that would be addressed in each area
  • #43 What happens; how it happens; where it happens Used as advance sell before money for production is approved (eg commercials)
  • #44 Film director analogy: storyboards are used to show how key shots in a sequence relate to each other to form a whole experience
  • #48 Multiple segments can be far more flexible Mantaining a monolithic story is difficult
  • #68 But remember… these details are not the primary purpose of the map. Make them discrete and develop a sustainable method for adding them and maintaining them.
  • #69 But remember… these details are not the primary purpose of the map. Make them discrete and develop a sustainable method for adding them and maintaining them.
  • #70 But remember… these details are not the primary purpose of the map. Make them discrete and develop a sustainable method for adding them and maintaining them.