Downloaded 81 times


![BERG - HUGHES
C E N T E R
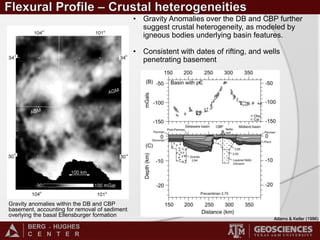
Adams, D. & Keller, G. (1996). Precambrian basement geology of the Permian Basin region of West Texas and eastern New Mexico; a geophysical
perspective. AAPG Bulletin, 80(3), 410-431. Retrieved from http://aapgbull.geoscienceworld.org/content/80/3/410
Anthony, J. (2015). PROVENANCE OF THE MIDDLE PERMIAN, DELAWARE MOUNTAIN GROUP: DELAWARE BASIN, SOUTHEAST NEW MEXICO
AND WEST TEXAS. Repository.tcu.edu. https://repository.tcu.edu/handle/116099117/8303
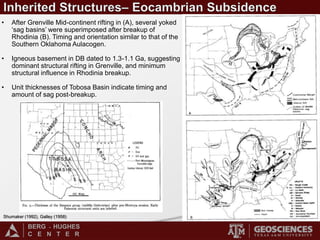
Galley, J. E., (1958), Oil and geology in the Permian Basin of Texas and New Mexico, in Weeks, L. G., ed., Habitat of oil: Tulsa, Oklahoma, American
Association of Petroleum Geologists, p. 395–446
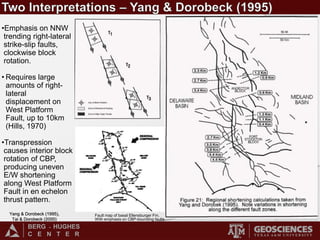
Hills, J. (1970). Late Paleozoic Structural Directions in Southern Permian Basin, West Texas and Southeastern New Mexico. AAPG Bulletin, 54(10), 1809-
1827. Retrieved from http://archives.datapages.com/data/bulletns/1968-70/data/pg/0054/0010/1800/1809.htm?doi=10.1306%2F5D25CC3B-16C1-11D7-
8645000102C1865D
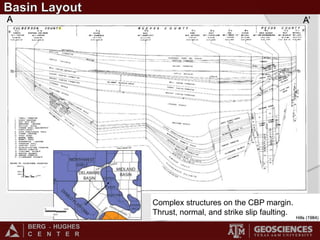
Hills, J. (1984). Sedimentation, Tectonism, and Hydrocarbon Generation in Delaware Basin, West Texas and Southeastern New Mexico. AAPG
Bulletin, 68(3), 250-267. Retrieved from http://archives.datapages.com/data/bulletns/1984-85/data/pg/0068/0003/0250/0250.htm
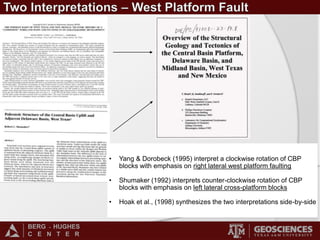
Hoak, T.; Sundberg, K. & Ortoleva, P. (1998) Overview of the structural geology and tectonics of the Central Basin Platform, Delaware Basin, and Midland
Basin, West Texas and New Mexico. Germantown, Maryland. UNT Digital Library.http://digital.library.unt.edu/ark:/67531/metadc678963/.
Romans, B.W., (2003) Sedimentation Patterns of a Permian Basinal Cycle, Upper Cutoff, Brushy Canyon, and Lower Cherry Canyon Formations, Western
Delaware Basin, West Texas and Southeastern New Mexico, U.S.A. [Unpublished Master’s Thesis]: Colorado School of Mines, 175 p.
http://dx.doi.org/10.6084/m9.figshare.766363
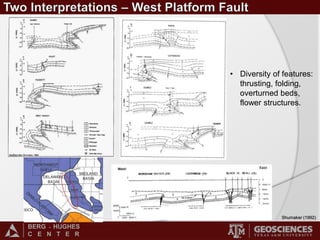
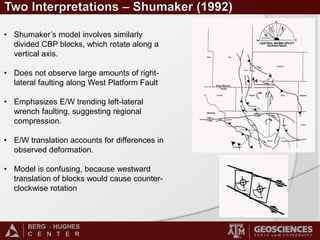
Shumaker, R. (1992). Paleozoic structure of the Central Basin uplift and the adjacent Delaware Basin, West Texas. AAPG Bulletin, 76(11), 1804-1824.
Retrieved from http://aapgbull.geoscienceworld.org/content/76/11/1804
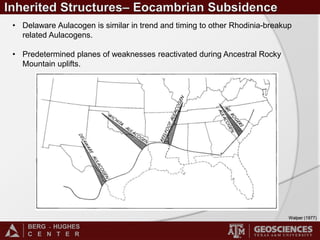
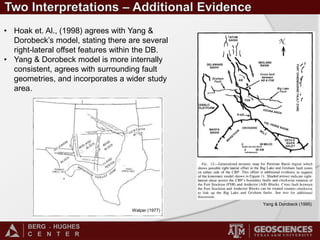
Walper, J. L., (1977), Paleozoic tectonics of the southern margin of North America: Gulf Coast Association of Geological Societies Transactions, v. 27, p.
230–239.
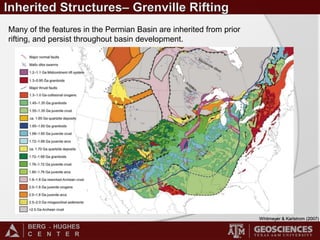
Whitmeyer, S. J., & Karlstrom, K. E. (2007). Tectonic model for the Proterozoic growth of North America. Geosphere, 3(4), 220-259.
doi:10.1130/ges00055.1
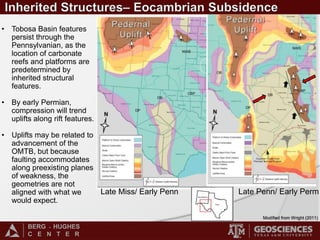
Wright, W. (2011). Pennsylvanian paleodepositional evolution of the greater Permian Basin, Texas and New Mexico: Depositional systems and
hydrocarbon reservoir analysis. AAPG Bulletin, 95(9), 1525-1555. doi:10.1306/01031110127
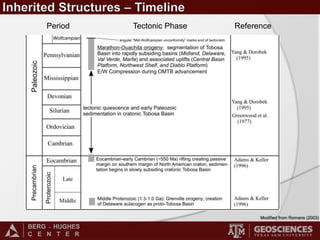
Yang, K. & Dorobek, S. (1995) The Permian Basin of West Texas and New Mexico: tectonic history of a “composite” foreland basin and its effects on
stratigraphic development, in Dorobek, S. L., and Ross, G. M., eds., Stratigraphic evolution of foreland basins: SEPM (Society for Sedimentary Geology), v.
52, p. 149–174.
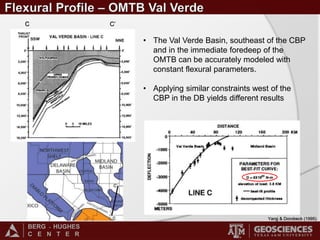
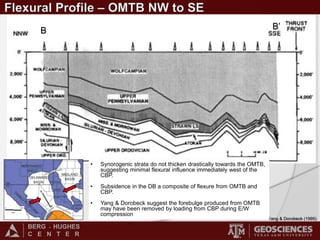
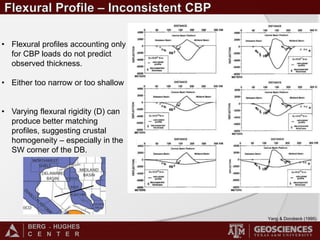
Yang, K. & Dorobek, S. (1995). The Permian Basin of West Texas and New Mexico: Flexural Modeling and Evidence for Lithospheric Heterogeneity Across
the Marathon Foreland. Special Publications Of SEPM. Retrieved from
http://archives.datapages.com/data/sepm_sp/SP52/The_Permian_Basin_of_West_Texas.htm](https://image.slidesharecdn.com/8f01d04c-08b3-4cdc-9b8d-38cf4134b22b-161215232910/85/Delaware-Basin-Structural-Relationships_Manos-21-320.jpg)


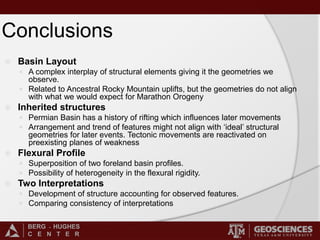
The document summarizes the structural geology and tectonic development of the Delaware Basin and Central Basin Platform in West Texas and Southeastern New Mexico. It finds that the basins have a complex structure influenced by inherited rifting from 1.3-1.1 billion years ago. Movements during the Ancestral Rocky Mountains uplifts were accommodated along these preexisting weaknesses, resulting in geometries that do not align with expected patterns. Flexural subsidence in the Delaware Basin represents a superposition of profiles from the Central Basin Platform and Ouachita Mountains thrust belt. Interpretations of the basin's structure account for observed features and compare consistency.


