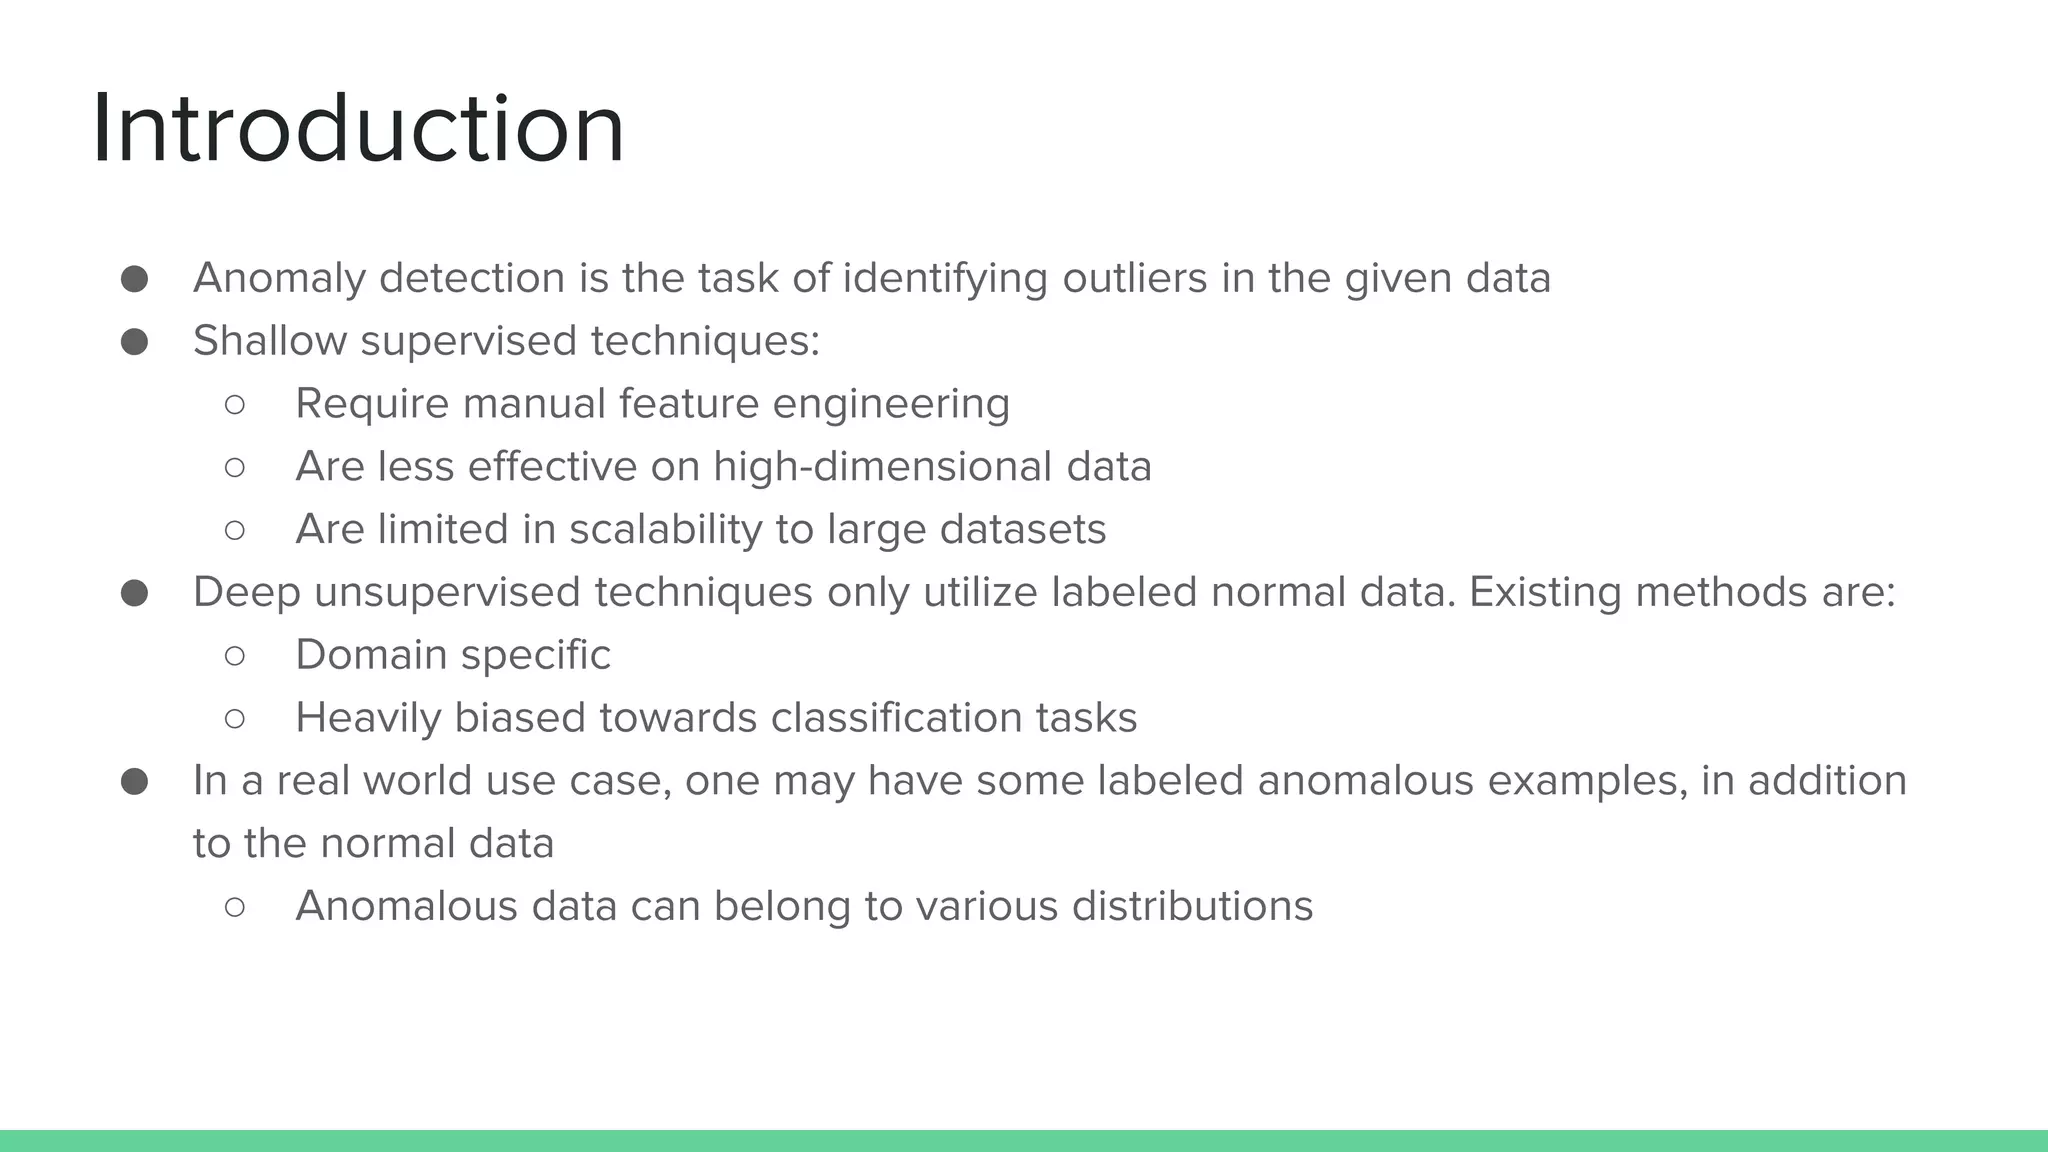
Deep Semi-Supervised Anomaly
Detection (DeepSAD)
By Manmeet Singh
Original paper by Ruff, et al. [1]
Introduction
● Anomaly detection is the task of identifying outliers in the given data
● Shallow supervised techniques:
○ Require manual feature engineering
○ Are less effective on high-dimensional data
○ Are limited in scalability to large datasets
● Deep unsupervised techniques only utilize labeled normal data. Existing methods are:
○ Domain specific
○ Heavily biased towards classification tasks
● In a real world use case, one may have some labeled anomalous examples, in addition
to the normal data
○ Anomalous data can belong to various distributions
Existing
Techniques
● Training data consists of:
○ labeled
○ unlabeled data
○ labeled anomalies
● Contour maps represents
gradient of what each algorithm
learned as the representation
of normal data
● Semi-supervised anomaly
detection defines a much more
crisp boundary around normal
data distributions
Information Theory Context
Supervised deep learning minimizes mutual information between input (X) and
latent representation (Z), while maximizing it between latent representation and the
classification task (Y).
The objective of unsupervised learning, based on the infomax principle, is to
maximize mutual information between the input (X) and its latent representation (Z)
Choices for regularization (R) include sparsity or distance to prior distribution (KL divergence), or dimensionality
constraints.
(1)
(2)
Unsupervised
Deep SVDD
Precursor to Deep SAD
● Includes label information Y
through regularization objective
R(Z) = R(Z; Y ) that is based on
entropy
● Using MSE forces the network
to extract those common
factors of variation which are
most stable within the dataset
● In probabilistic terms, this is
entropy minimization over
latent distribution
(3)
DeepSAD ● η (eta) is hyperparameter controlling the amount
of emphasis placed on labeled vs unlabeled
data
● Parameter m represents labeled samples, in
addition to n unlabeled samples seen in Deep
SVDD
● Unlabeled loss and regualizer expressions are
same as Deep SVDD.
○ New addition is the middle term
● Deep SAD overall follows the same process as
Deep SVDD, but by replicating the expression
used for unlabeled data and modifying it for
labeled data
● This method does not impose any cluster
assumption on the anomaly-generating
distribution
○ Normal and anomalous distributions are
learned
Benchmarks
● Datasets: MNIST, Fashion-MNIST,
CIFAR-10
● Test setup: For multi-class datasets
use one class as “normal” and rest
as anomalous
● 3 scenarios for performance
comparison
1. Ratio of labeled anomalies to
unlabeled anomalies
Results: Deep SAD (pink color)
generalizes better as more labeled
anomalies are presented for
training
Benchmarks cont.
2. Ratio of pollution (outlier types) in
the unlabeled training data
Results: Performance of all methods
decreases with increasing data pollution.
Deep SAD proves to be most robust
3. Number of anomaly classes
included in the training data
Results: As the number of anomaly
classes increases, Deep SAD performs
better
Inter-class sensitivity analysis
● The hyperparameter eta was varied
from {10^-2, … , 10^2} to analyze
sensitivity of Deep SAD with respect
to hyperparameter eta.
● Eta tunes the weight of labeled vs.
unlabeled training data distribution for
the model (see Eqn. 4).
○ Setting > 1 puts more emphasis on the labeled data
whereas < 1 emphasizes the unlabeled data
● Overall, the loss function is fairly
robust to increments in labeled data
Conclusion and Future Work
● Supervised methods still perform better with small datasets but Deep SAD is competitive
○ Better in large datasets with multiple anomalous distributions
● Deep SAD is not domain or problem specific
○ It is a generalization of unsupervised Deep SVDD method
● General semi-supervised anomaly detection should be preferred whenever some
labeled information on both normal and anomalies samples is available
● Potential future works can include more rigorous analysis and studying deep anomaly
detection under rate distortion curve, for example.
Thank you
References
[1] Lukas Ruff, et al. "Deep Semi-Supervised Anomaly Detection." International
Conference on Learning Representations.
[2] Lukas Ruff, Robert A Vandermeulen, Nico Görnitz, Lucas Deecke, Shoaib A Siddiqui,
Alexander Binder, Emmanuel Müller, and Marius Kloft. Deep one-class classification. In
ICML, volume 80, pp. 4390–4399, 2018.

Deep Semi-Supervised Anomaly Detection

  • 1.
    Deep Semi-Supervised Anomaly Detection(DeepSAD) By Manmeet Singh Original paper by Ruff, et al. [1]
  • 2.
    Introduction ● Anomaly detectionis the task of identifying outliers in the given data ● Shallow supervised techniques: ○ Require manual feature engineering ○ Are less effective on high-dimensional data ○ Are limited in scalability to large datasets ● Deep unsupervised techniques only utilize labeled normal data. Existing methods are: ○ Domain specific ○ Heavily biased towards classification tasks ● In a real world use case, one may have some labeled anomalous examples, in addition to the normal data ○ Anomalous data can belong to various distributions
  • 3.
    Existing Techniques ● Training dataconsists of: ○ labeled ○ unlabeled data ○ labeled anomalies ● Contour maps represents gradient of what each algorithm learned as the representation of normal data ● Semi-supervised anomaly detection defines a much more crisp boundary around normal data distributions
  • 4.
    Information Theory Context Superviseddeep learning minimizes mutual information between input (X) and latent representation (Z), while maximizing it between latent representation and the classification task (Y). The objective of unsupervised learning, based on the infomax principle, is to maximize mutual information between the input (X) and its latent representation (Z) Choices for regularization (R) include sparsity or distance to prior distribution (KL divergence), or dimensionality constraints. (1) (2)
  • 5.
    Unsupervised Deep SVDD Precursor toDeep SAD ● Includes label information Y through regularization objective R(Z) = R(Z; Y ) that is based on entropy ● Using MSE forces the network to extract those common factors of variation which are most stable within the dataset ● In probabilistic terms, this is entropy minimization over latent distribution (3)
  • 6.
    DeepSAD ● η(eta) is hyperparameter controlling the amount of emphasis placed on labeled vs unlabeled data ● Parameter m represents labeled samples, in addition to n unlabeled samples seen in Deep SVDD ● Unlabeled loss and regualizer expressions are same as Deep SVDD. ○ New addition is the middle term ● Deep SAD overall follows the same process as Deep SVDD, but by replicating the expression used for unlabeled data and modifying it for labeled data ● This method does not impose any cluster assumption on the anomaly-generating distribution ○ Normal and anomalous distributions are learned
  • 7.
    Benchmarks ● Datasets: MNIST,Fashion-MNIST, CIFAR-10 ● Test setup: For multi-class datasets use one class as “normal” and rest as anomalous ● 3 scenarios for performance comparison 1. Ratio of labeled anomalies to unlabeled anomalies Results: Deep SAD (pink color) generalizes better as more labeled anomalies are presented for training
  • 8.
    Benchmarks cont. 2. Ratioof pollution (outlier types) in the unlabeled training data Results: Performance of all methods decreases with increasing data pollution. Deep SAD proves to be most robust 3. Number of anomaly classes included in the training data Results: As the number of anomaly classes increases, Deep SAD performs better
  • 9.
    Inter-class sensitivity analysis ●The hyperparameter eta was varied from {10^-2, … , 10^2} to analyze sensitivity of Deep SAD with respect to hyperparameter eta. ● Eta tunes the weight of labeled vs. unlabeled training data distribution for the model (see Eqn. 4). ○ Setting > 1 puts more emphasis on the labeled data whereas < 1 emphasizes the unlabeled data ● Overall, the loss function is fairly robust to increments in labeled data
  • 10.
    Conclusion and FutureWork ● Supervised methods still perform better with small datasets but Deep SAD is competitive ○ Better in large datasets with multiple anomalous distributions ● Deep SAD is not domain or problem specific ○ It is a generalization of unsupervised Deep SVDD method ● General semi-supervised anomaly detection should be preferred whenever some labeled information on both normal and anomalies samples is available ● Potential future works can include more rigorous analysis and studying deep anomaly detection under rate distortion curve, for example.
  • 11.
  • 12.
    References [1] Lukas Ruff,et al. "Deep Semi-Supervised Anomaly Detection." International Conference on Learning Representations. [2] Lukas Ruff, Robert A Vandermeulen, Nico Görnitz, Lucas Deecke, Shoaib A Siddiqui, Alexander Binder, Emmanuel Müller, and Marius Kloft. Deep one-class classification. In ICML, volume 80, pp. 4390–4399, 2018.

Editor's Notes

  • #5 Supervised learning: Alpha > 0 controlling trade-off b/w compression/complexity and classification accuracy Unsupervised learning: Beta is regularization hyperparameter on latent representation Goal for unsupervised AD regularization is to create compact latent representation of normal data
  • #6 SVDD -
  • #7 Deep SAD objective as modeling the latent distribution of normal data, Z+ = Z|{Y =+1}, to have low entropy, and the latent distribution of anomalies, Z- = Z|{Y =-1}, to have high entropy. Minimizing the distances to the center c (i.e., minimizing the empirical variance) for the mapped points of labeled normal samples (y=bar = +1) induces a latent distribution with low entropy for the normal data. In contrast, penalizing low variance via the inverse squared norm loss for the mapped points of labeled anomalies (y-bar = -1) induces a latent distribution with high entropy for the anomalous data. That is, the network must attempt to map known anomalies to some heavy-tailed distribution.
  • #8 Scenarios: Ratio of labeled anomalies to unlabeled anomalies to be detected by the NN where this loss function is deployed Pollion consists of unknown anomalies
  • #9 Star on the graphs indicates statistically significant