Sleep specialists often conduct manual sleep stage scoring by visually inspecting the patient’s neurophysiological signals collected at sleep labs. This is a difficult, tedious and a time-consuming task. The limitations of manual sleep stage scoring have escalated the demand for developing Automatic Sleep Stage Classification (ASSC)
systems. Sleep stage classification refers to identifying the various stages of sleep and is a critical step in an effort to assist physicians in the diagnosis and treatment of related sleep disorders. In this paper, we propose a novel method and a practical approach to predicting early onsets of sleep syndromes utilizing the Twin Convolutional Model FTC2, including restless leg syndrome, insomnia, based on an algorithm which is comprised of two modules. A Fast Fourier Transform is applied to 30 seconds long epochs of EEG recordings to provide localized time-frequency information, and a deep convolutional LSTM neural network is trained for sleep stage classification. Automating sleep
stages detection from EEG data offers a great potential to tackling sleep irregularities on a daily basis. Thereby, a novel approach for sleep stage classification is proposed which combines the best of signal processing and statistics.
Computer Aided Detection of Obstructive Sleep Apnea from EEG Signalssipij
Sleep Apnea is an anomaly in sleeping characterized by short pause in breathing. Failure to treat sleep
apnea leads to fatal complications in both psychological and physiological being of human.
Electroencephalogram (EEG) performs an important task in probing for sleep apnea through identifying
and recording the brain’s activities while sleeping. In this study, computer aided detection of sleep apnea
from EEG signals is developed to optimize and increase the prompt recognition and diagnosis of sleep
apnea in patients. The time domain, wavelets, and frequency domain of the EEG signals were computed,
and features were extracted from these domains. These features are inputted into two machine learning
algorithms: Support Vector Machine and K-Nearest Neighbors of different kernel functions and orders.
Evaluation metrics such as specificity, accuracy, and sensitivity are computed and analyzed for the
classifiers. The KNN classifier outperforms the SVM in classifying apnea from non-apnea events in
patients. The KNN order 3 shows the highest performance sensitivity of 85.92%, specificity of 80% and
accuracy of 82.69%.
I prepared this content when i was in post graduation, i gone through with lot of website to make this content may this content will help to others i hope so...
Sleep Apnea Identification using HRV Features of ECG Signals IJECEIAES
Sleep apnea is a common sleep disorder that interferes with the breathing of a person. During sleep, people can stop breathing for a moment that causes the body lack of oxygen that lasts for several seconds to minutes even until the range of hours. If it happens for a long period, it can result in more serious diseases, e.g. high blood pressure, heart failure, stroke, diabetes, etc. Sleep apnea can be prevented by identifying the indication of sleep apnea itself from ECG, EEG, or other signals to perform early prevention. The purpose of this study is to build a classification model to identify sleep disorders from the Heart Rate Variability (HRV) features that can be obtained with Electrocardiogram (ECG) signals. In this study, HRV features were processed using several classification methods, i.e. ANN, KNN, N-Bayes and SVM linear Methods. The classification is performed using subjectspecific scheme and subject-independent scheme. The simulation results show that the SVM method achieves higher accuracy other than three other methods in identifying sleep apnea. While, time domain features shows the most dominant performance among the HRV features.
Design and development of a method for detecting sleep roll-over counts usin...IJECEIAES
Sleep plays an important role as it helps human body to rejuvenate, boosts mental function and manage stress. Sleep is restorative function which enhances muscle growth, repairs tissues, maintains health and make physical appearance look or feel better. The lack of sleep in human body can increase the risk of diseases which are asthma, diabetes, depression. For healthy physiological function, sleep is essential and has strong relation to mental condition. Easy way of sleep management is considered for maintaining good mental health. Numerous scientists, doctors and researchers have proposed various ways to monitor sleep, some of those best tests are polysomnography test and actigraphy test. However, taking sleep test covering the whole body with wires and electrodes which is polysomnography test is uncomfortable for patients, and sensors used for different approaches like this are costly and often require overnight treatment and expert monitoring in clinics. Therefore, easy way of detecting roll-over movements which is convenient for patients to wear is proposed. Accelerometer ADXL335 sensor is taped on socks during sleep which is comfortable for patients to wear and do not cause any inconvenience during sleep. Algorithm is proposed to read the dataset and count the roll-over during the sleep based on threshold. Resulting the number of roll-over detected during a sleep period.
Feature Extraction Techniques and Classification Algorithms for EEG Signals t...Editor IJCATR
EEG (Electroencephalogram) signal is a neuro signal which is generated due the different electrical activities in the brain.
Different types of electrical activities correspond to different states of the brain. Every physical activity of a person is due to some
activity in the brain which in turn generates an electrical signal. These signals can be captured and processed to get the useful information
that can be used in early detection of some mental diseases. This paper focus on the usefulness of EGG signal in detecting the human
stress levels. It also includes the comparison of various preprocessing algorithms ( DCT and DWT.) and various classification algorithms
(LDA, Naive Bayes and ANN.). The paper proposes a system which will process the EEG signal and by applying the combination of
classifiers, will detect the human stress levels.
About
Indigenized remote control interface card suitable for MAFI system CCR equipment. Compatible for IDM8000 CCR. Backplane mounted serial and TCP/Ethernet communication module for CCR remote access. IDM 8000 CCR remote control on serial and TCP protocol.
• Remote control: Parallel or serial interface.
• Compatible with MAFI CCR system.
• Compatible with IDM8000 CCR.
• Compatible with Backplane mount serial communication.
• Compatible with commercial and Defence aviation CCR system.
• Remote control system for accessing CCR and allied system over serial or TCP.
• Indigenized local Support/presence in India.
• Easy in configuration using DIP switches.
Technical Specifications
Indigenized remote control interface card suitable for MAFI system CCR equipment. Compatible for IDM8000 CCR. Backplane mounted serial and TCP/Ethernet communication module for CCR remote access. IDM 8000 CCR remote control on serial and TCP protocol.
Key Features
Indigenized remote control interface card suitable for MAFI system CCR equipment. Compatible for IDM8000 CCR. Backplane mounted serial and TCP/Ethernet communication module for CCR remote access. IDM 8000 CCR remote control on serial and TCP protocol.
• Remote control: Parallel or serial interface
• Compatible with MAFI CCR system
• Copatiable with IDM8000 CCR
• Compatible with Backplane mount serial communication.
• Compatible with commercial and Defence aviation CCR system.
• Remote control system for accessing CCR and allied system over serial or TCP.
• Indigenized local Support/presence in India.
Application
• Remote control: Parallel or serial interface.
• Compatible with MAFI CCR system.
• Compatible with IDM8000 CCR.
• Compatible with Backplane mount serial communication.
• Compatible with commercial and Defence aviation CCR system.
• Remote control system for accessing CCR and allied system over serial or TCP.
• Indigenized local Support/presence in India.
• Easy in configuration using DIP switches.
More Related Content
Similar to Deep Learning Analysis for Estimating Sleep Syndrome Detection Utilizing the Twin Convolutional Model FTC2
I prepared this content when i was in post graduation, i gone through with lot of website to make this content may this content will help to others i hope so...
Sleep Apnea Identification using HRV Features of ECG Signals IJECEIAES
Sleep apnea is a common sleep disorder that interferes with the breathing of a person. During sleep, people can stop breathing for a moment that causes the body lack of oxygen that lasts for several seconds to minutes even until the range of hours. If it happens for a long period, it can result in more serious diseases, e.g. high blood pressure, heart failure, stroke, diabetes, etc. Sleep apnea can be prevented by identifying the indication of sleep apnea itself from ECG, EEG, or other signals to perform early prevention. The purpose of this study is to build a classification model to identify sleep disorders from the Heart Rate Variability (HRV) features that can be obtained with Electrocardiogram (ECG) signals. In this study, HRV features were processed using several classification methods, i.e. ANN, KNN, N-Bayes and SVM linear Methods. The classification is performed using subjectspecific scheme and subject-independent scheme. The simulation results show that the SVM method achieves higher accuracy other than three other methods in identifying sleep apnea. While, time domain features shows the most dominant performance among the HRV features.
Design and development of a method for detecting sleep roll-over counts usin...IJECEIAES
Sleep plays an important role as it helps human body to rejuvenate, boosts mental function and manage stress. Sleep is restorative function which enhances muscle growth, repairs tissues, maintains health and make physical appearance look or feel better. The lack of sleep in human body can increase the risk of diseases which are asthma, diabetes, depression. For healthy physiological function, sleep is essential and has strong relation to mental condition. Easy way of sleep management is considered for maintaining good mental health. Numerous scientists, doctors and researchers have proposed various ways to monitor sleep, some of those best tests are polysomnography test and actigraphy test. However, taking sleep test covering the whole body with wires and electrodes which is polysomnography test is uncomfortable for patients, and sensors used for different approaches like this are costly and often require overnight treatment and expert monitoring in clinics. Therefore, easy way of detecting roll-over movements which is convenient for patients to wear is proposed. Accelerometer ADXL335 sensor is taped on socks during sleep which is comfortable for patients to wear and do not cause any inconvenience during sleep. Algorithm is proposed to read the dataset and count the roll-over during the sleep based on threshold. Resulting the number of roll-over detected during a sleep period.
Feature Extraction Techniques and Classification Algorithms for EEG Signals t...Editor IJCATR
EEG (Electroencephalogram) signal is a neuro signal which is generated due the different electrical activities in the brain.
Different types of electrical activities correspond to different states of the brain. Every physical activity of a person is due to some
activity in the brain which in turn generates an electrical signal. These signals can be captured and processed to get the useful information
that can be used in early detection of some mental diseases. This paper focus on the usefulness of EGG signal in detecting the human
stress levels. It also includes the comparison of various preprocessing algorithms ( DCT and DWT.) and various classification algorithms
(LDA, Naive Bayes and ANN.). The paper proposes a system which will process the EEG signal and by applying the combination of
classifiers, will detect the human stress levels.
About
Indigenized remote control interface card suitable for MAFI system CCR equipment. Compatible for IDM8000 CCR. Backplane mounted serial and TCP/Ethernet communication module for CCR remote access. IDM 8000 CCR remote control on serial and TCP protocol.
• Remote control: Parallel or serial interface.
• Compatible with MAFI CCR system.
• Compatible with IDM8000 CCR.
• Compatible with Backplane mount serial communication.
• Compatible with commercial and Defence aviation CCR system.
• Remote control system for accessing CCR and allied system over serial or TCP.
• Indigenized local Support/presence in India.
• Easy in configuration using DIP switches.
Technical Specifications
Indigenized remote control interface card suitable for MAFI system CCR equipment. Compatible for IDM8000 CCR. Backplane mounted serial and TCP/Ethernet communication module for CCR remote access. IDM 8000 CCR remote control on serial and TCP protocol.
Key Features
Indigenized remote control interface card suitable for MAFI system CCR equipment. Compatible for IDM8000 CCR. Backplane mounted serial and TCP/Ethernet communication module for CCR remote access. IDM 8000 CCR remote control on serial and TCP protocol.
• Remote control: Parallel or serial interface
• Compatible with MAFI CCR system
• Copatiable with IDM8000 CCR
• Compatible with Backplane mount serial communication.
• Compatible with commercial and Defence aviation CCR system.
• Remote control system for accessing CCR and allied system over serial or TCP.
• Indigenized local Support/presence in India.
Application
• Remote control: Parallel or serial interface.
• Compatible with MAFI CCR system.
• Compatible with IDM8000 CCR.
• Compatible with Backplane mount serial communication.
• Compatible with commercial and Defence aviation CCR system.
• Remote control system for accessing CCR and allied system over serial or TCP.
• Indigenized local Support/presence in India.
• Easy in configuration using DIP switches.
Immunizing Image Classifiers Against Localized Adversary Attacksgerogepatton
This paper addresses the vulnerability of deep learning models, particularly convolutional neural networks
(CNN)s, to adversarial attacks and presents a proactive training technique designed to counter them. We
introduce a novel volumization algorithm, which transforms 2D images into 3D volumetric representations.
When combined with 3D convolution and deep curriculum learning optimization (CLO), itsignificantly improves
the immunity of models against localized universal attacks by up to 40%. We evaluate our proposed approach
using contemporary CNN architectures and the modified Canadian Institute for Advanced Research (CIFAR-10
and CIFAR-100) and ImageNet Large Scale Visual Recognition Challenge (ILSVRC12) datasets, showcasing
accuracy improvements over previous techniques. The results indicate that the combination of the volumetric
input and curriculum learning holds significant promise for mitigating adversarial attacks without necessitating
adversary training.
Saudi Arabia stands as a titan in the global energy landscape, renowned for its abundant oil and gas resources. It's the largest exporter of petroleum and holds some of the world's most significant reserves. Let's delve into the top 10 oil and gas projects shaping Saudi Arabia's energy future in 2024.
Student information management system project report ii.pdfKamal Acharya
Our project explains about the student management. This project mainly explains the various actions related to student details. This project shows some ease in adding, editing and deleting the student details. It also provides a less time consuming process for viewing, adding, editing and deleting the marks of the students.
NO1 Uk best vashikaran specialist in delhi vashikaran baba near me online vas...Amil Baba Dawood bangali
Contact with Dawood Bhai Just call on +92322-6382012 and we'll help you. We'll solve all your problems within 12 to 24 hours and with 101% guarantee and with astrology systematic. If you want to take any personal or professional advice then also you can call us on +92322-6382012 , ONLINE LOVE PROBLEM & Other all types of Daily Life Problem's.Then CALL or WHATSAPP us on +92322-6382012 and Get all these problems solutions here by Amil Baba DAWOOD BANGALI
#vashikaranspecialist #astrologer #palmistry #amliyaat #taweez #manpasandshadi #horoscope #spiritual #lovelife #lovespell #marriagespell#aamilbabainpakistan #amilbabainkarachi #powerfullblackmagicspell #kalajadumantarspecialist #realamilbaba #AmilbabainPakistan #astrologerincanada #astrologerindubai #lovespellsmaster #kalajaduspecialist #lovespellsthatwork #aamilbabainlahore#blackmagicformarriage #aamilbaba #kalajadu #kalailam #taweez #wazifaexpert #jadumantar #vashikaranspecialist #astrologer #palmistry #amliyaat #taweez #manpasandshadi #horoscope #spiritual #lovelife #lovespell #marriagespell#aamilbabainpakistan #amilbabainkarachi #powerfullblackmagicspell #kalajadumantarspecialist #realamilbaba #AmilbabainPakistan #astrologerincanada #astrologerindubai #lovespellsmaster #kalajaduspecialist #lovespellsthatwork #aamilbabainlahore #blackmagicforlove #blackmagicformarriage #aamilbaba #kalajadu #kalailam #taweez #wazifaexpert #jadumantar #vashikaranspecialist #astrologer #palmistry #amliyaat #taweez #manpasandshadi #horoscope #spiritual #lovelife #lovespell #marriagespell#aamilbabainpakistan #amilbabainkarachi #powerfullblackmagicspell #kalajadumantarspecialist #realamilbaba #AmilbabainPakistan #astrologerincanada #astrologerindubai #lovespellsmaster #kalajaduspecialist #lovespellsthatwork #aamilbabainlahore #Amilbabainuk #amilbabainspain #amilbabaindubai #Amilbabainnorway #amilbabainkrachi #amilbabainlahore #amilbabaingujranwalan #amilbabainislamabad
Industrial Training at Shahjalal Fertilizer Company Limited (SFCL)MdTanvirMahtab2
This presentation is about the working procedure of Shahjalal Fertilizer Company Limited (SFCL). A Govt. owned Company of Bangladesh Chemical Industries Corporation under Ministry of Industries.
Cosmetic shop management system project report.pdfKamal Acharya
Buying new cosmetic products is difficult. It can even be scary for those who have sensitive skin and are prone to skin trouble. The information needed to alleviate this problem is on the back of each product, but it's thought to interpret those ingredient lists unless you have a background in chemistry.
Instead of buying and hoping for the best, we can use data science to help us predict which products may be good fits for us. It includes various function programs to do the above mentioned tasks.
Data file handling has been effectively used in the program.
The automated cosmetic shop management system should deal with the automation of general workflow and administration process of the shop. The main processes of the system focus on customer's request where the system is able to search the most appropriate products and deliver it to the customers. It should help the employees to quickly identify the list of cosmetic product that have reached the minimum quantity and also keep a track of expired date for each cosmetic product. It should help the employees to find the rack number in which the product is placed.It is also Faster and more efficient way.
Democratizing Fuzzing at Scale by Abhishek Aryaabh.arya
Presented at NUS: Fuzzing and Software Security Summer School 2024
This keynote talks about the democratization of fuzzing at scale, highlighting the collaboration between open source communities, academia, and industry to advance the field of fuzzing. It delves into the history of fuzzing, the development of scalable fuzzing platforms, and the empowerment of community-driven research. The talk will further discuss recent advancements leveraging AI/ML and offer insights into the future evolution of the fuzzing landscape.
Deep Learning Analysis for Estimating Sleep Syndrome Detection Utilizing the Twin Convolutional Model FTC2
1. BOHR International Journal of Future Robotics and Artificial Intelligence
2022, Vol. 1, No. 1, pp. 11–17
https://doi.org/10.54646/bijfrai.002
www.bohrpub.com
Deep Learning Analysis for Estimating Sleep Syndrome Detection
Utilizing the Twin Convolutional Model FTC2
Tim Cvetko and Tinkara Robek
Gimnazija Brešice, Brežice, Slovenia
E-mail: cvetko.tim@gmail.com; tinkara.robek@gmail.com
Abstract. Sleep specialists often conduct manual sleep stage scoring by visually inspecting the patient’s neurophys-
iological signals collected at sleep labs. This is a difficult, tedious and a time-consuming task. The limitations of
manual sleep stage scoring have escalated the demand for developing Automatic Sleep Stage Classification (ASSC)
systems. Sleep stage classification refers to identifying the various stages of sleep and is a critical step in an effort to
assist physicians in the diagnosis and treatment of related sleep disorders. In this paper, we propose a novel method
and a practical approach to predicting early onsets of sleep syndromes utilizing the Twin Convolutional Model
FTC2, including restless leg syndrome, insomnia, based on an algorithm which is comprised of two modules. A Fast
Fourier Transform is applied to 30 seconds long epochs of EEG recordings to provide localized time-frequency infor-
mation, and a deep convolutional LSTM neural network is trained for sleep stage classification. Automating sleep
stages detection from EEG data offers a great potential to tackling sleep irregularities on a daily basis. Thereby, a
novel approach for sleep stage classification is proposed which combines the best of signal processing and statistics.
In this study, we used the PhysioNet Sleep European Data Format (EDF) Database. The code evaluation showed
impressive results, reaching accuracy of 90.43, precision of 77.76, recall of 93,32, F1-score of 89.12 with the final mean
false error loss 0.09. All the source code is availlable at https://github.com/timothy102/eeg.
Keywords: Sleep stage classification, algorithm design, onset detection, convolutional neural networks, signal pro-
cessing, recurrent neural networks, fourier transform, CEEMDAN, preprocessing.
1 Introduction
Sleep stage classification is crucial for our day-to-day
functioning and disease prevention, such as obesity, type
2 diabetes, and different psychiatric disorders that may
develop in association with the shortage of sleep. Main-
taining a healthy sleep schedule is significant for obtain-
ing our natural circadian rhythm and the normal course
of sleep. This must include REM (rapid-eye movement)
and non-REM phases. NREM is specified by slow-wave
activity (delta power). REM phase is characterized by the
eye movements which we track with EOG (electroocu-
logram), low muscle tone which we track with EMG
(electromyogram), low amplitude waves, and generally
mixed frequency EEG (electroencephalogram). It is also
a stage where dreams occur. The brain is as active dur-
ing REM as during wakefulness, only in different parts
(correspondingly, the prefrontal cortex, responsible for
judgment and decision making is deactivated during both
phases). The REM state is initialized by the neurons located
in the brainstem. The process of recording sleep in the
laboratories for the purposes of examining its structure
(mainly in terms of slow-wave activity) is known as
polysomnography. Polysomnograms can show the diag-
nostics of various dis-orders during sleep. They are com-
monly used for identifying disorders such as obstructive
sleep apnea, excessive daytime sleepiness, and insomnia.
Polysomnograms record numerous types of information:
EEG (electroencephalogram; for recording brain waves),
EOG (electrooculogram; for recording eye movements),
EMG (electromyogram; recording of the electrical activity
of muscle surfaces), EKG (electrocardiogram). Combining
the gathered data allows us to identify the individual’s
stage of sleep. For the purposes of recognizing sleep apnea,
it is also required to record snoring, nasal and oral airflow,
movement of the abdomen and chest, and pulse oxime-
try. There are multiple types of waves measured in EEG
11
2. 12 Tim Cvetko and Tinkara Robek
which tell whether the person is asleep or awake and what
stage they are in. Alpha activity (frequency: 8–13 Hz) is
present in the occipital cortex when a person is resting with
their eyes closed and goes away when they wake up or
fall asleep. Theta activity (4–7 Hz) is the most common fre-
quency during sleep. Delta activity is known as slow-wave
activity (0,5–2/4 Hz) with higher amplitudes and is mostly
present in the frontal areas of the cortex. Sleep spindles (11–
16 Hz) normally indicate stage 2 of NREM sleep, with a
duration of 2–3 seconds. K complexes are most common in
stage 2 of NREM Their amplitude is not specified, while
the time span must be at least 0.5 seconds. Sleep stages are
regulated by individual neurotransmitters.
Wakefulness is a heterogeneous state, maintained
by neurotransmitters acetylcholine, serotonin, nore-
pinephrine, histamine, dopamine, hypocretin, and gluta-
mate. NREM is initialized by GABA and adenosine, while
acetylcholine also sends signals for REM onset. Interac-
tions between neurotransmitters determine behavioral
states at any given time. During sleep, they define muscle
tone, eye movements and EEG activity. The same neuro-
transmitter can have opposite effects during wakefulness
and sleep and in different brain regions. The preoptic area
of the brain (anterior hypothalamus) is known to act as a
sleep center, while the posterior hypothalamus acts as a
wakefulness center. Electrical stimulation of the preoptic
area, therefore, has the ability to initiate sleep. Apart from
the objective reasons for not sleeping long enough (the rec-
ommended 8 hours, for obtaining full sleep cycles), there
are also multiple sleeping disorders present in today’s soci-
ety. Sleeping disorder is usually a composition of multiple
neurological modifications that may be caused by external
or internal factors. These factors include our lifestyle,
genetics, associated diseases, psychiatric disorders, and so
on. Disordered sleeping is alarmingly common in modern
society. In the field of various disorders, the most common
persist to stay the following: insomnia, sleep-disordered
breathing (obstructive sleep apnea, hyper-ventilation),
central disorders of hypersomnolence (narcolepsy, idio-
pathic hypersomnia, Kleine-Levin Syndrome), circadian
rhythm disorders, parasomnias (sleepwalking, terrors,
sleep eating disorders, sleep enuresis) and sleep-related
movement disorders (restless leg syndrome, periodic limb
movement disorder). Insomnia and other disorders that
result in trouble sleeping are often associated with mul-
tiple chronic health conditions. They have an impact on
blood pressure and blood sugar levels, therefore they put
us at risk of coronary diseases and metabolic imbalances.
Middle-aged/older parts of the population and obese
individuals are at grater risk of developing these issues. In
addition, sex also plays a role in developing some sleeping
disorders – males are more likely to develop obstructive
sleep apnea, while women are predisposed to insomnia.
The first step for identifying problems with sleep is by
clinical approach with ESS (Epworth Sleepiness Scale) [1].
Insomnia can arise as chronic insomnia or in a short-term
form. Its typical symptoms are problems initiating or
maintaining sleep, non-restorative sleep, and waking too
early which result in daily distress. These issues occur due
to the brain’s arousal systems which are not turning off.
It is diagnosed in a laboratory with polysomnography.
It can be a cause for endothelial dysfunction, oxidative
stress, inflammation, hypertension, and even stroke in
severe cases. Normally, it is treated with CPAP (continuous
positive airway pressure).
We intend to use these findings along with the FTC2
model for sleep staging predictions to predict onset of
sleep syndromes. We firmly believe these methods strongly
correlate to the modern sleep issues thus enhancing the
medical procedure and diagnosis.
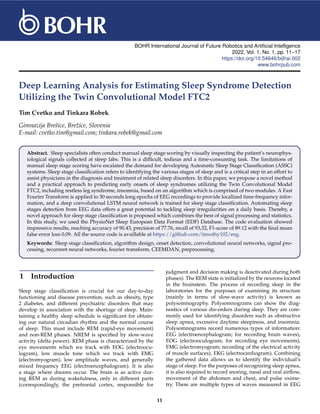
2 Methodology
For the purpose of this paper, we have used the following
methods: Ceemdan, Fast Fourier Transform, Convolutional
Neural Networks, LSTM (Long Short-Term Networks),
Savitzky-Golay filter, Welch Power Spectrum.
2.1 Event Detection During Sleep
Although detecting periods of raised or lowered activity
during sleep is an appealing task, it is rather interesting to
detect transient, short signals. Furthermore, during sleep
we can for example detect events like QRS complexes in
the ECG or EEG events like slow waves (single waves of
about 0.5 to 2 Hz which have a high amplitude of about
75 uV), sleep spindles (transient waxing and waning events
of about 0.5 to 2 seconds duration and 15 to 50 uV maxi-
mal amplitude). For the sake of this research and simplicity
we do not make any distinction between slow-waves, K-
complexes or slow oscillations but lump them all together.
2.2 Detailed Description of the Methodology
2.2.1 CEEMDAN preprocessing
For the preprocessing part, we took advantage of the
complete ensemble empirical mode decomposition with
adaptive noise (CEEMDAN) as a noise assisted EMD tech-
nique. Several signal processing methods have been devel-
oped in recent years. The traditional signal processing
method is based on the Fast Fourier Transform. How-
ever, this method alone cannot obtain the time-domain and
frequency-domain analyzed results simultaneously. Many
time-frequency analysis methods have been applied to
diagnoses for vibration signals, such as the Wigner-Ville
distribution (WWD) as proposed in [2]. This algorithm suc-
cessively computes the analytic signal corresponding to the
input signal, forms a weighted kernel function, and ana-
lyzes the kernel via a discrete Fourier transform (DFT).
To evaluate the analytic signal required by the algorithm,
3. Deep Learning Analysis for Estimating Sleep Syndrome Detection Utilizing the Twin Convolutional Model FTC2 13
it is shown that the time domain definition implemented
as a finite impulse response (FIR) filter is practical and
more efficient than the frequency domain definition of the
analytic signal, according to [3]. The wavelet transform
([4, 5]) utilizes the Fast Fourier Transform to extract fre-
quency based wavelets. Empirical mode composition is
one of the most powerful signal processing techniques
used for fault diagnosis. Deriving from local characteristic
timescales of a signal and can decompose the signal into a
set of complete and almost orthogonal components known
as intrinsic mode function (IMF). The IMFs indicate the
natural oscillatory mode imbedded in the signal and serve
as the basis functions, which are determined by the signal
itself, rather than by predetermined kernels. Therefore, it is
a self-adaptive signal processing technique that is suitable
for nonlinear and nonstationary processes and is suitable
for fault feature extraction of spiral-bevel gears. Accord-
ing to [5], CEEMDAN has been proven to be an effective
method for analyzing nonstationary signal followed by
strong noise. First, the raw vibration signal is decomposed
by the CEEMDAN method to obtain a series of intrinsic
modal functions (IMFs). The IMFs which included greater
amounts fault information are selected as the optimal IMFs
based on the correlation coefficient. Next, the permutation
entropy values of the optimal IMFs are calculated. In order
to obtain accurate permutation entropy values, the two
key parameters, namely, embedding dimension and delay
time, are optimized by using the overlapping parameter
method. In order to assess the sensibility of the permuta-
tion entropy features, the support vector machine (SVM) is
used as the classifier for fault mode identification, and the
diagnostic accuracy can verify its sensibility.
2.2.2 FTC2 model architecture
The standard practice for image recognition, computer
vision and more are deep convolutional neural networks.
Models like, LeNet [7], AlexNet [8], ImageNet [9] and more
work exclusively on 2D data. They are also referred to as
2D CNNs. With the same idea in mind, 1D CNN have been
developed. Despite the obvious fact, that the 1D CNNs
apply a 1D kernel to data, some of the advantages are:
1D CNNs don’t require heavy matrix operations (nor at
the forward pass or the backpropagation). Potentially, what
this means is that they are, compared to their 2D counter-
parts, computationally less complex and can run on CPU
hardware.
The FTC2 is passed through a Leaky Rectified Lin-
ear Unit for nonlinearity purposes. The input signal then
passes a max-pooling layer with the stride of 2, following
that is batch normalization layer and finally the Bidirec-
tional layer. Each twin structure contains three such blocks.
The outputs of the convolutional-LSTM blocks are then
concatenated across axis 1 in order to be finally passed
through a fully connected 64 unit dense layer. We use
the softmax activation to receive the final scores for each
sleep stage. The CNN consists of three different-sized fil-
ters with the idea in mind being that small filters extract
temporal information and large filters to extract frequency
information. The idea behind these variable sizes of filters
comes from the signal processing community to have a
trade-off between extracting time domain and frequency
domain features [6]. This helps get benefit from both time
and frequency domain features in the classification task.
The feature map generated from the 1D concatenated out-
put from the twin convolutional blocks are intertwined
with long short-term memory (LSTM) units to capture the
complex context dependencies between the inputs and the
targets.
2.2.3 Utilizing the Conv-1D and the Bidirectional LSTM
The Conv-LSTM network combines the best of both
worlds, one-dimensional convolutional layers handles spa-
tial data using a kernel to train a set of filters that best
represent the hyperplane and the LSTM which encodes
temporal inputs using cell state memory. To put it differ-
ently, Conv-LSTM predicts the future state of a cell given
vectors on a spatial grid and past states of neighbours.
Convolutional-LSTM layer works by passing the 1D kernel
over a set of training points and its result a.k.a feature map
is passed onto the LSTM cell. In this project, we have uti-
lized the bidirectional recurrent neural network instead of
the standard LSTM cell. Put simply, this was enabled due
to the limitations of LSTM having the limitation of being
restricted from processing previous input state. Given the
inputs x = x0, xN, which are single dimensional data of
a 30-second clip, which should assure stability and little
overlap, these inputs are passed into the twin architecture.
2.3 Loss Calculation
Sleep stage classification encounters the class imbalance
issue which we have addressed accordingly. Such imbal-
ancy will have had severe tendency to bias the better rep-
resented part of the dataset. To alleviate this we have taken
both the extended mean false error (MFE) and the mean
squared false error (MSFE) for multiclass classification.
MFEL =
q
1
N ∑i=1 C(xi − x̂)2
2.4 Unsupervised Method for Detecting
Onsets of Sleep Syndromes
Syndromes in question are restless leg syndrome (RLS),
rapid Eye Movement (REM) sleep behaviour disorder,
insomnia, sleep apnea and narcolepsy. In attempt to detect
these complex syndromes through EEG data, we have
come up with the following: Each of the syndromes will
be followed with a explainable paragraph, respectively.
4. 14 Tim Cvetko and Tinkara Robek
Figure 1. A schema of the FTC2 architecture.
2.4.1 Restless leg syndrome
A dopaminergic drug – lisuride exhibited increase in alpha,
decrease in beta and slow activities on brain function
measured by computerized EEG. It was postulated that
reverse EEG changes might play role in the pathogene-
sis of RLS. During transition from wakefulness to sleep
stage 1 changes in alpha activity initiate long-lasting alpha
arousal responses and they continue increasingly at sleep
stage 2. This dysfunction is probably due to a genetic vul-
nerability of EEG alpha rhythm and disinhibits the dien-
cephalospinal dopamine system, mostly during sleep but
also during wakefulness. The disinhibition produces back-
ground for activation of PLMs, disturbing sensations in
brainstem and urge to move, motor restlessness at cerebral
cortex, generally for legs. All lead to severe insomnia. In
RLS patients, forced deviations from alpha to theta or beta
activity are unsuitable and resting EEGs reflect a dopamine
receptor-specific ‘individual sensitivity.’ This vulnerability
is alleviated after lisuride with suitable CEEG changes.
We have designed an unsupervised statistical infer-
ence model for approximating the restless leg syndrome
in EEG. First the Savitzky–Golay filter was applied to
each 30-second window for the purpose of smoothing the
data, that is, to increase the precision of the data with-
out distorting the signal tendency. This is achieved, in a
process known as convolution, by fitting successive sub-
sets of adjacent data points with a low-degree polynomial
by the method of linear least squares. Next, an orthnog-
onal discret Fourier Transform was applied to the data
to decompose functions depending on space or time into
functions depending on spatial or temporal frequency. At
last, the final RLS score is computed by applying the sig-
moid activation function to the fourier-transformed data.
2.4.2 Sleep apnea
When a person is sleeping, due to pause in breathing, car-
bon dioxide may build up in the bloodstream. When this
reaches a critical level, it is detected by chemoreceptors.
5. Deep Learning Analysis for Estimating Sleep Syndrome Detection Utilizing the Twin Convolutional Model FTC2 15
These receptors signal an alarm to the brain to wake the
sleeping person and breathe in air. As a result, a transition
in sleep stages occurs, which in turn, causes fluctuation in
activity level of various frequency bands of the EEG signal.
Hence, more distinct features can be preserved in fre-
quency band-limited signals for apnea detection compared
with that in full-band EEG signal. As a result, for apnea
event detection, characteristics of band-limited signals are
used instead of analysing full-band EEG signal. EEG sig-
nal is partitioned into five frequency bands [10] including
delta (0.25–4 Hz), theta (4–8 Hz), alpha (8–12 Hz), sigma
(12–16 Hz) and beta (16–40 Hz). Spectral filtering is done
in fast Fourier transform domain to achieve this division.
In order to attain a relative score for approximating sleep
apnea possibility, we have adopted the method proposed
in [7]. For classification of apnea and non-apnea events,
a subject-specific classification scheme based on feature
is introduced in this proposed method. Inter-band energy
ratio of band-limited EEG signal, expected to possess dif-
ferentiating characteristic for apnea and non-apnea events,
is proposed as the feature. During sleep apnea, the energy
contents in various frequency bands change significantly
with respect to non- apnea events.
2.4.3 REM behaviour sleep disorder
Despite what was presented in [9], we have come about a
rather simple, but clever way of detecting the REM instabil-
ity score. A relative score was calculated by using a greedy
algorithm for longest continuing sequence [10] to obtain a
value that should correspond to the disturbance of REM
sleep in an individual.
2.4.4 Narcolepsy
According to [11] patients with narcolepsy showed lower
alpha power, higher delta and theta power during wake-
fulness, and higher alpha and beta power during rapid
eye movement (REM) sleep. The former two groups also
showed lower sleep efficiency and a higher rate of positiv-
ity of REM-related symptoms than the other two groups.
With this idea in mind, we have combined the REM insta-
bility score and the obtained frequency range with wavelet
transform on the first and last 10 percent of sleep, indicat-
ing worse sleep-to-wake transitions or vice versa.
2.4.5 Insomnia
Insomnia or sleeplessness is a sleep disorder in which
there is an inability to fall asleep or to stay asleep as long
as desired. Following the previous work done by Mohd
Maroof Siddiqui, Geetika Srivastava, and Syed Hasan
Saeed in [11]. Now each clipped signal is preprocessed and
then passed through the Hanning window low pass filter
for removing the high frequency components that eventu-
ally indicate noise because major proportion of EEG signals
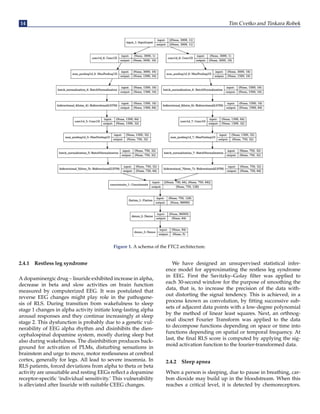
Figure 2. Polysomnography plot for a single patient. Pic-
ture was generated with the MNE Python library.
are limited within the range of 25 Hz. Hence, the filter
based in FIR filter design of order 200 with cut off fre-
quency of 25 Hz with shape of Hanning window. At this
stage, we adopt a method for extracting frequency length
windows via the Welch Power Spectrum [12]. This score,
obtained with softmax and the REM instability score com-
bine for the insomnia score.
2.4.6 Sleep depth
Given a great sleep stage classifier, we concluded to not
only move in the direction of detecting abnormalities, but
to also quantify sleep depth. First, the raw records are
pushed through a Savgol filter to noise filtering. Further-
more, a Fast Fourier Transform has given us a distribution
of frequencies. At this stage, we evaluated the FFT distri-
bution to obtain the sleep depth score along with the REM
instability score.
REM Sleep
Syndromes RLS disorder Apnea Narcolepsy Insomnia depth
Total 177983 6674 8899 4449 48945 164738
Percent 7.80 0.29 0.41 3.0 22 74.0
NHCS 7–10 0.5–1 0.5 3–7 10–30 66
Percent
3 Experimental Results
3.1 Data
For the purposes of this research, we used the Phys-
ionet Sleep-EDF dataset. The sleep-edf database contains
197 whole-night PolySomnoGraphic sleep recordings, con-
taining EEG, EOG, chin EMG, and event markers. Some
records also contain respiration and body temperature.The
6. 16 Tim Cvetko and Tinkara Robek
Sleep-EDF dataset contains two different studies includ-
ing study of age effects on sleep in healthy individuals
(SC = Sleep Cassette) and study of temazepam effects
on sleep (ST = Sleep Telemetry). The dataset includes
whole-night polysomnograms (PSGs) sleep recordings at
the sampling rate of 100 Hz. Each record contains EEG
(from Fpz-Cz and Pz-Oz electrode locations), EOG, chin
electromyography (EMG), and event markers. Few records
often also contain oro-nasal respiration and rectal body
temperature. The hypnograms (sleep stages; 30-s epochs)
were manually labeled by well-trained technicians accord-
ing to the Rechtschaffen and Kales standard. Each stage
was considered to belong to a different class (stage). The
classes include W, REM, N1, N2, N3, N4, M. Data syn-
drome comparison was done according to [13].
Dataset W N1 N2 N3–N4 REM Total
Sleep- 8285 2804 17799 5703 7717 42308
EDF-13
Sleep- 65951 21522 96132 13039 25835 222479
EDF-18
It is worth noting that the sleep stages in the Physionet’s
Sleep-EDF database are not normally distributed. There is a
significantly higher number of W and N2 stages than oth-
ers which is causing class imbalance. We have discussed
this at Loss calculation.
The model was trained for 20 epochs. We used the Adam
optimizer to minimize the MFE loss with a batch size of 16
and a learning rate alpha = 0.001. We also added the L2
regularization penalty with beta being = 0.001 to mitigate
the overfitting. For this goal, we used Python as the pro-
gramming language and TensorFlow as the framework.
By employing the Conv-1D and the Bidirectional LSTM
twin network, we have successfully taken advantage of
the temporal and spatial component of the signal process-
ing nature. To reduce the class imbalances problem, we
adopted the weighted MFE loss.
Accuracy Precision Recall F1-score Final MFE
90.43 77.76 93.32 89.12 0.09
4 Conclusion and Future Work
In this paper, we have successfully proposed a new deep
learning approach to the challenging problem of sleep
stage classification that is essential for further analy-
sis of the human brain activity. We utilized a two-part
convolutional-LSTM block along with a multi-layer per-
ception to classify sleep stages from EEG data with the
accuracy of . By incorporating a vastly important CEEM-
DAN preprocessing method, we build a more stable and
noise-free variant of our data, which enabled building an
end-to-end trainable model for not only classifying sleep
stages, but also detect early onsets of frequently occur-
ring sleep syndromes. Our algorithm takes advantage of
both the spatial and temporal dimension of signal pro-
cessing, as well as statistical analysis to come up with
a score that represents the sleep stage the most. As a
limitation, we would like to add that no data is known
to bare diluted patients. For future work, given proper
data, we would like to do a follow-up. In the future, we
intend to extent this using multimodal polysomnography
to enhance the model’s performance and usability. Follow-
ing our work, we will investigate how these syndrome pre-
dictions/scores align with actual scores and will hopefully
serve as a professional service for automatic sleep stage
and syndrome onset detection.
References
[1] https://epworthsleepinessscale.com/about-the-ess/
[2] Shie Qian and Dapang Chen, “Decomposition of the Wigner-Ville
distribution and time-frequency distribution series,” in IEEE Trans-
actions on Signal Processing, vol. 42, no. 10, pp. 2836–2842, Oct. 1994,
doi: 10.1109/78.324750.
[3] B. Boashash and P. Black, “An efficient real-time implementation
of the Wigner-Ville distribution,” in IEEE Transactions on Acous-
tics, Speech, and Signal Processing, vol. 35, no. 11, pp. 1611–1618,
November 1987, doi: 10.1109/TASSP.1987.1165070.
[4] Katsuhiro Inoue, Akihiko Takajo, Makoto Maeda and Shigeaki
Matsuoka, “Tuning method of modified wavelet transform in
human sleep EEG analysis,” 2007 International Conference on
Control, Automation and Systems, 2007, pp. 2784–2789, doi:
10.1109/ICCAS.2007.4406842.
[5] Xujing Yao, Ji Han, COVID-19 Detection via Wavelet Entropy and
Biogeography-Based Optimization, COVID-19: Prediction, Decision-
Making, and its Impacts, doi: 10.1007/978-981-15-9682-7-8, (69–76),
(2021).
[6] https://www.hindawi.com/journals/sv/2019/7806015/.
[7] Deep Convolutional Neural Networks for Image Classification: A
Comprehensive Review – Scientific Figure on ResearchGate. Avail-
able from: https://www.researchgate.net/figure/Architecture-of-
LeNet-5-LeCun-et-al-1998-fig2-317496930 [accessed 3 May, 2021].
[8] M. X. Cohen, Analyzing neural time series data: theory and practice.
MIT press, 2014.
[9] Krizhevsky, A., Sutskever, I. and Hinton, G. E. (2012). ImageNet
Classification with Deep Convolutional Neural Networks. In F.
Pereira, C. J. C. Burges, L. Bottou and K. Q. Weinberger (ed.),
Advances in Neural Information Processing Systems 25 (pp. 1097–
1105) . Curran Associates, Inc.
[10] Saha S, Bhattacharjee A, Fattah SA. Automatic detection of sleep
apnea events based on inter-band energy ratio obtained from multi-
band EEG signal. Healthc Technol Lett. 2019;6(3):82–86. Published
2019 Jun 3. doi: 10.1049/htl.2018.5101.
[11] J. Deng, W. Dong, R. Socher, L. Li, Kai Li and Li Fei-Fei, “ImageNet:
A large-scale hierarchical image database,” 2009 IEEE Conference on
Computer Vision and Pattern Recognition, 2009, pp. 248–255, doi:
10.1109/CVPR.2009.5206848.
[12] Ferri R, Rundo F, Silvani A, Zucconi M, Bruni O, Ferini-Strambi
L, Plazzi G, Manconi M. REM Sleep EEG Instability in REM Sleep
Behavior Disorder and Clonazepam Effects. Sleep. 2017 Aug 1;40(8).
doi: 10.1093/sleep/zsx080. PMID: 28482056.
[13] Schensted, C. (1961). Longest Increasing and Decreasing Sub-
sequences. Canadian Journal of Mathematics, 13, 179–191. doi:
10.4153/CJM-1961-015-3.
[14] Sasai-Sakuma T, Inoue Y. Differences in electroencephalographic
findings among categories of narcolepsy-spectrum disorders. Sleep
Med. 2015 Aug;16(8):999–1005. doi: 10.1016/j.sleep.2015.01.022.
Epub 2015 Apr 1. PMID: 26026626.
7. Deep Learning Analysis for Estimating Sleep Syndrome Detection Utilizing the Twin Convolutional Model FTC2 17
[15] Siddiqui MM, Srivastava G, Saeed SH. Diagnosis of insom-
nia sleep disorder using short time frequency analysis of PSD
approach applied on EEG signal using channel ROC-LOC. Sleep Sci.
2016;9(3):186–191. doi: 10.1016/j.slsci.2016.07.002.
[16] Zhao, Li and He, Yang. (2013). Power Spectrum Estimation of the
Welch Method Based on Imagery EEG. Applied Mechanics and
Materials. 278–280. 1260–1264. doi: 10.4028/www.scientific.net/A
MM.278-280.1260.
[17] https://www.cdc.gov/nchs/nvss/index.html [Accessed 4.5.
2021].