Download as PDF, PPTX
![MARIS ELSINS
Lead Database Consultant at Pythian
Oracle [Apps] DBA since 2005
Speaker at conferences since 2007
@MarisElsins elsins@pythian.com
http://bit.ly/getMOSPatch](https://image.slidesharecdn.com/lvoug14-db12c-allyouneedtoknowabouttheresourcemanager-150917102703-lva1-app6892/75/DB12c-All-You-Need-to-Know-About-the-Resource-Manager-2-2048.jpg)


The document provides an overview of Oracle 12c's Resource Manager, highlighting its features, benefits, and operational scenarios. It discusses how the Resource Manager allows prioritization of database sessions to optimize CPU resource allocation and manage workload efficiently. Additionally, it outlines the complexities and solutions involved in resource management, particularly in multi-tenant environments.
Overview of the Resource Manager and its features. Introduced by Māris Elsiņš, outlining the agenda.
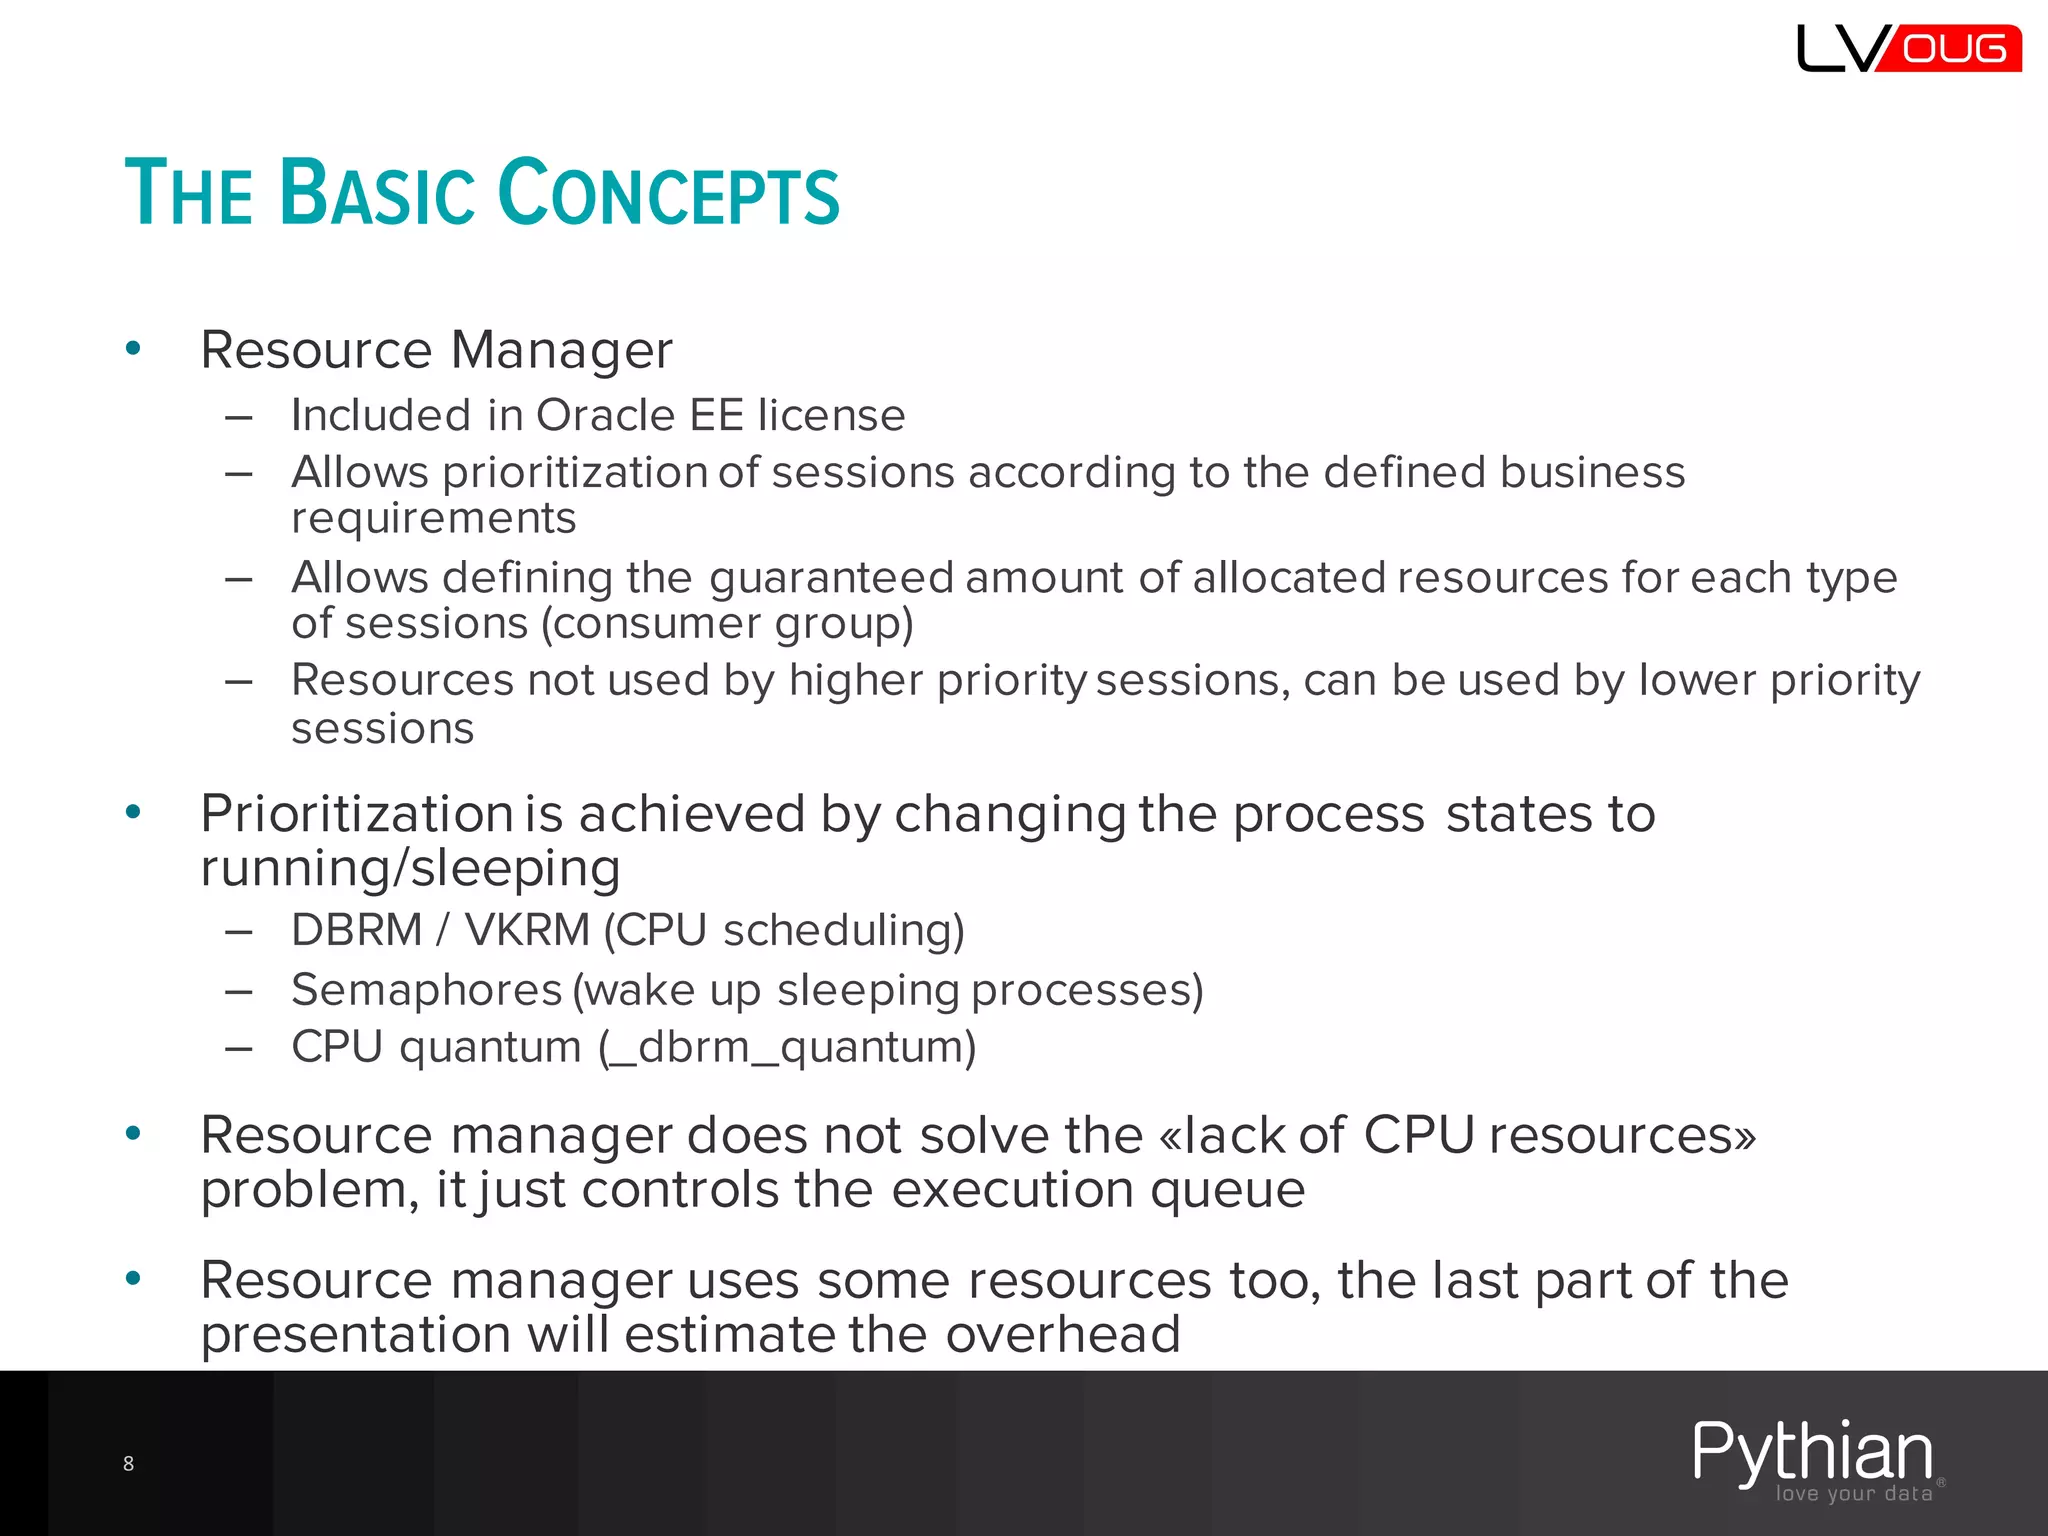
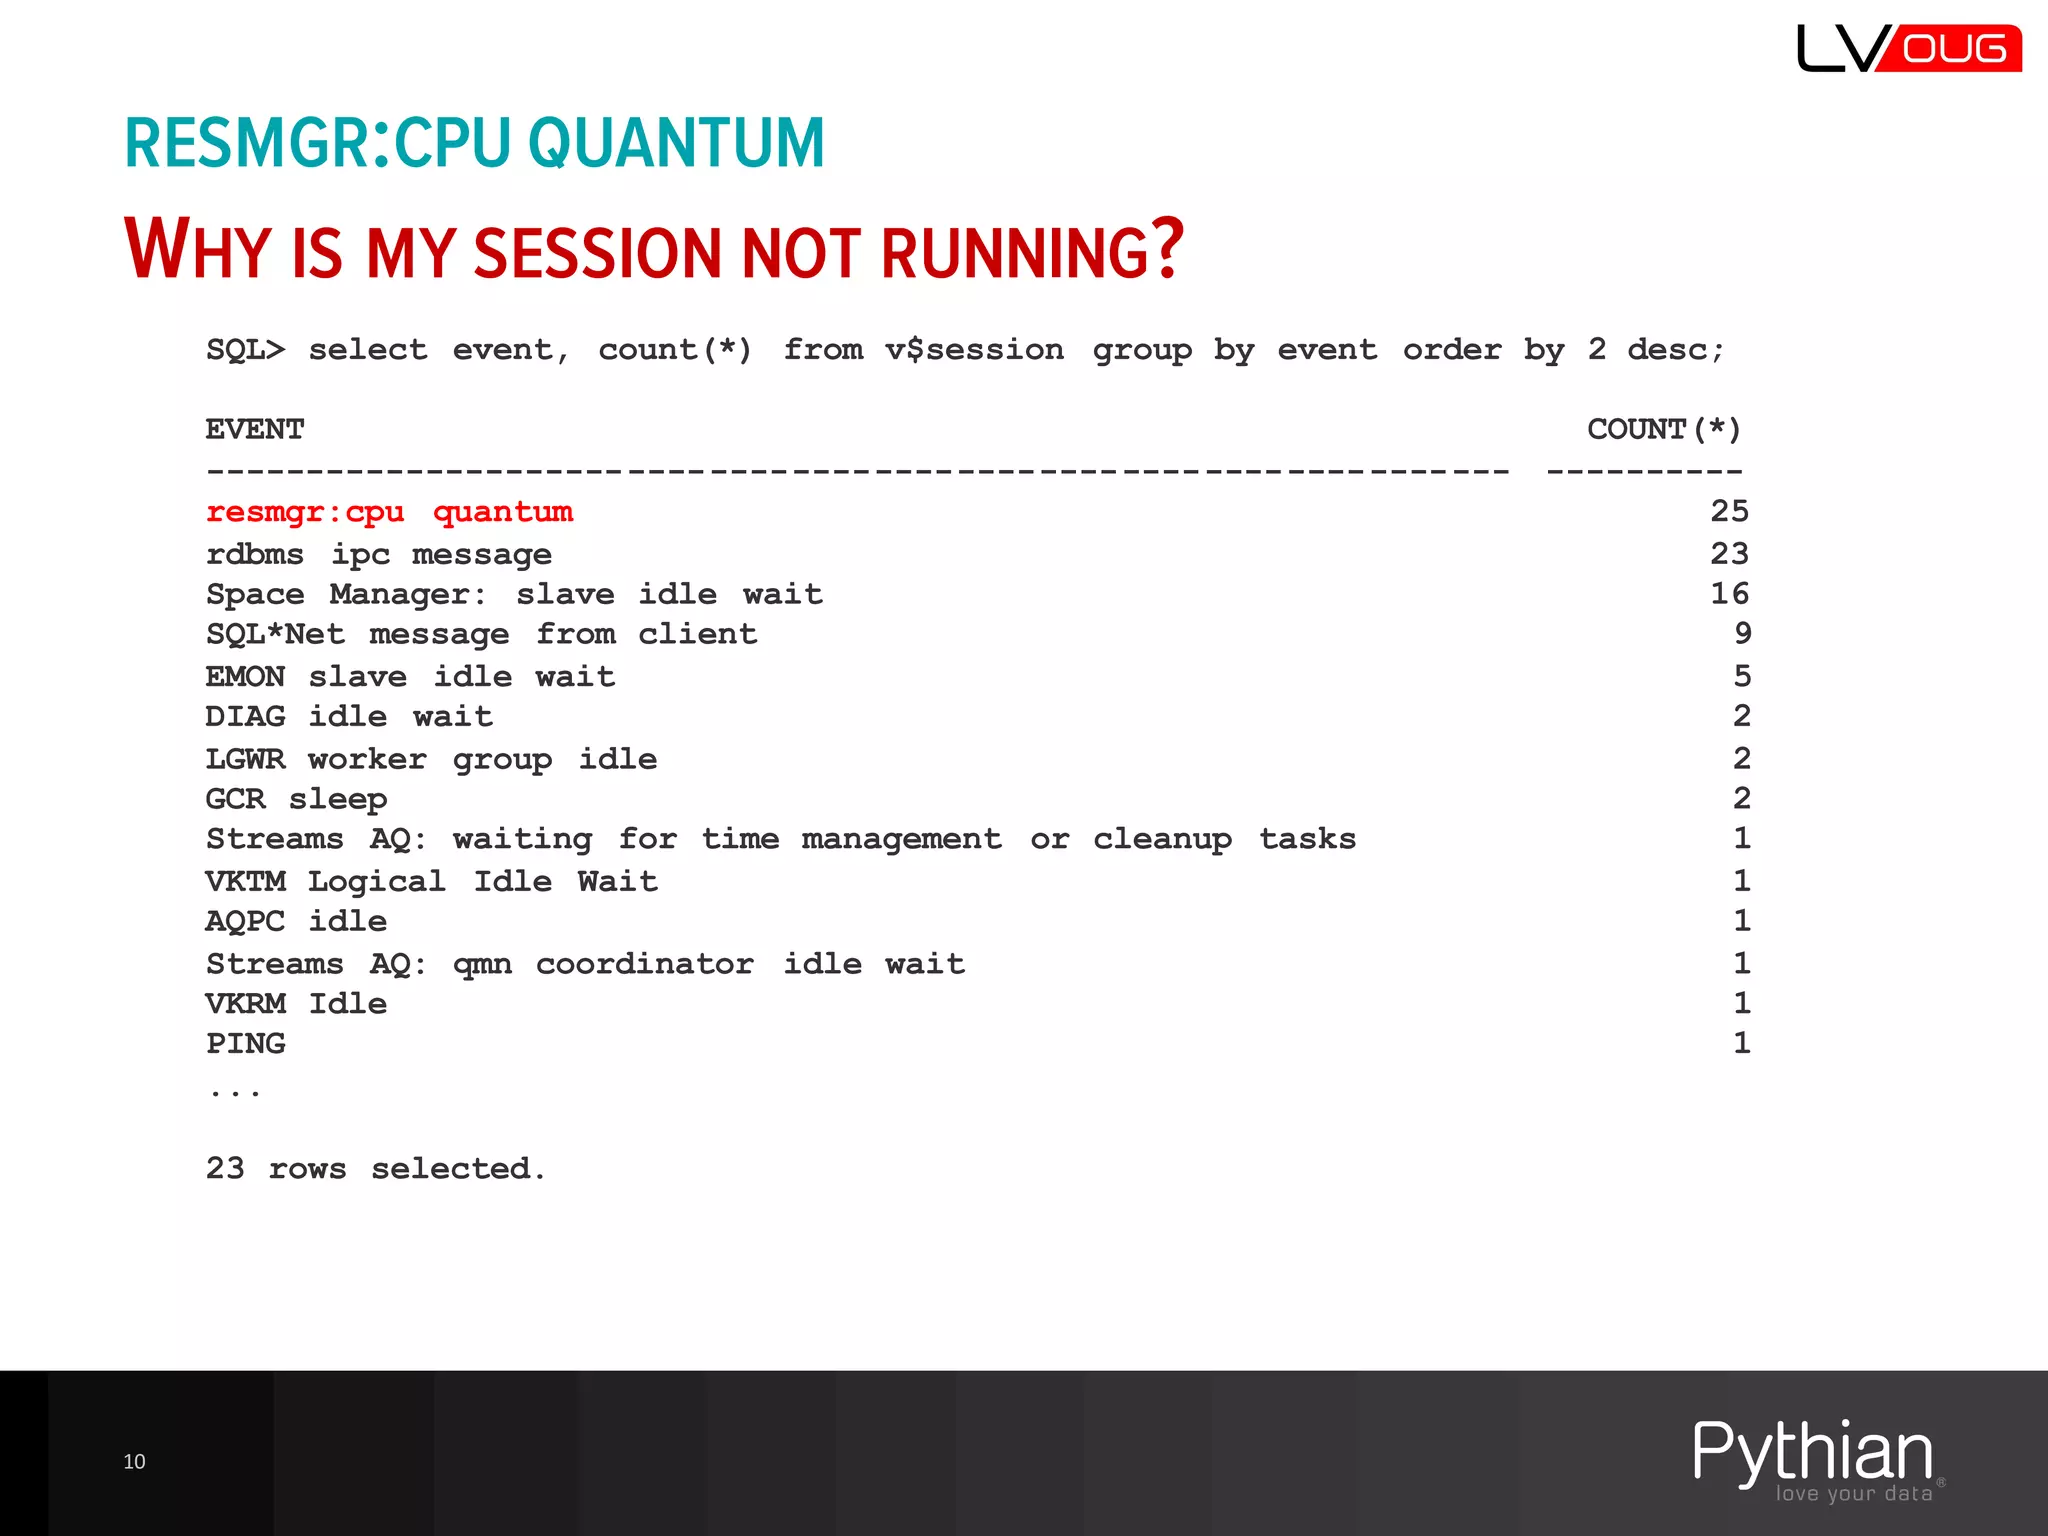
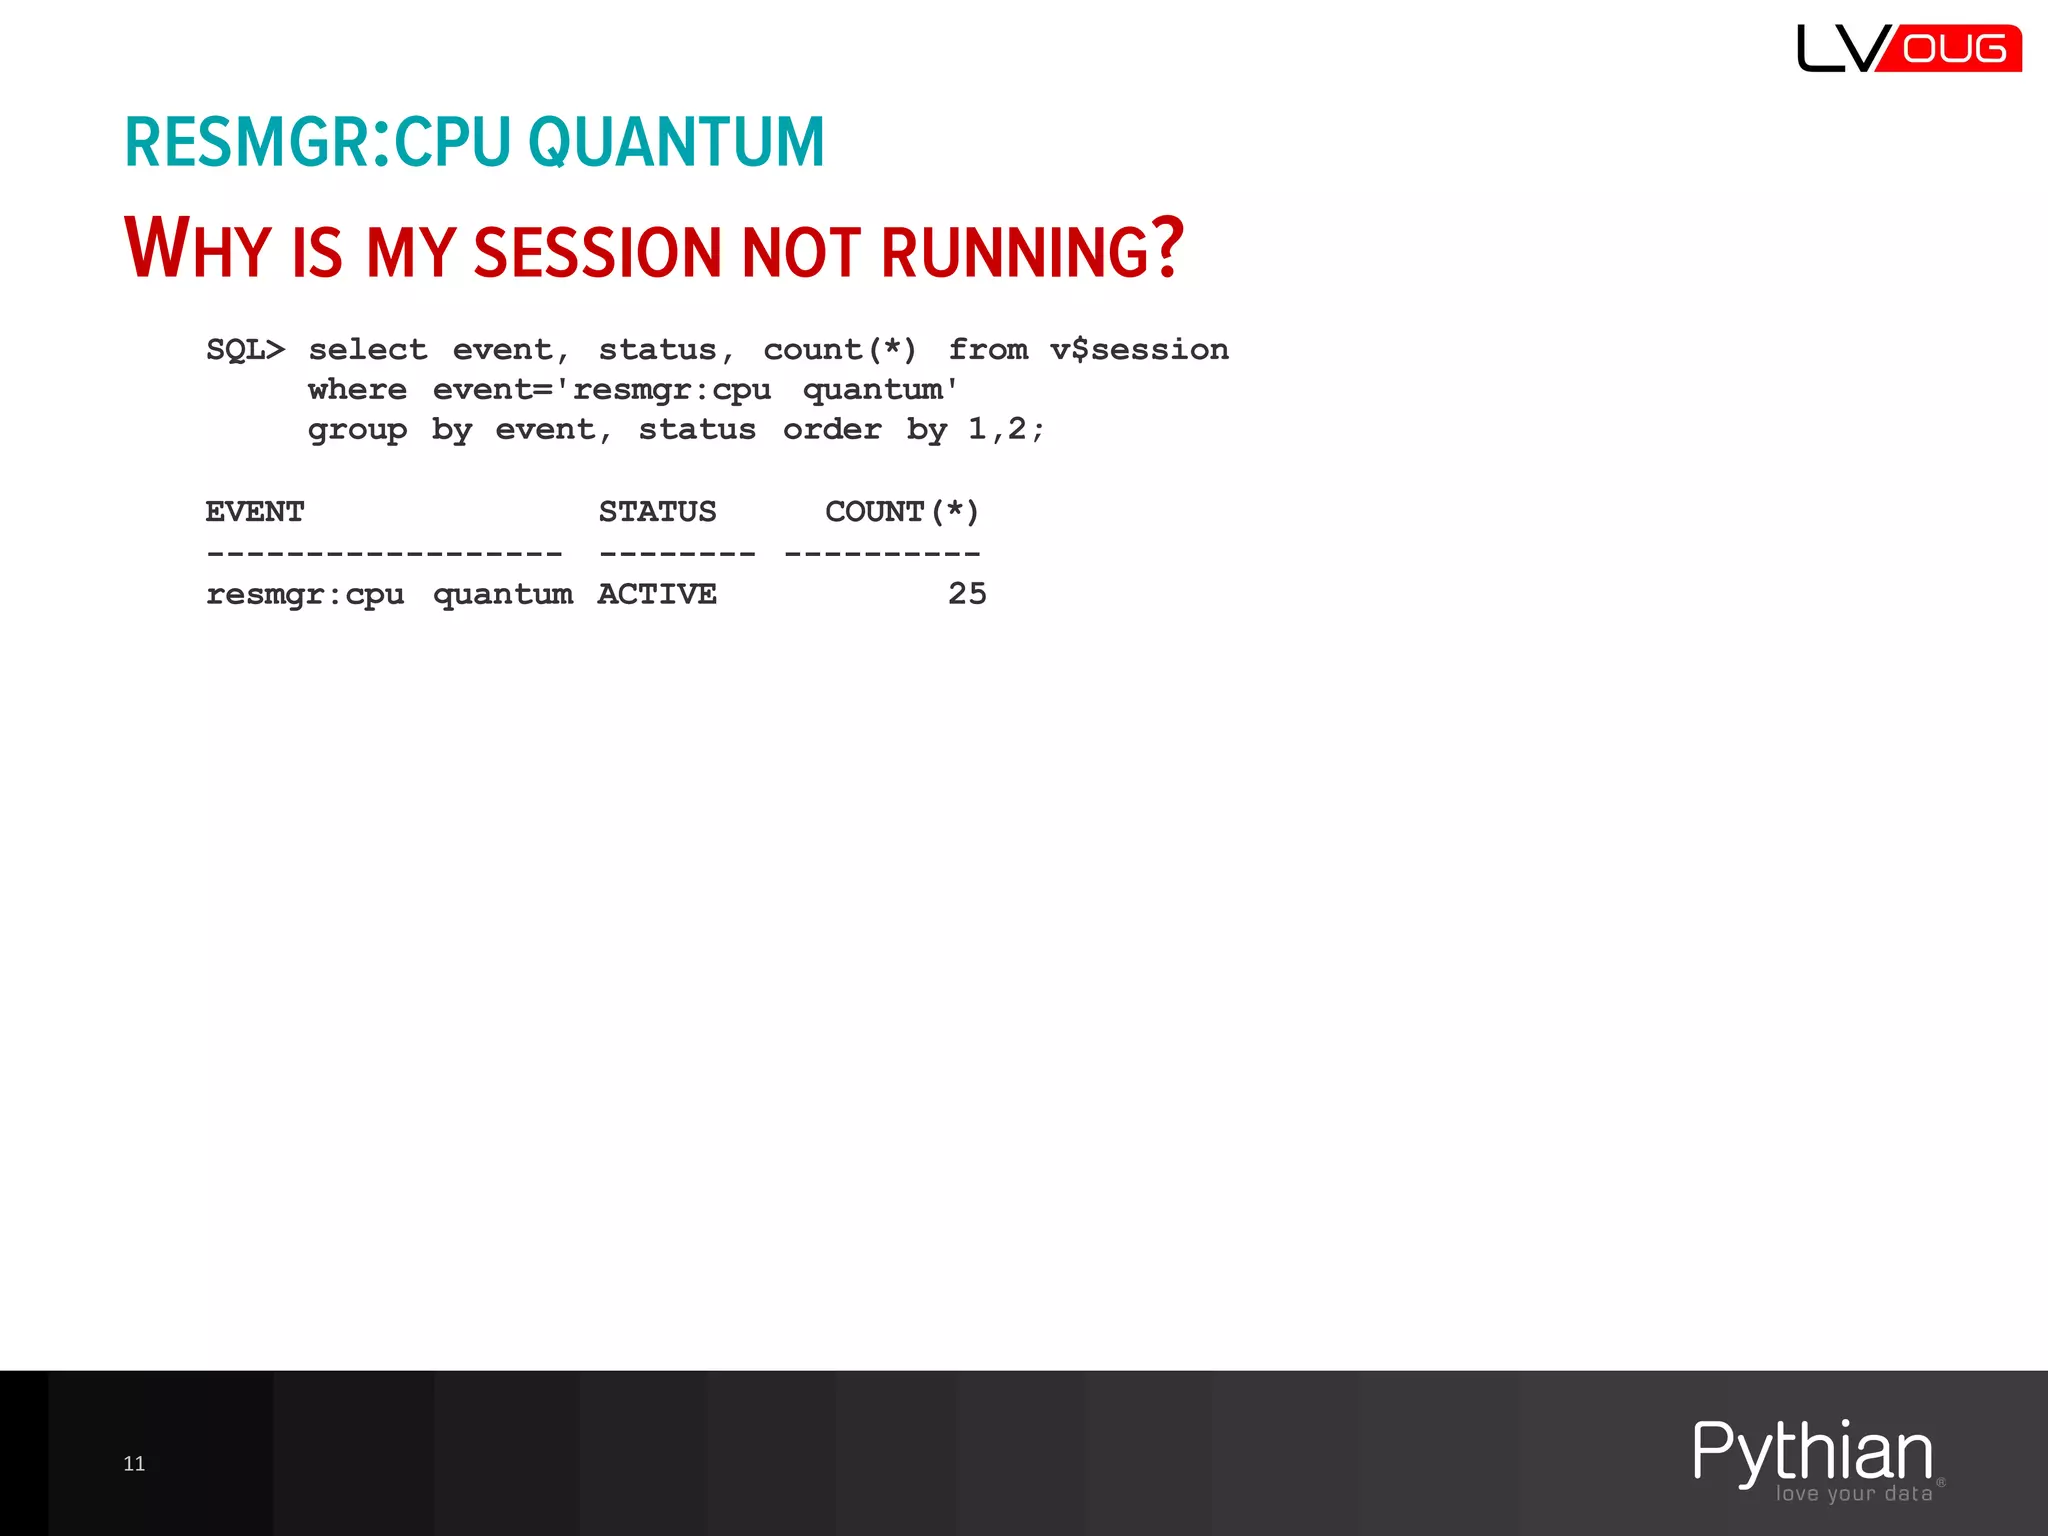
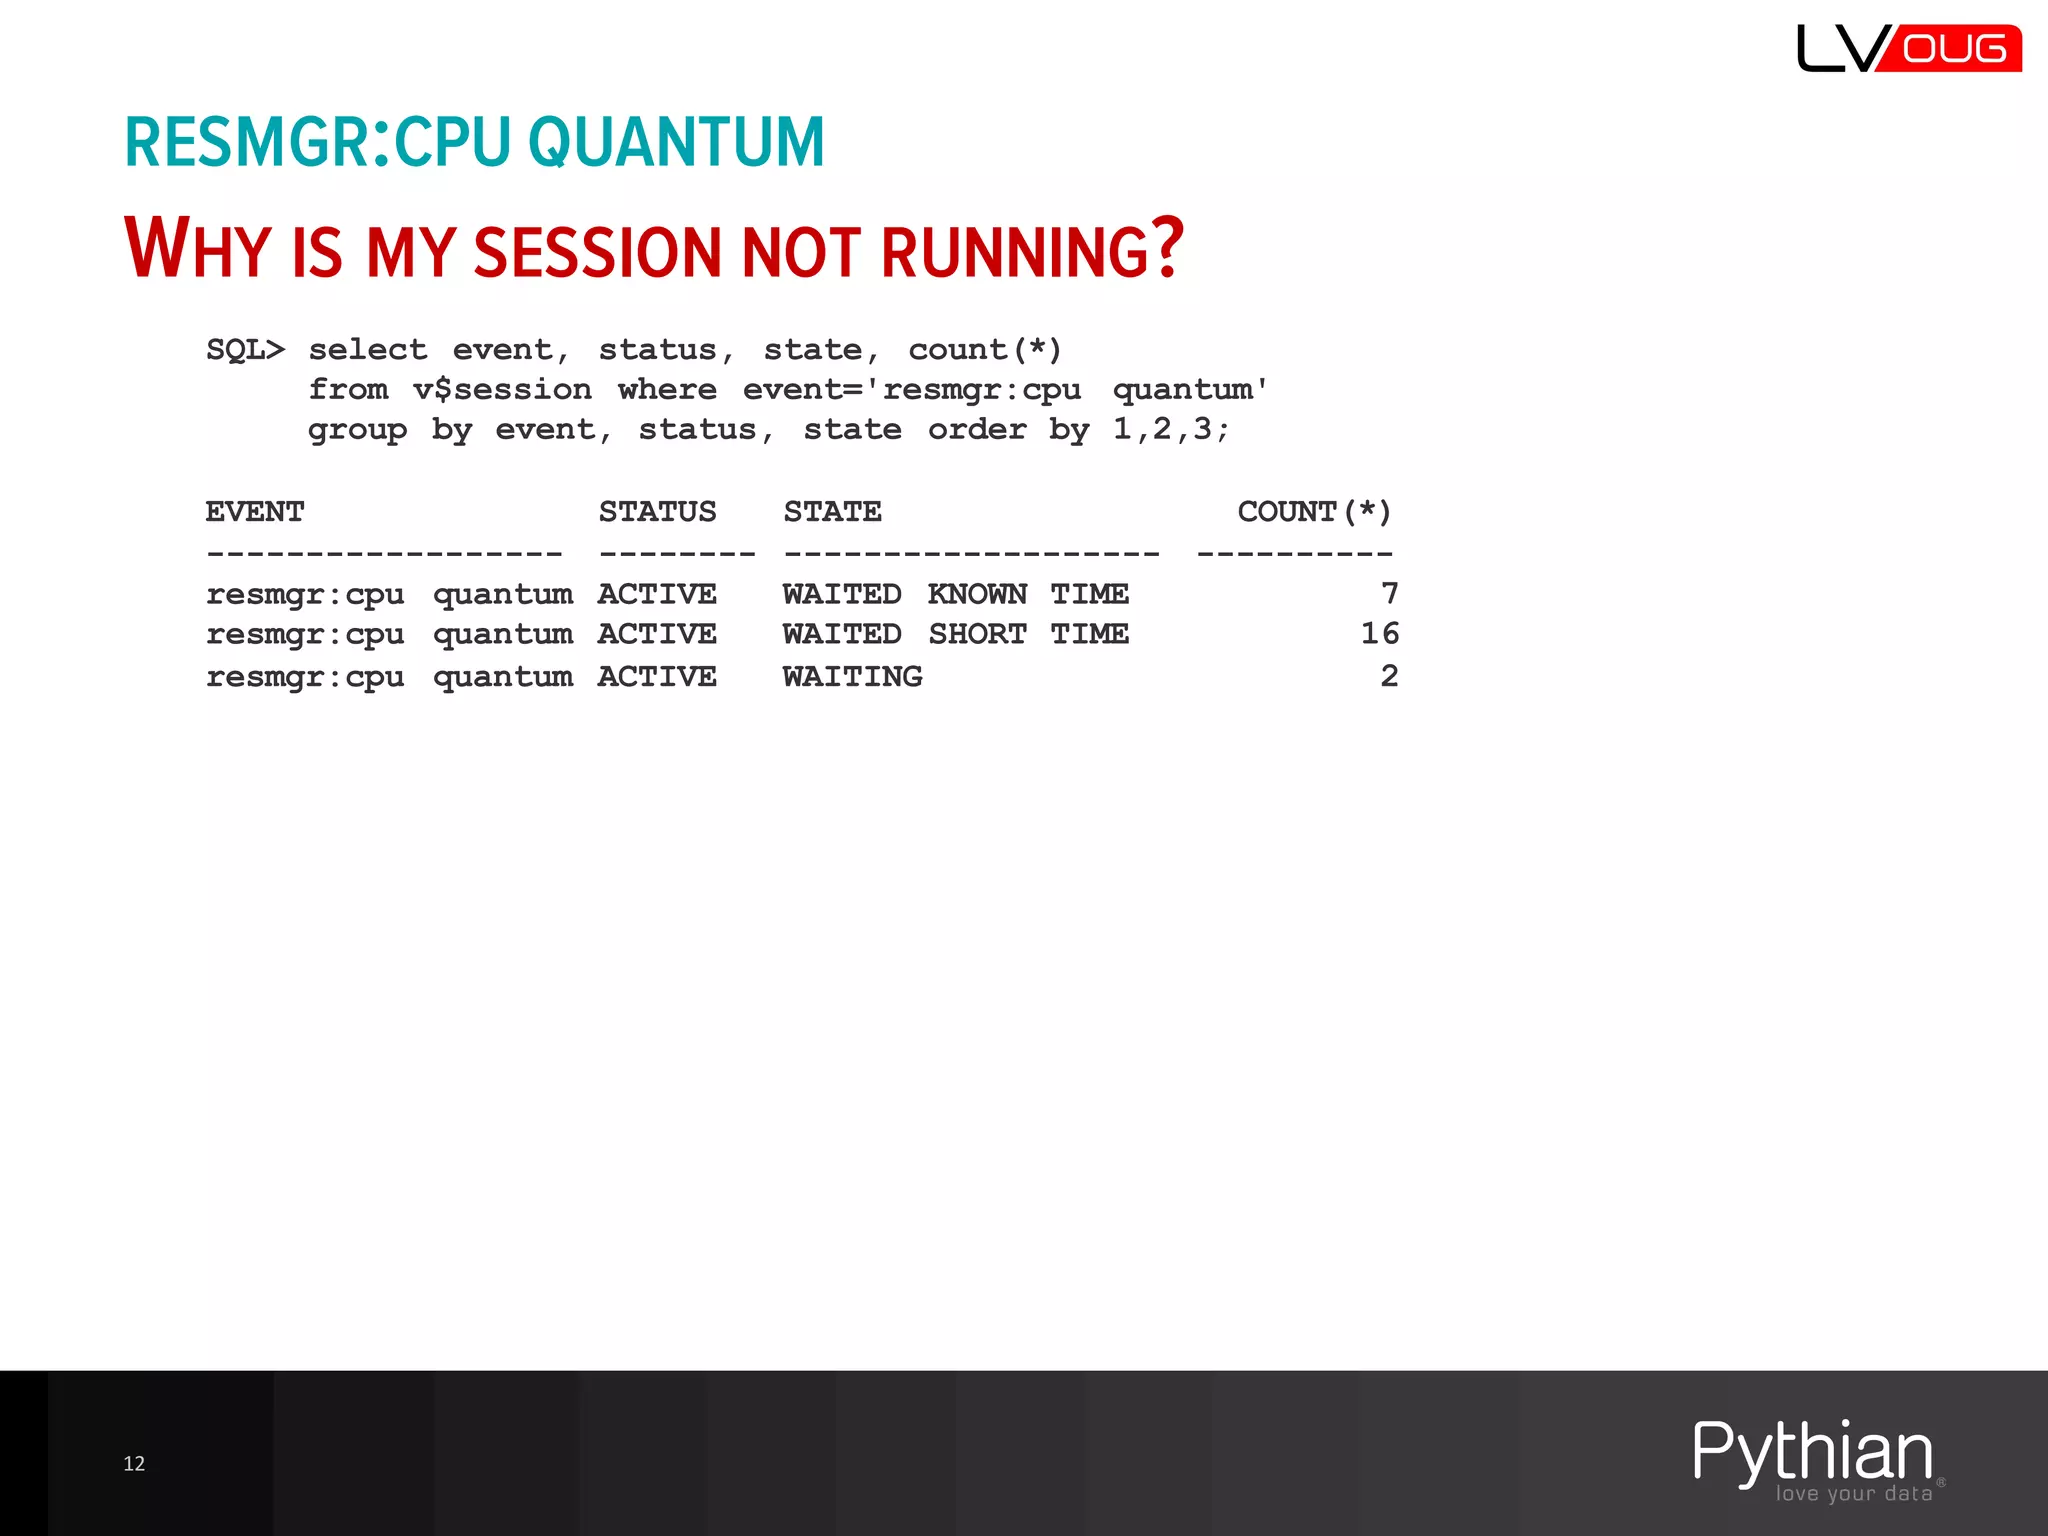
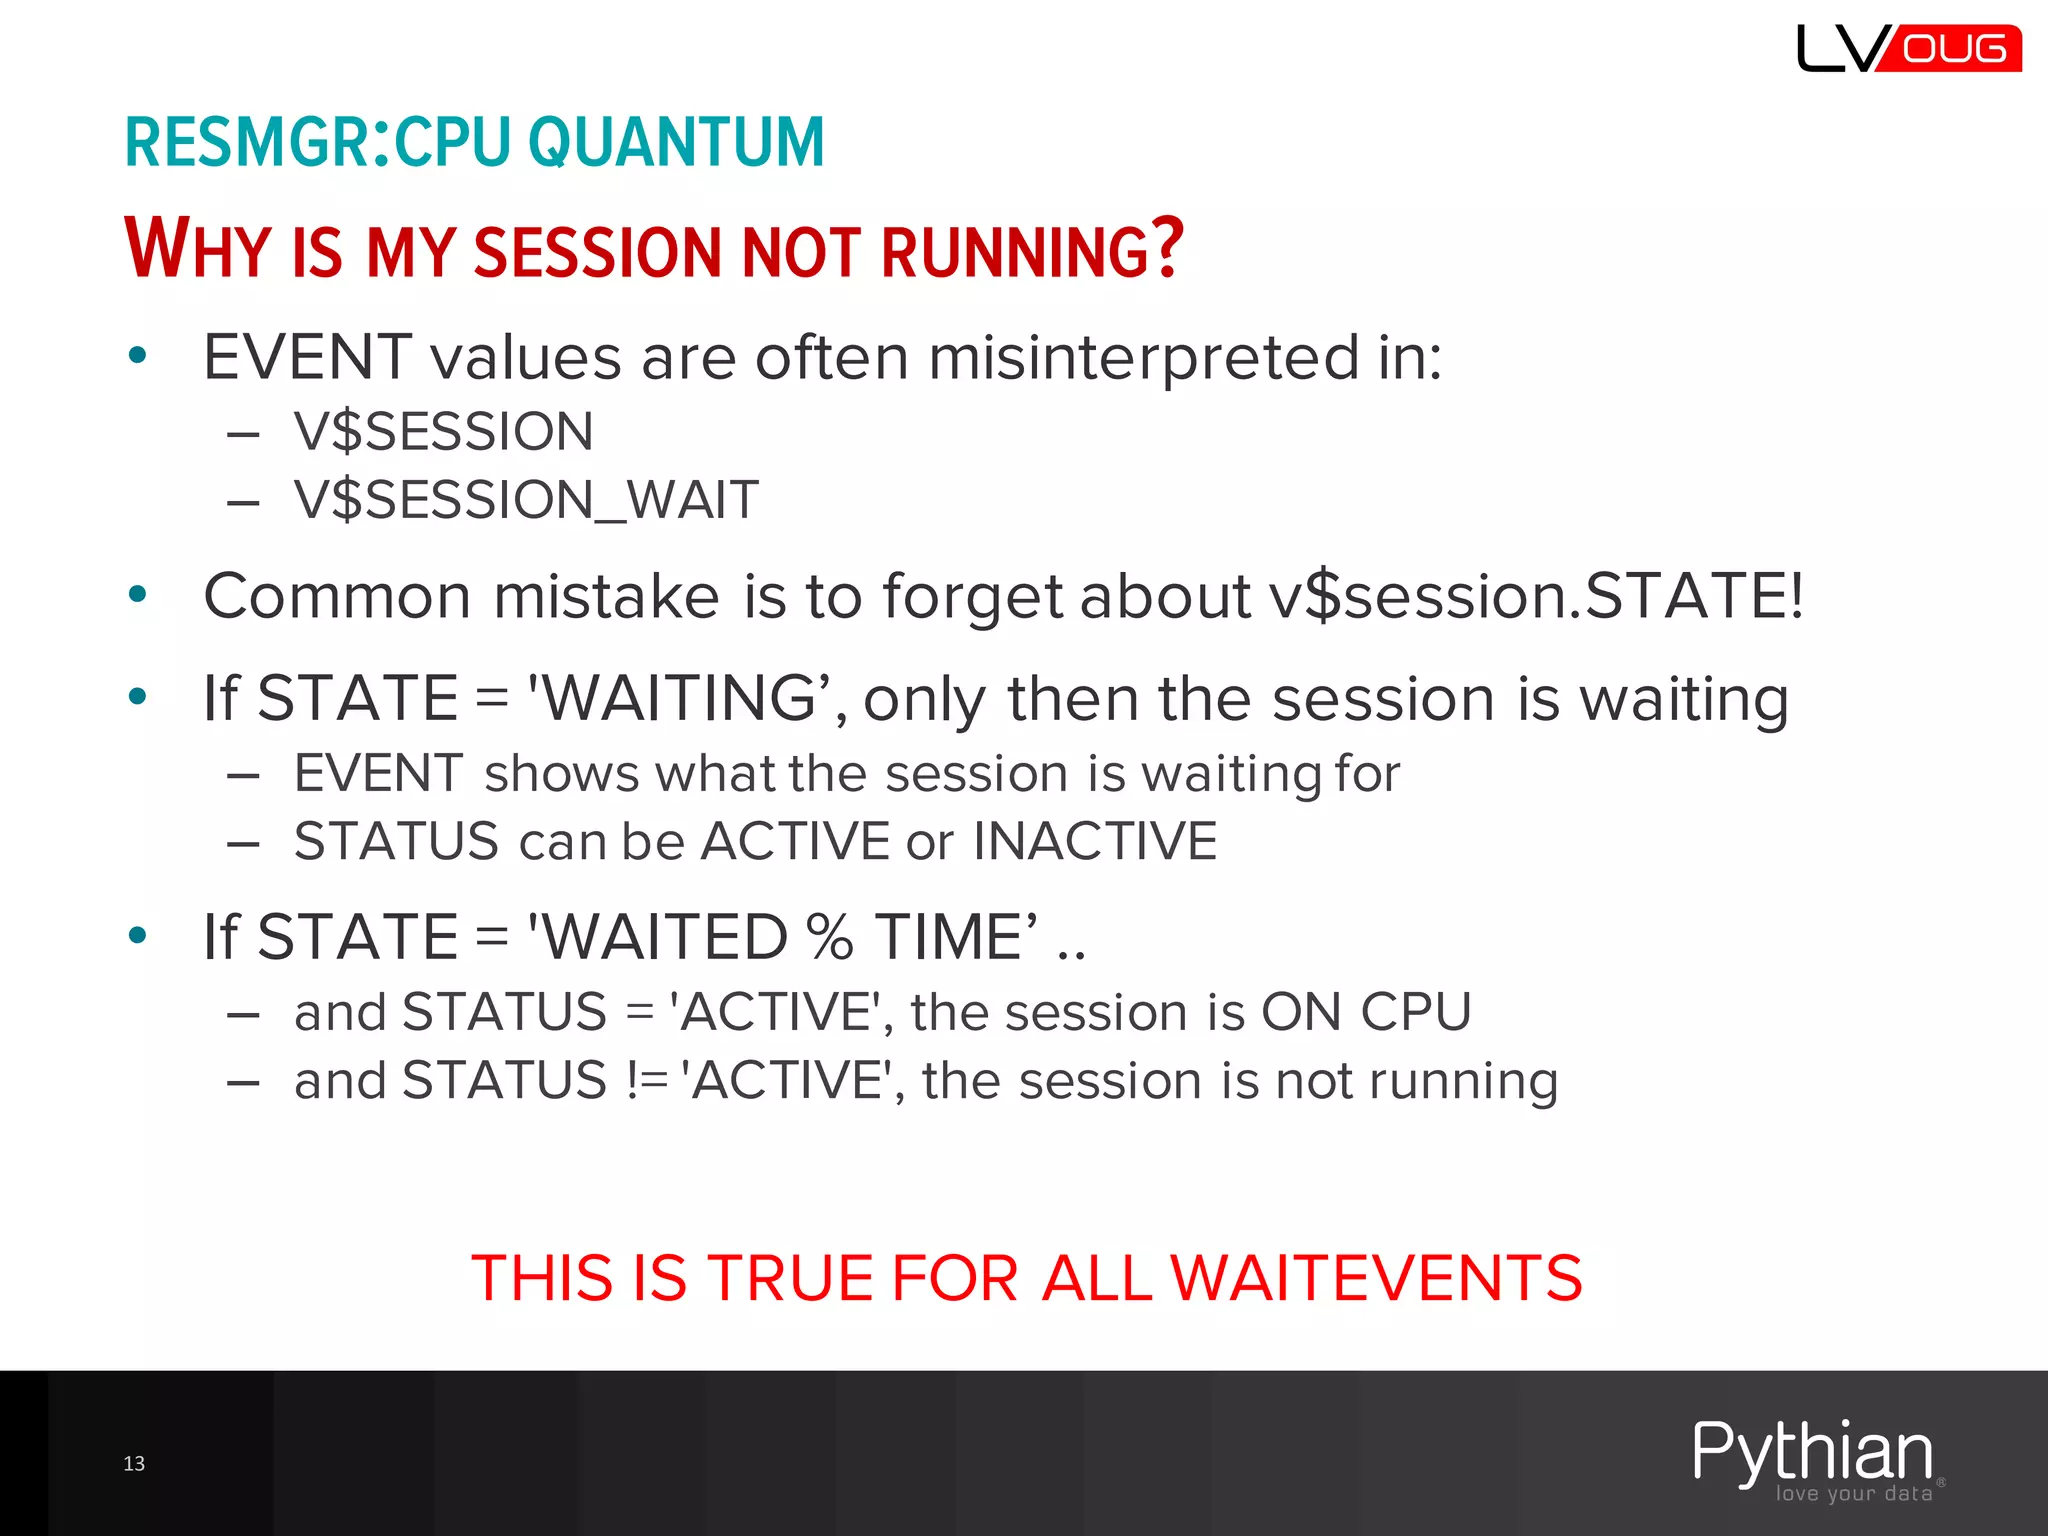
Discussed problems in DB session prioritization and CPU resource management, including CPU starvation scenarios and their impacts.
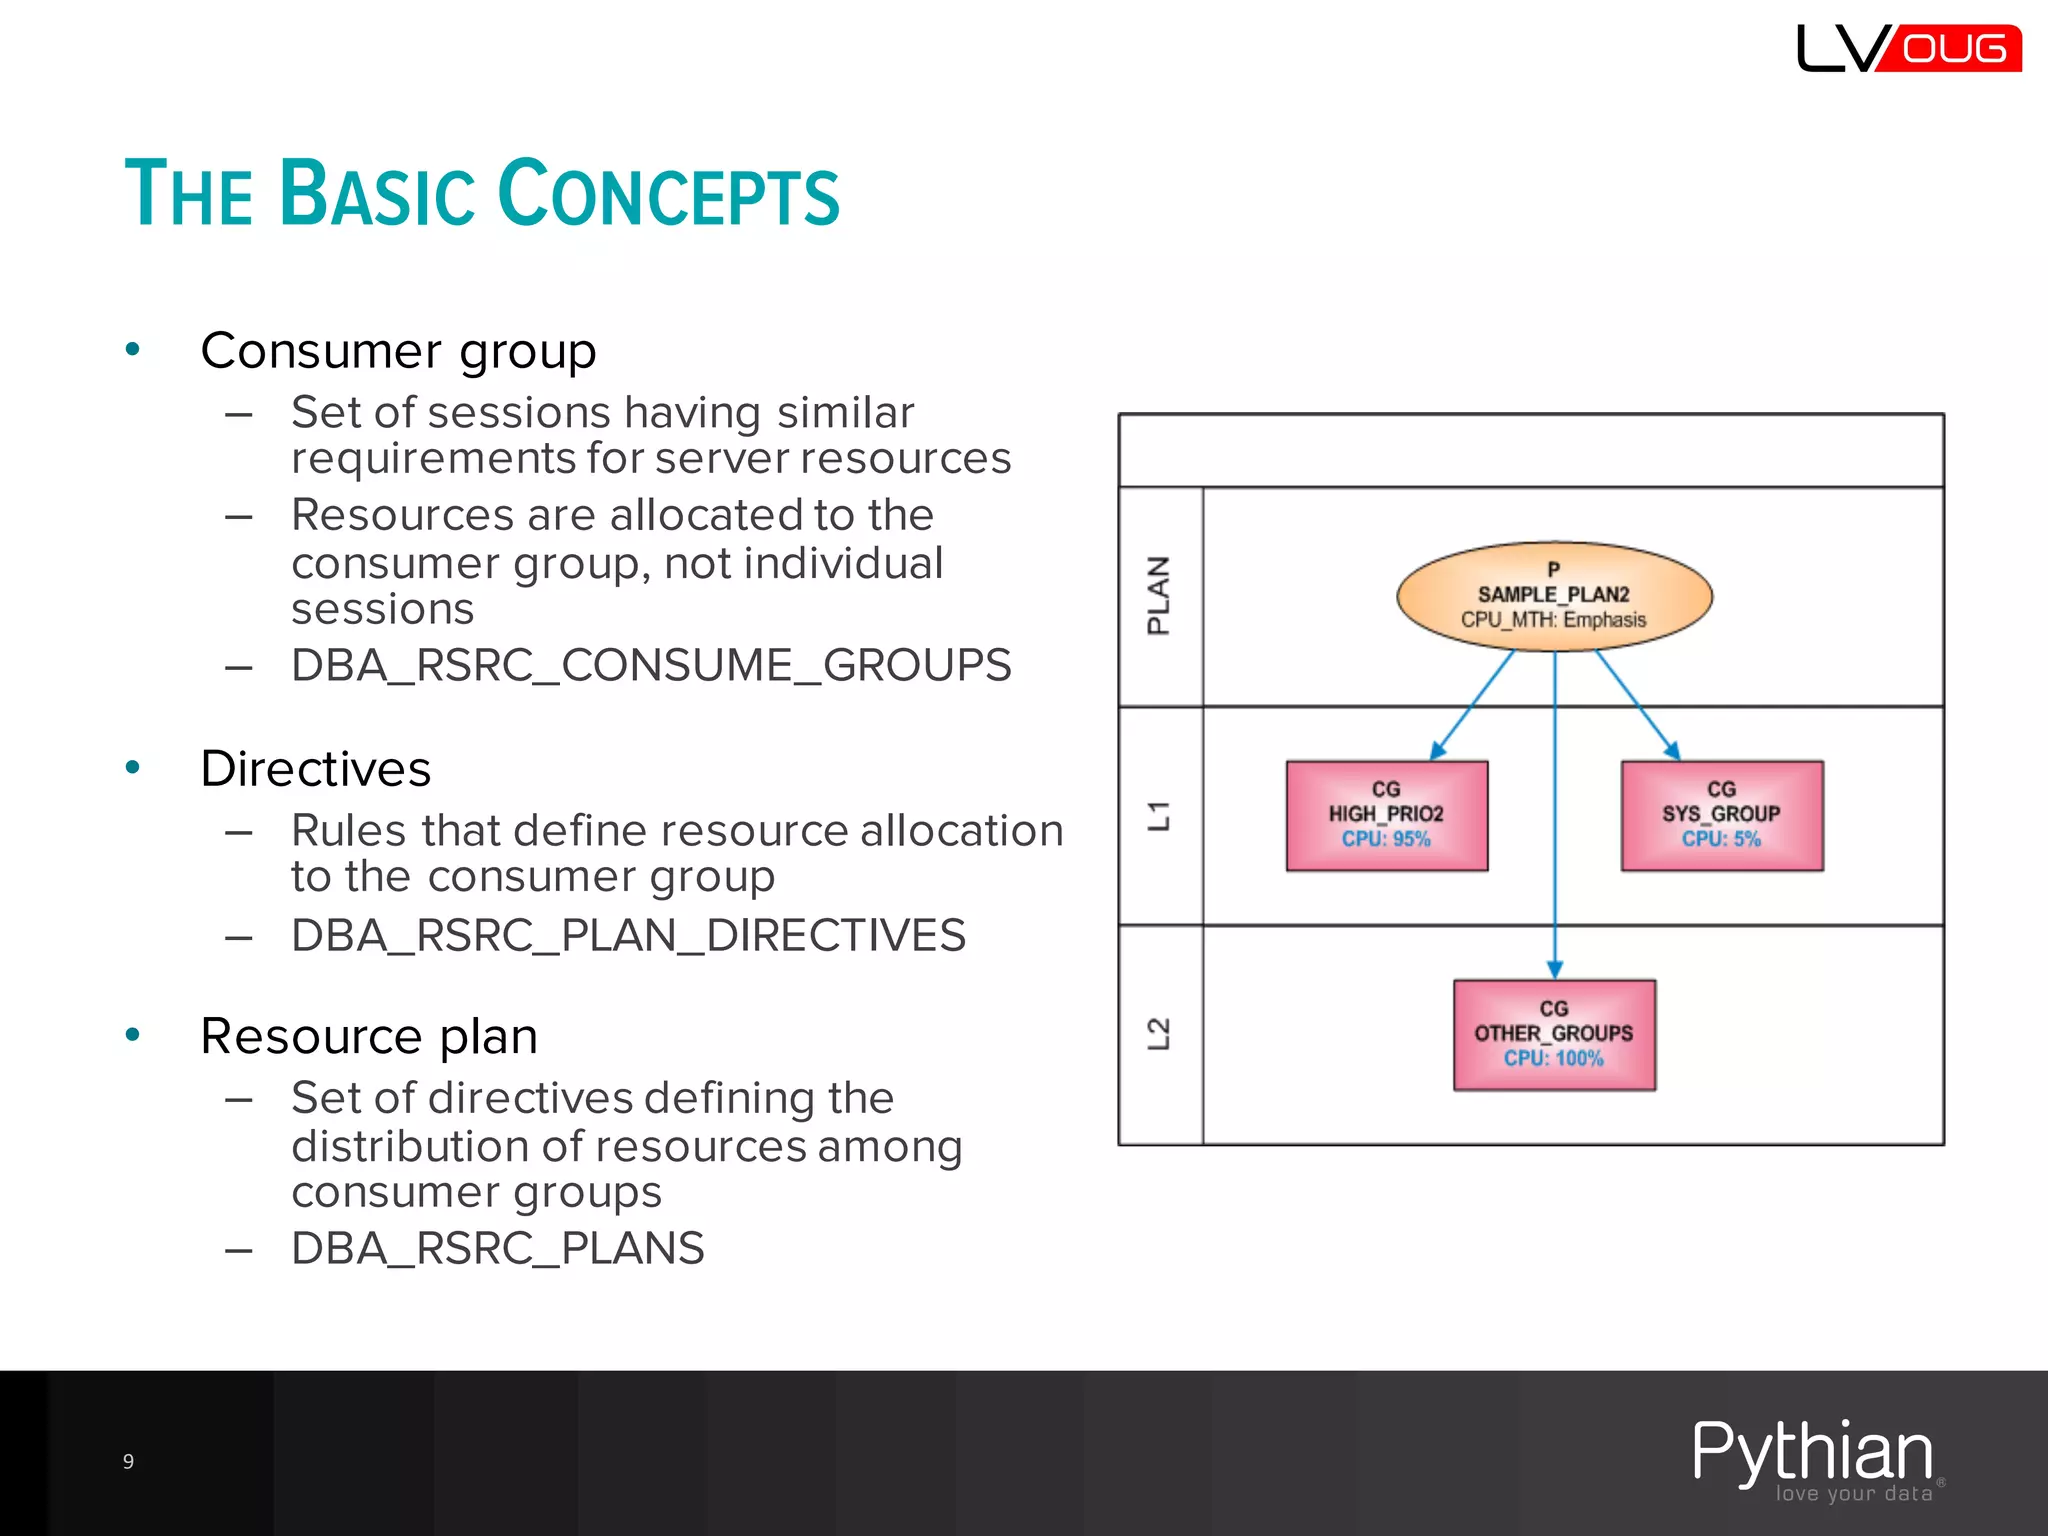
Detailed concepts of Resource Manager including consumer groups and directives for resource allocation.
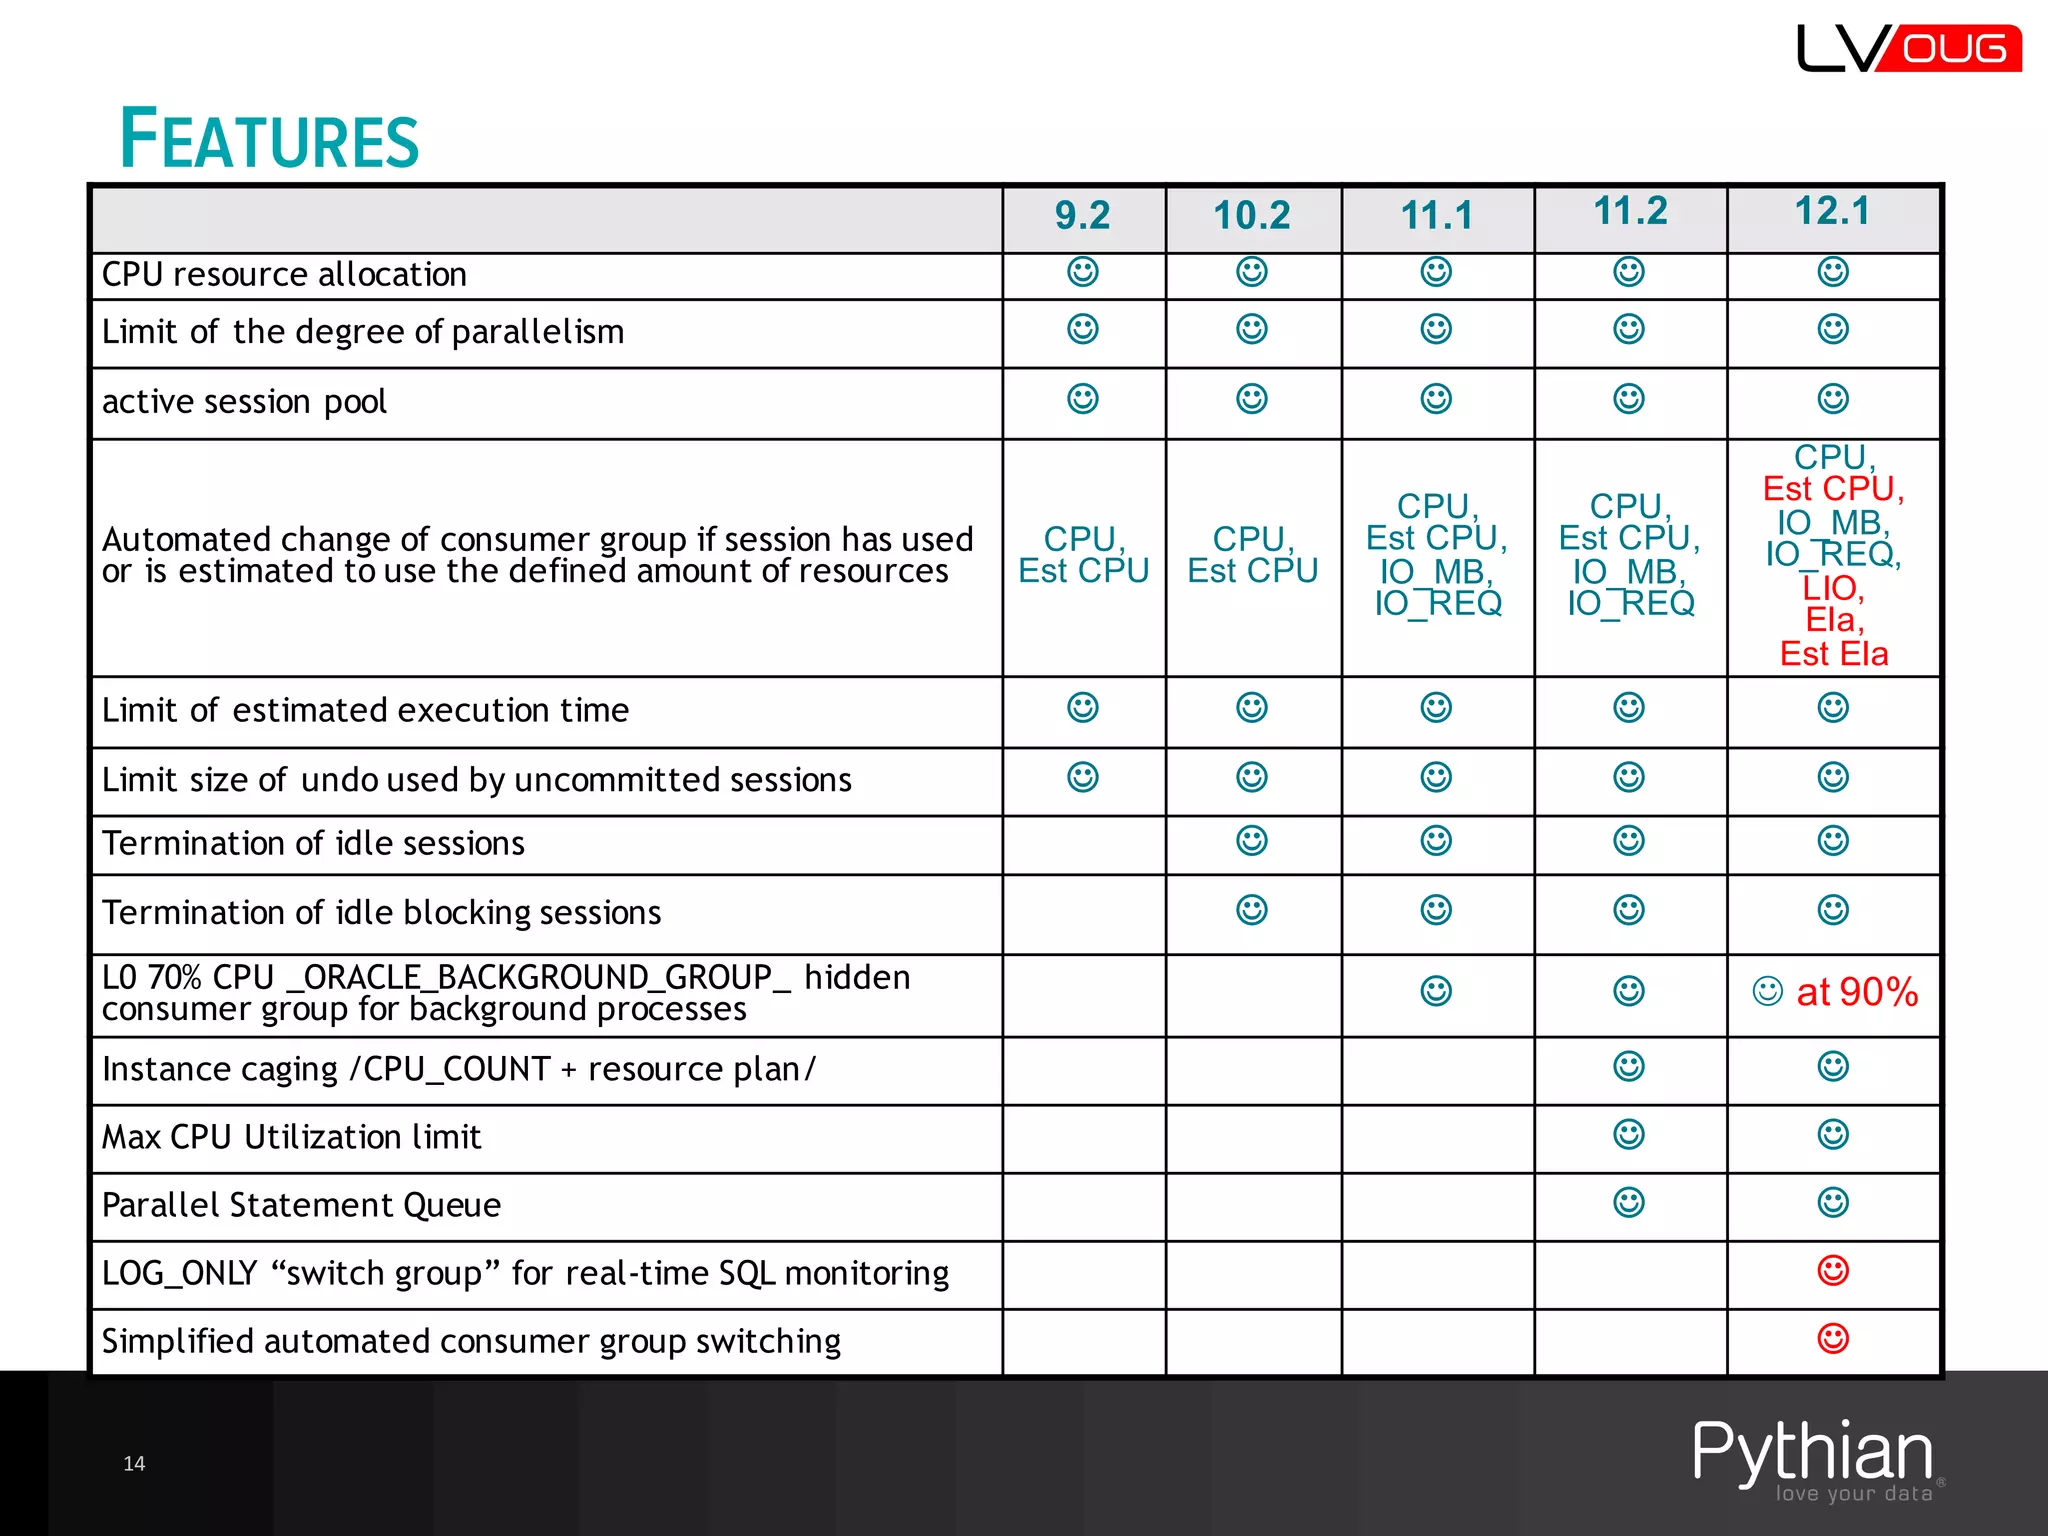
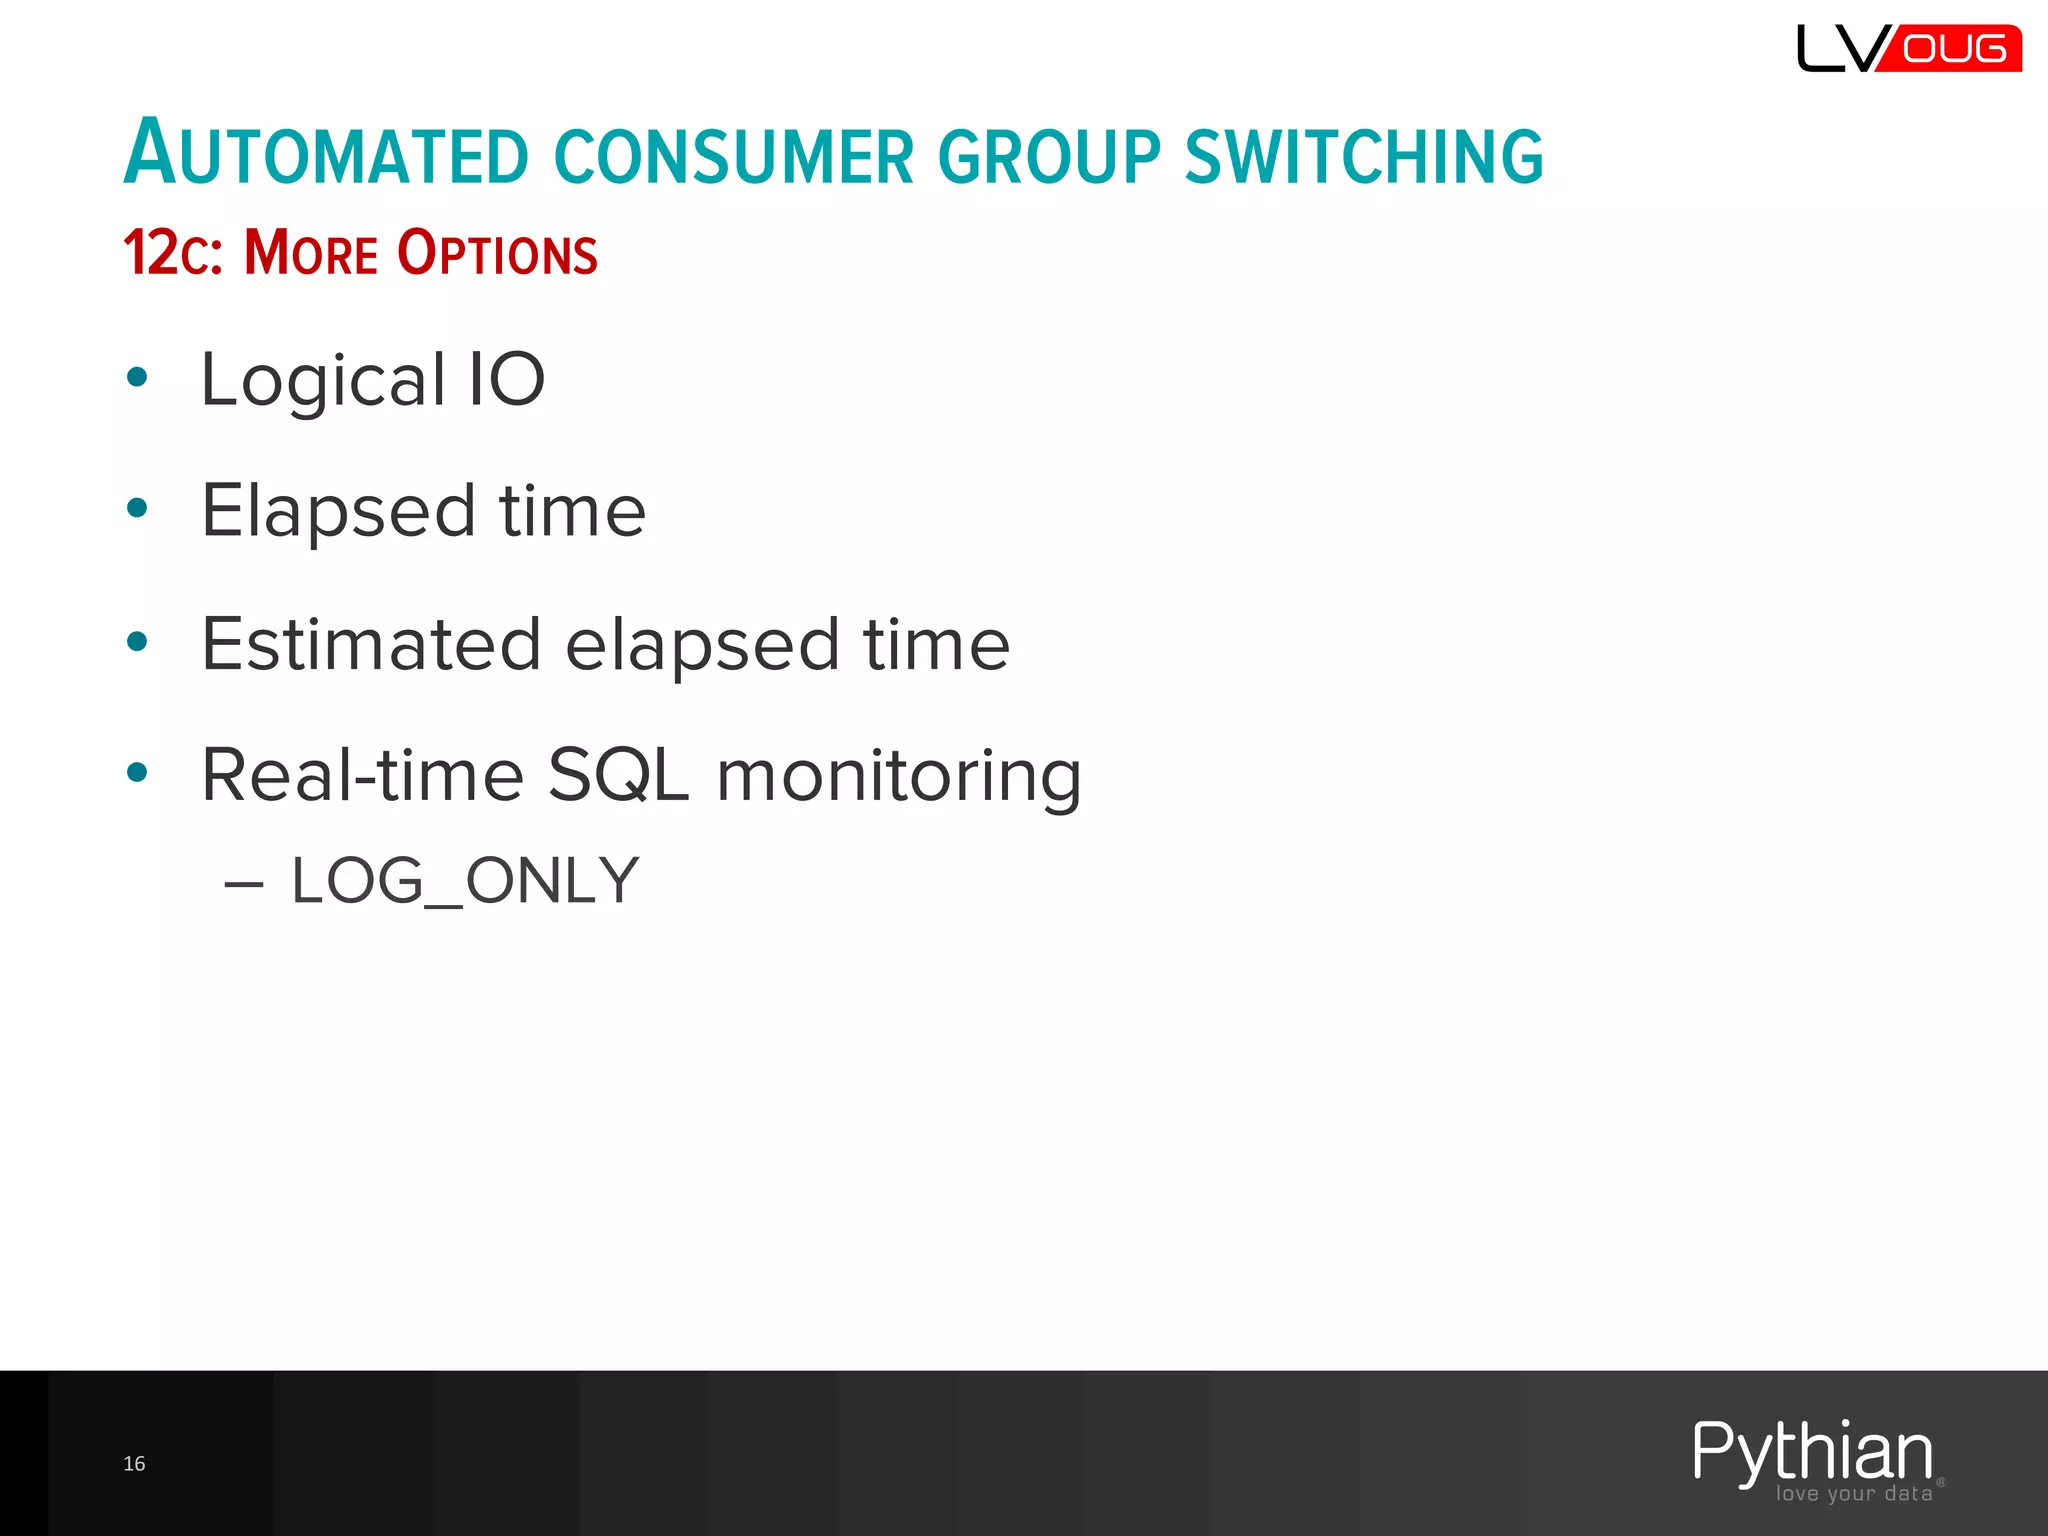
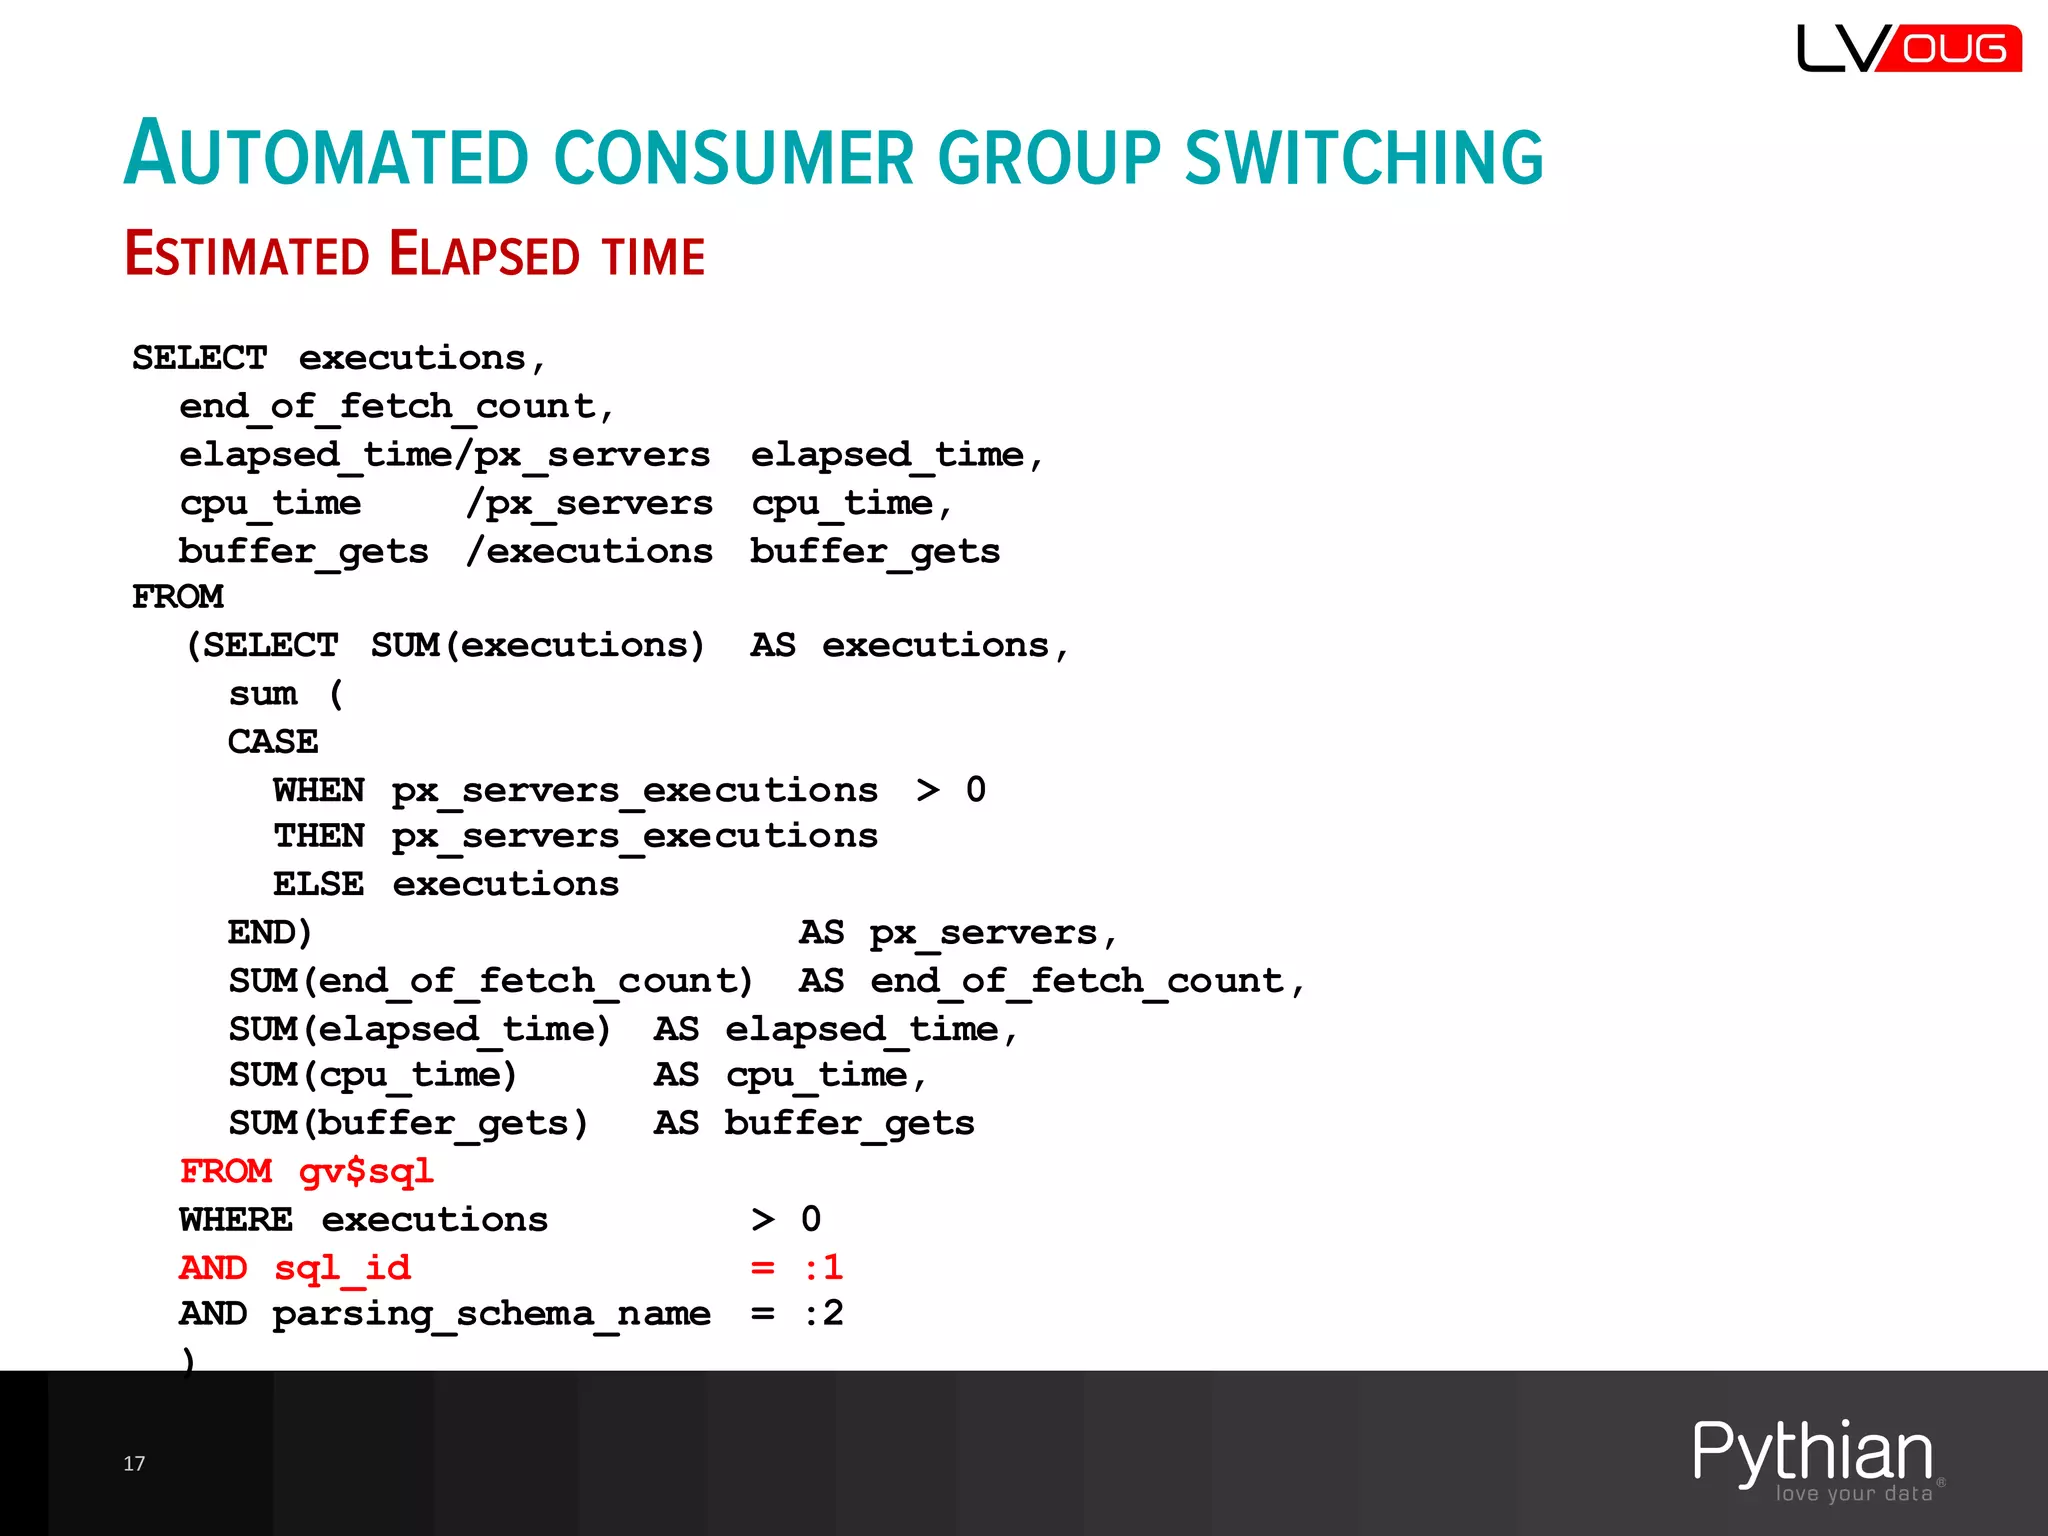
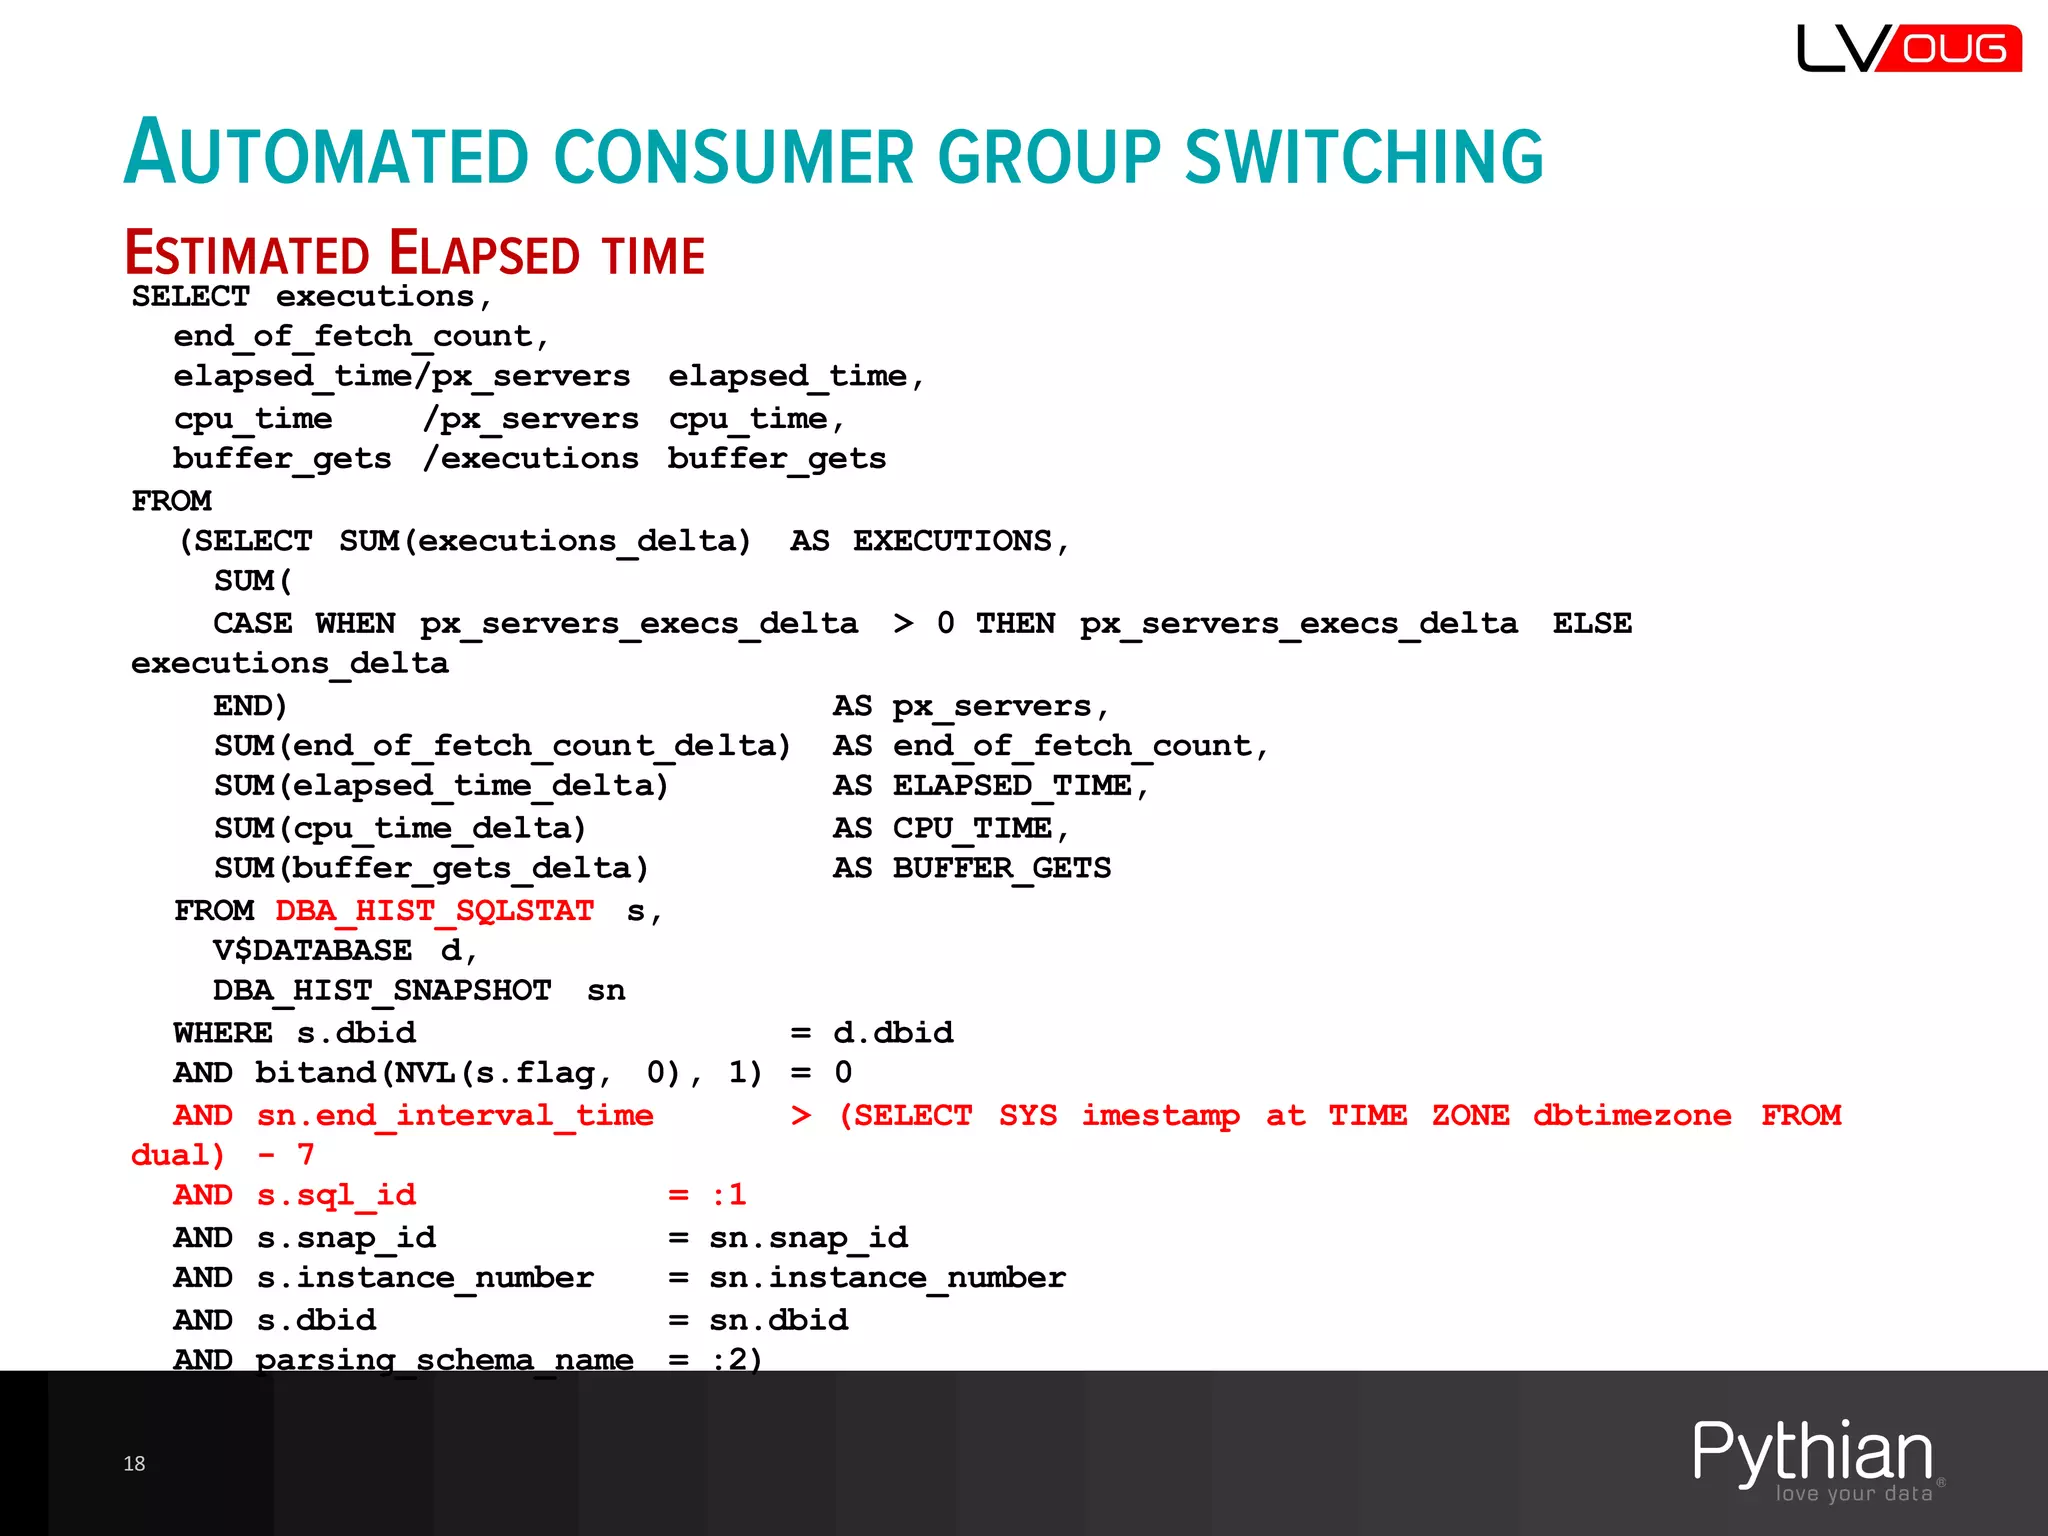
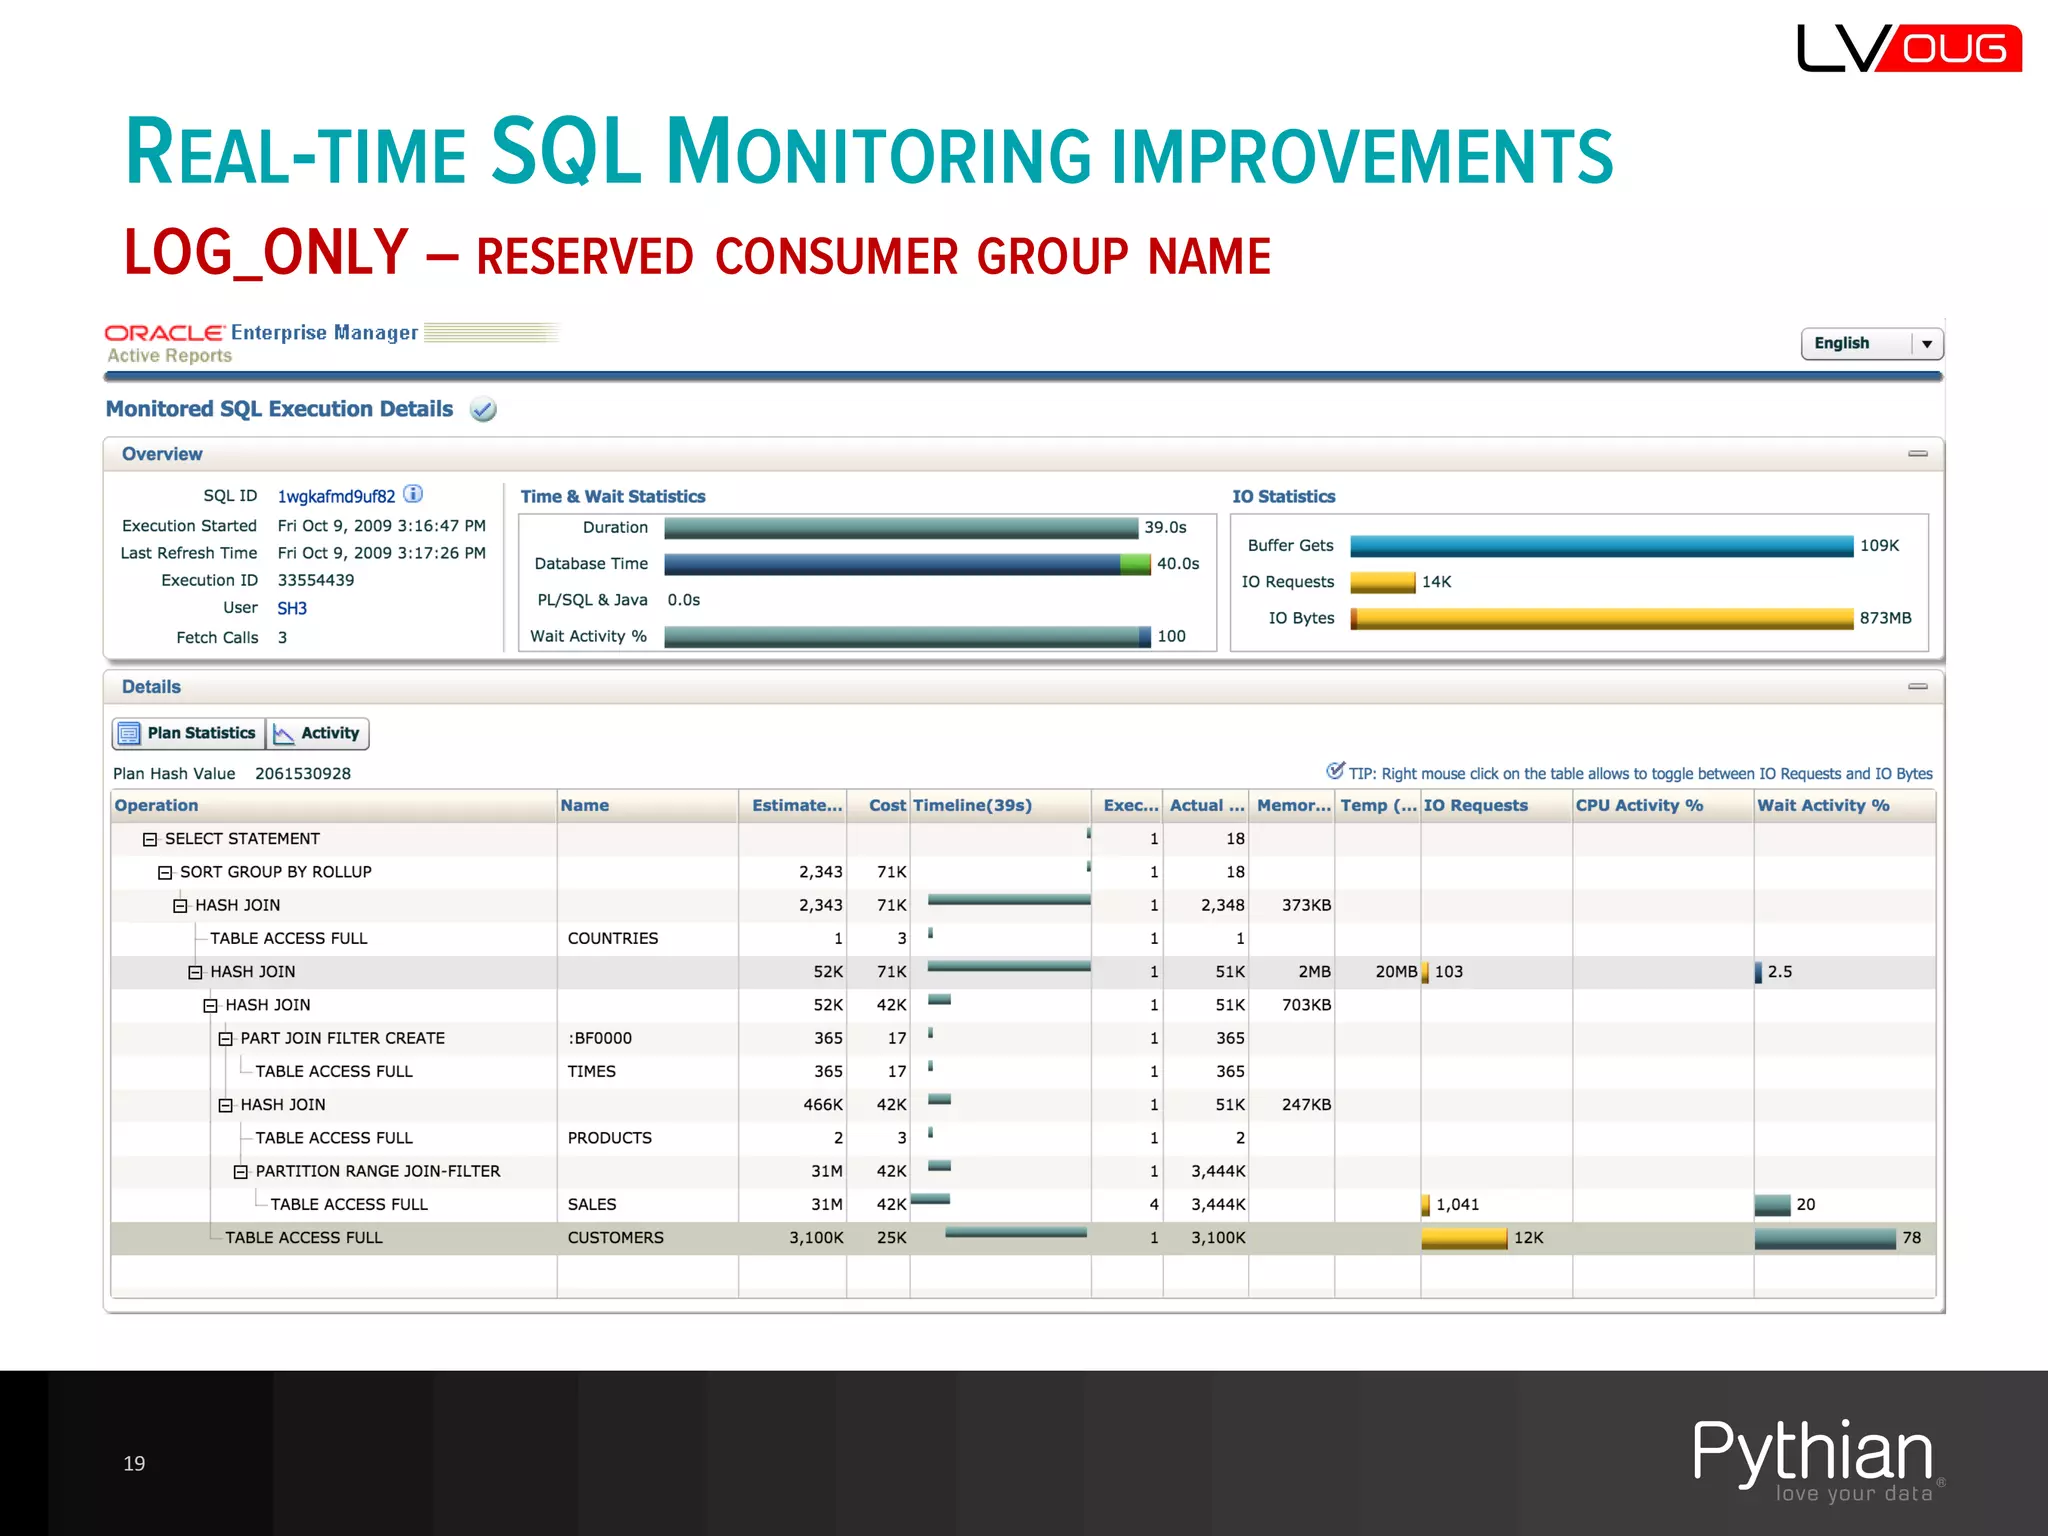
Introduction of new 12c features like automated consumer group switching, enhancing resource management.
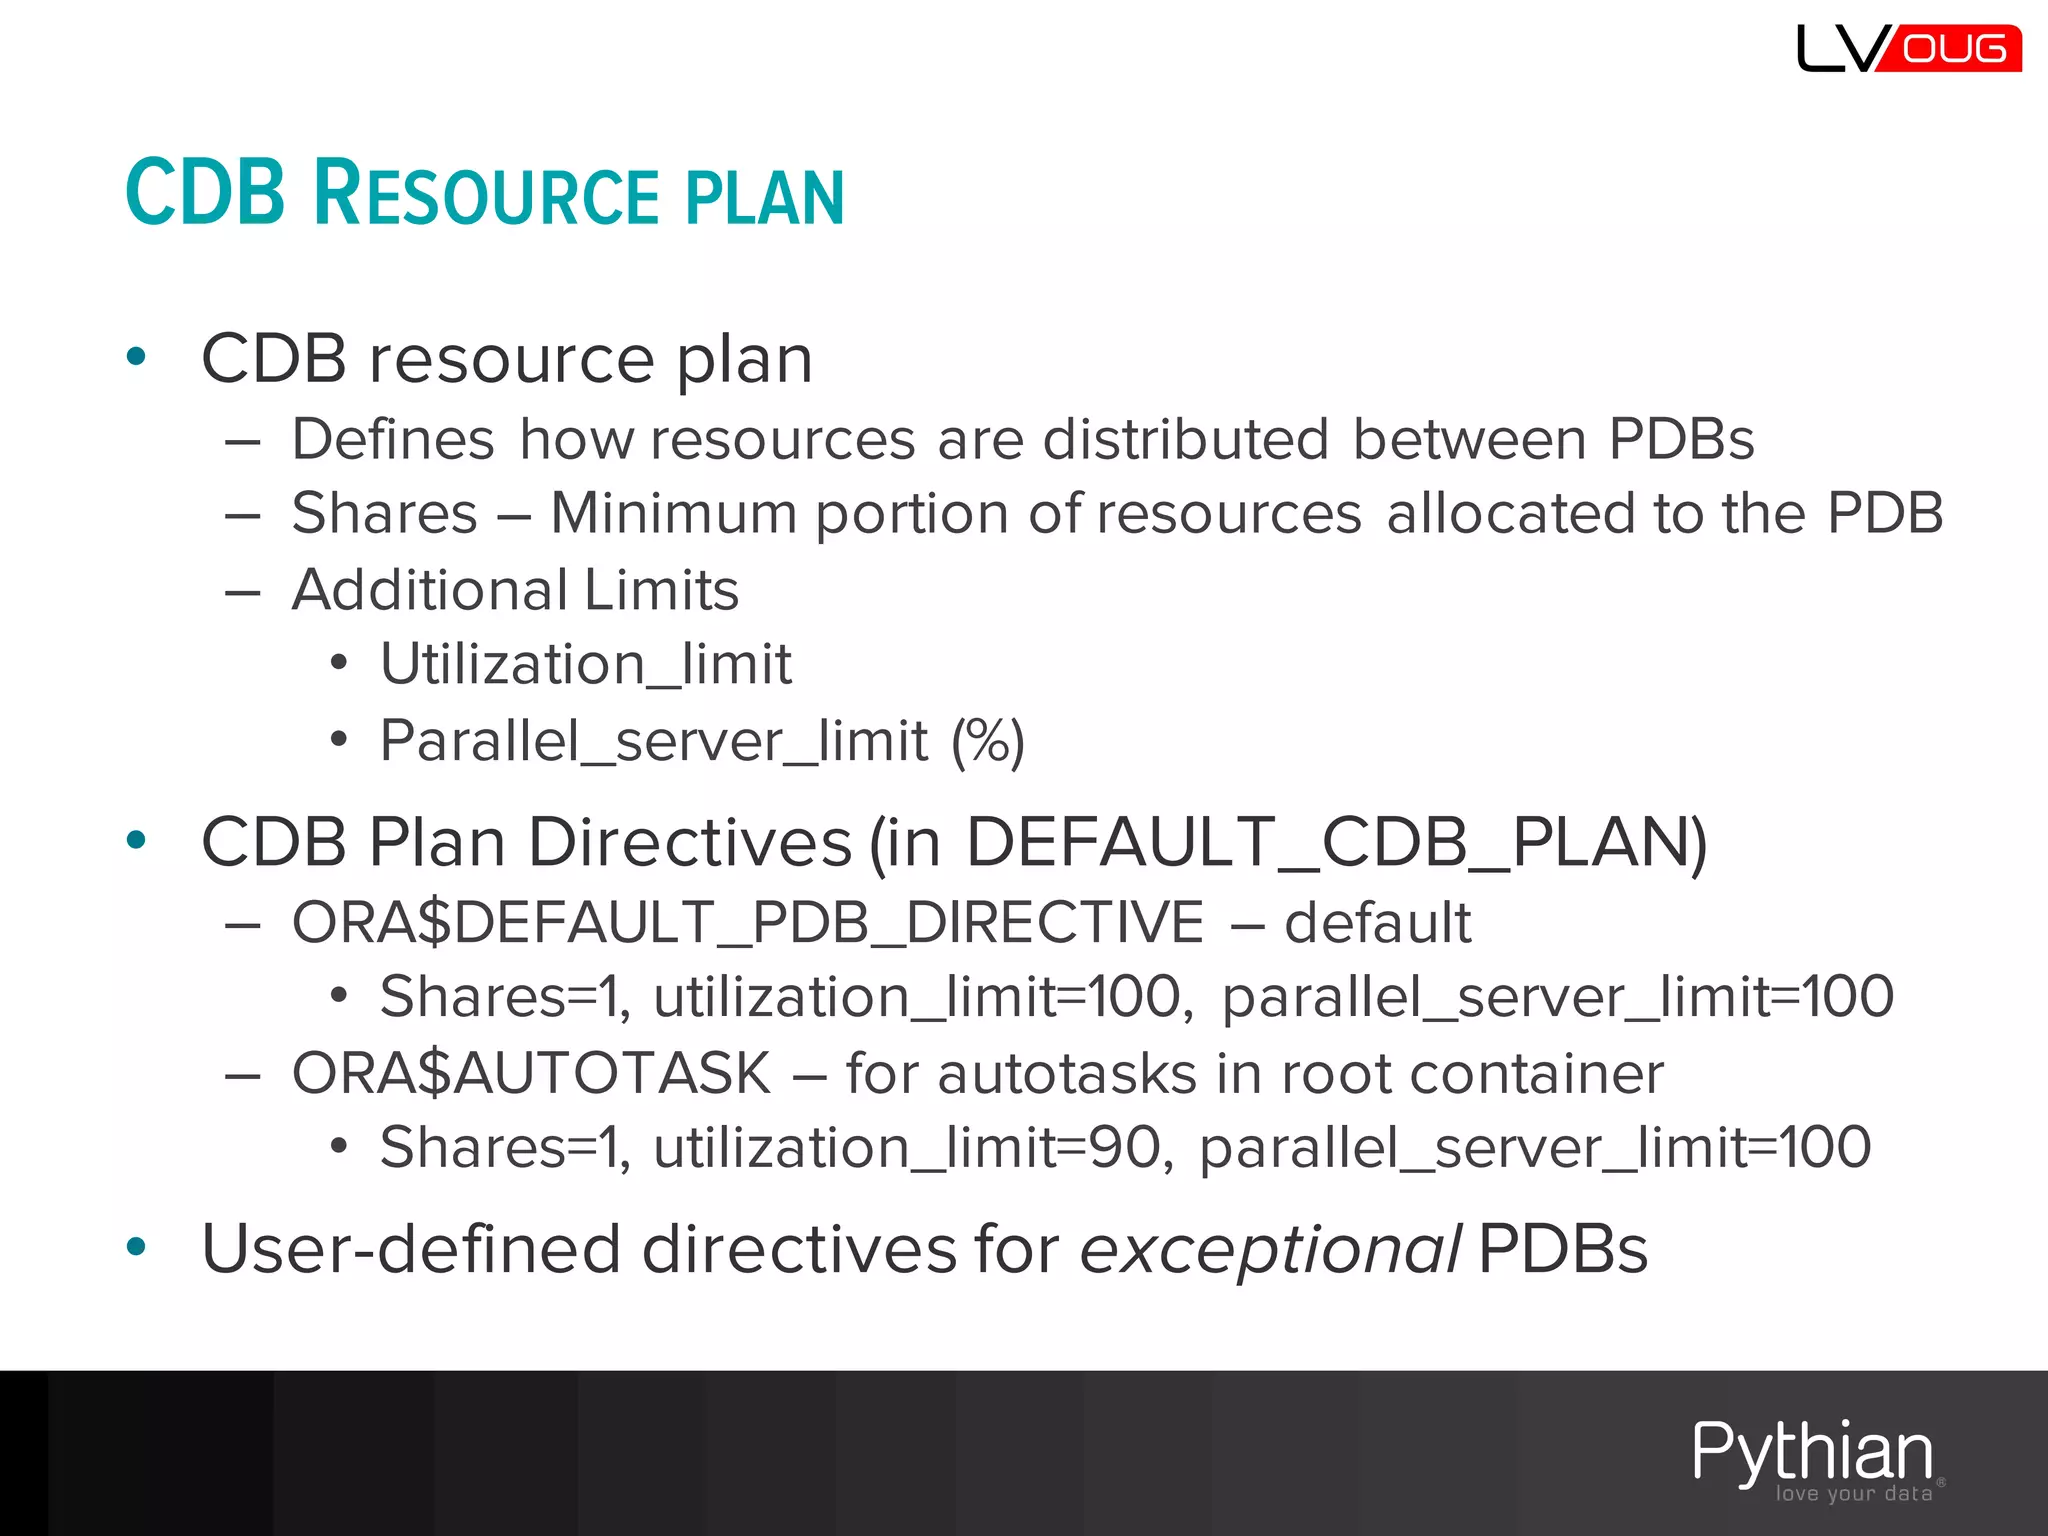
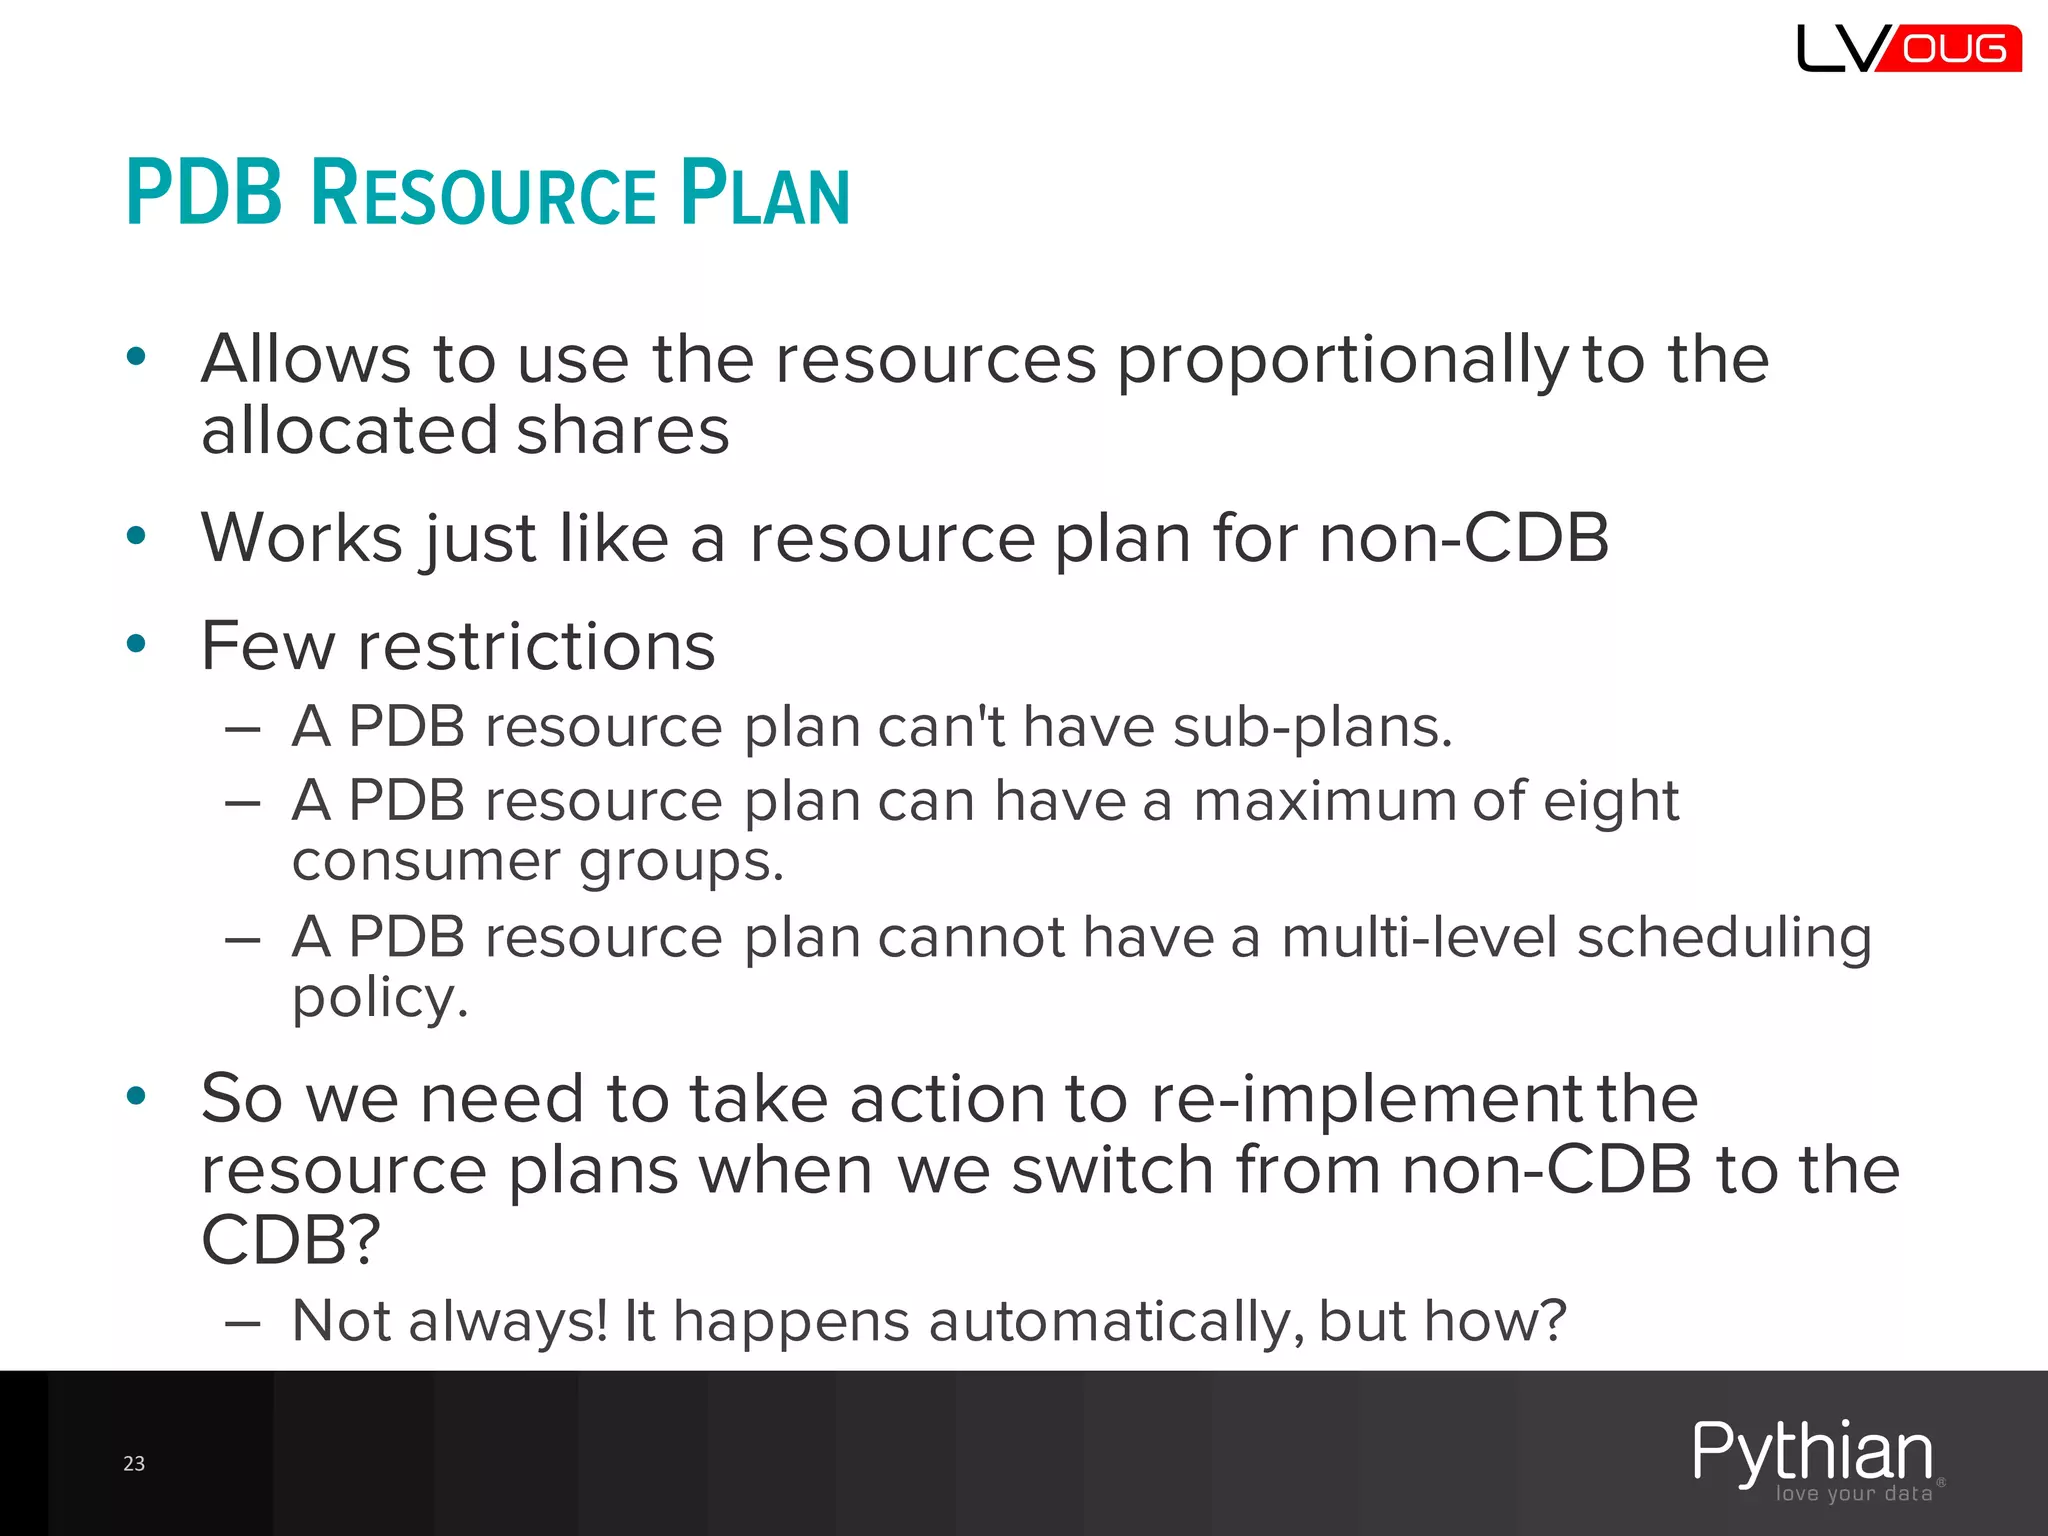
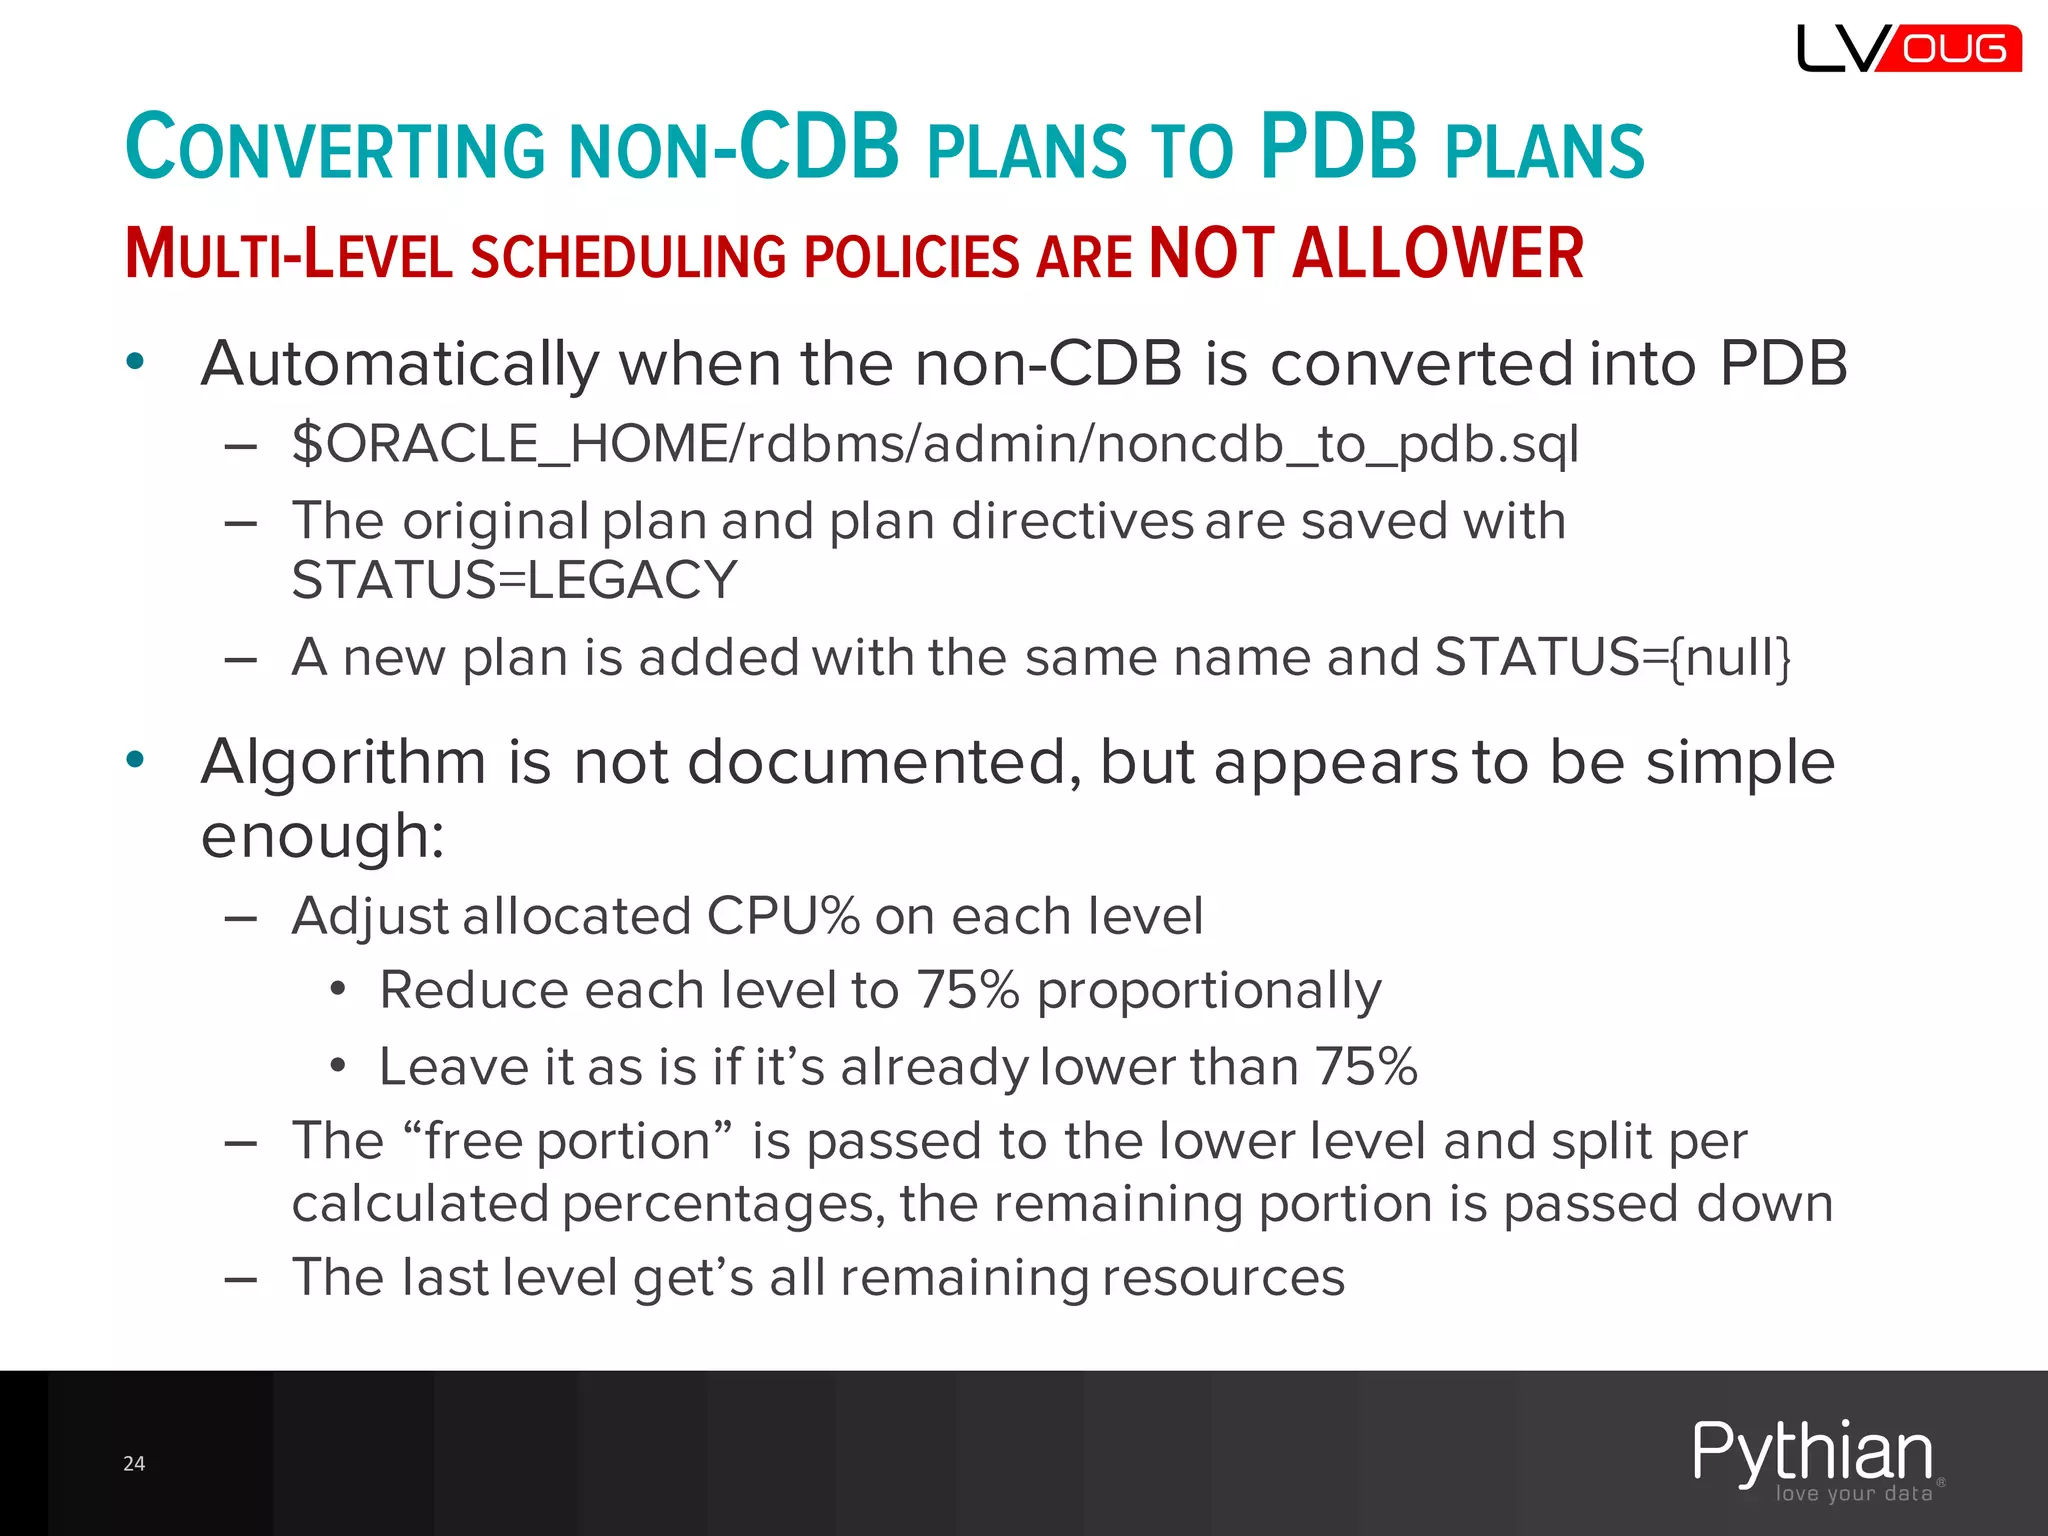
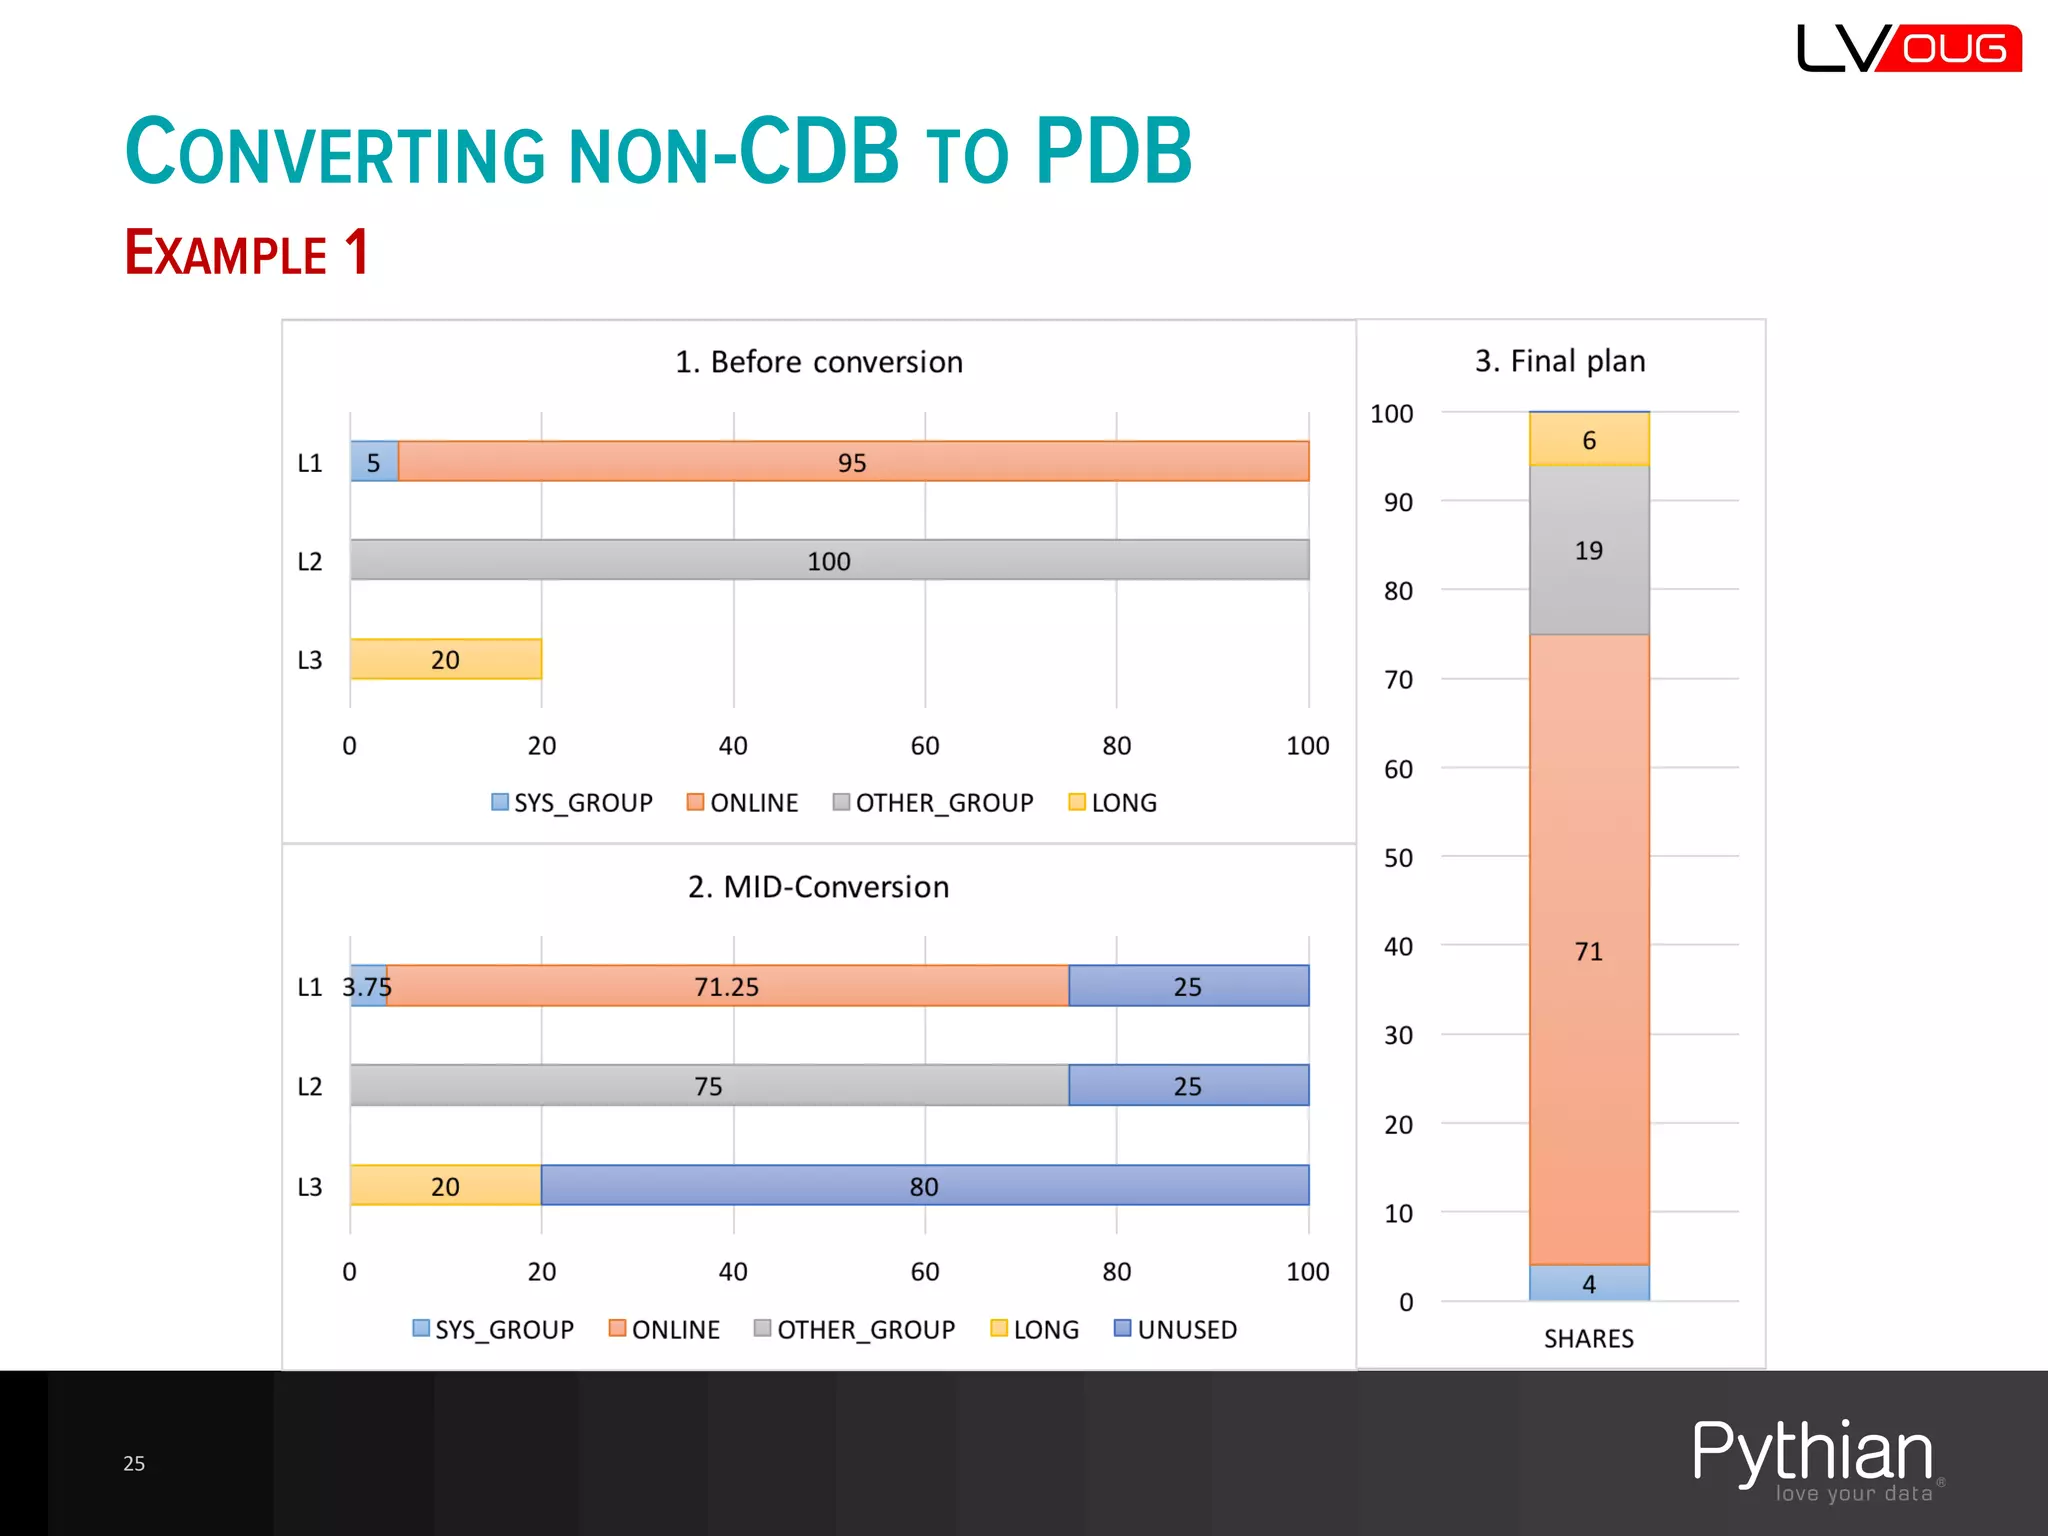
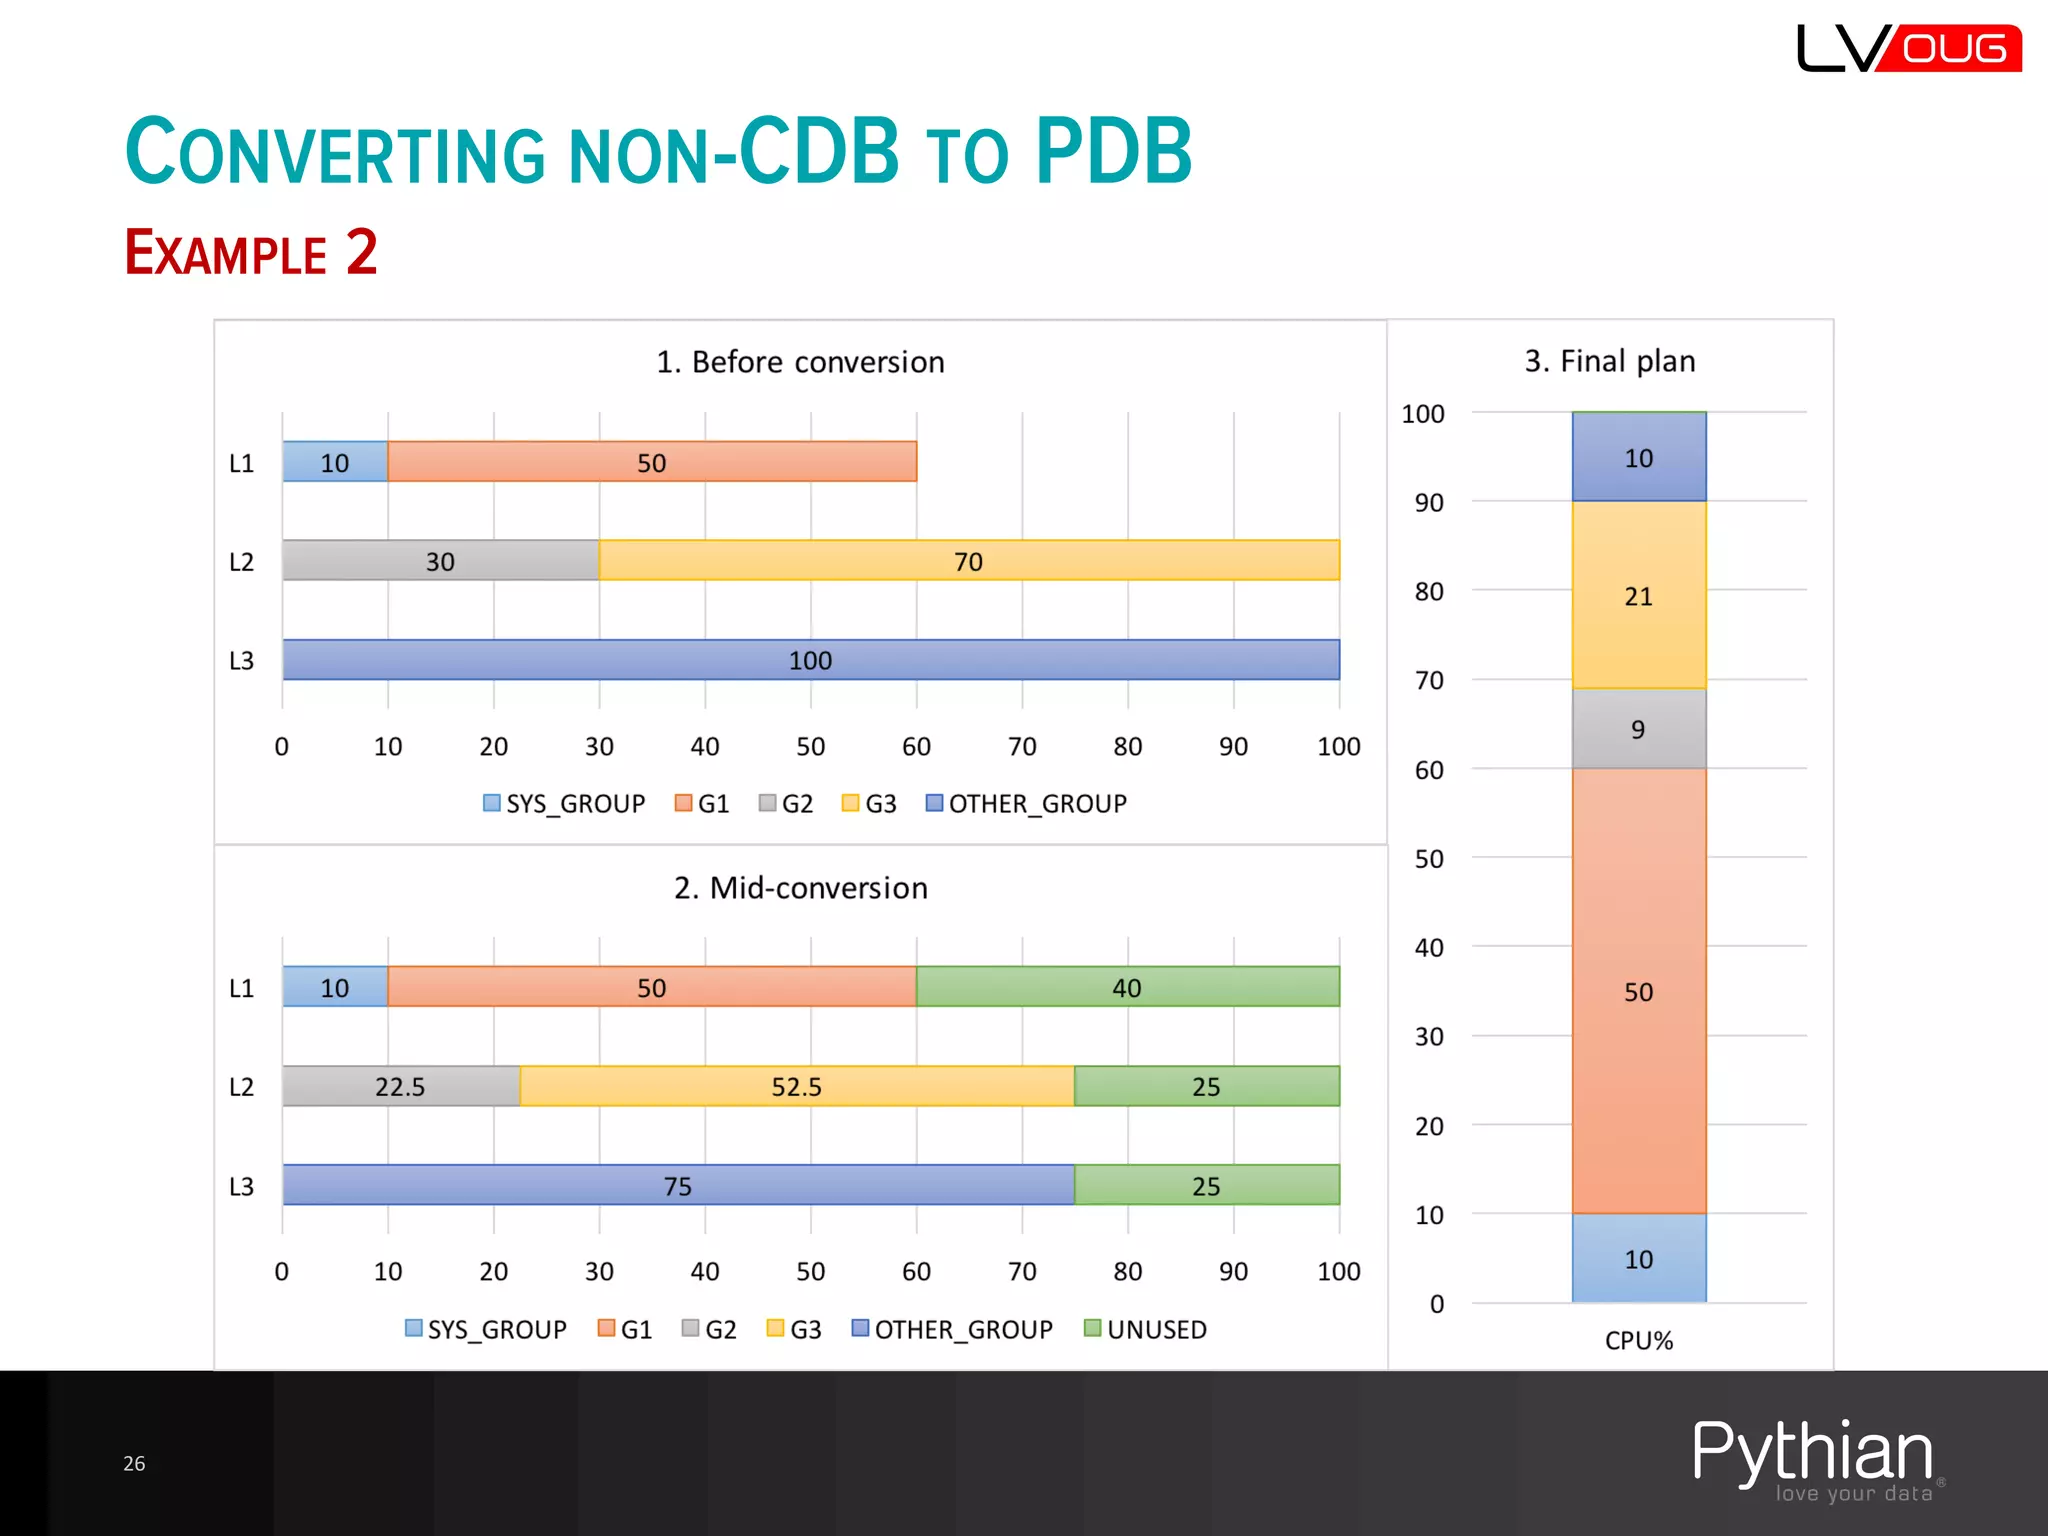
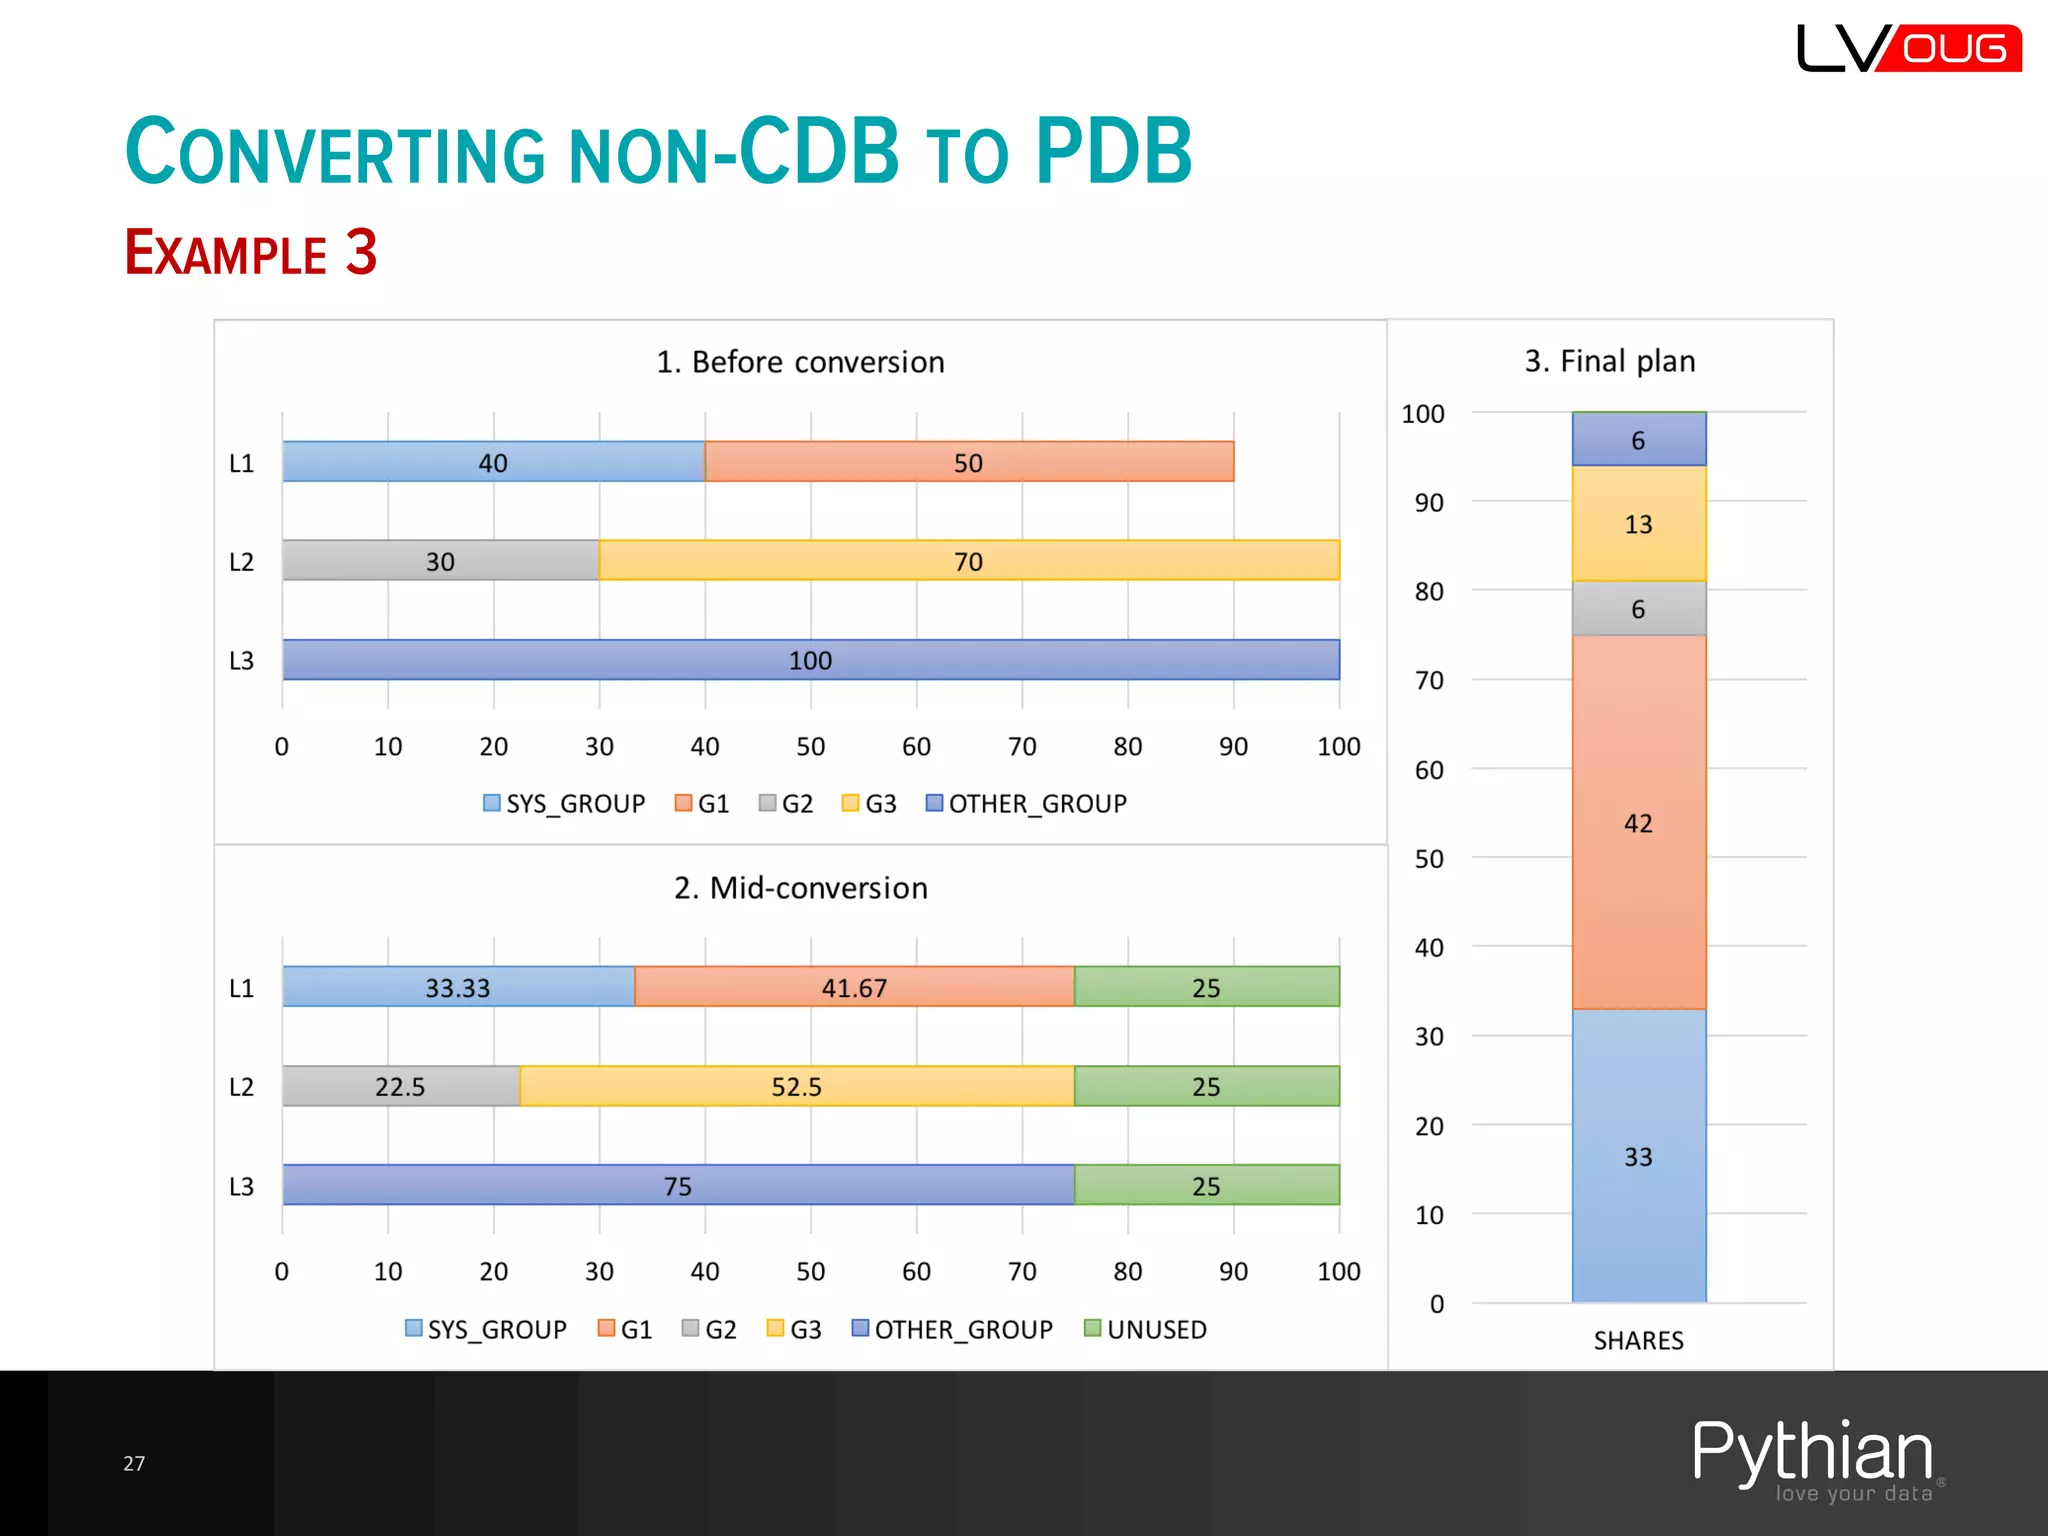
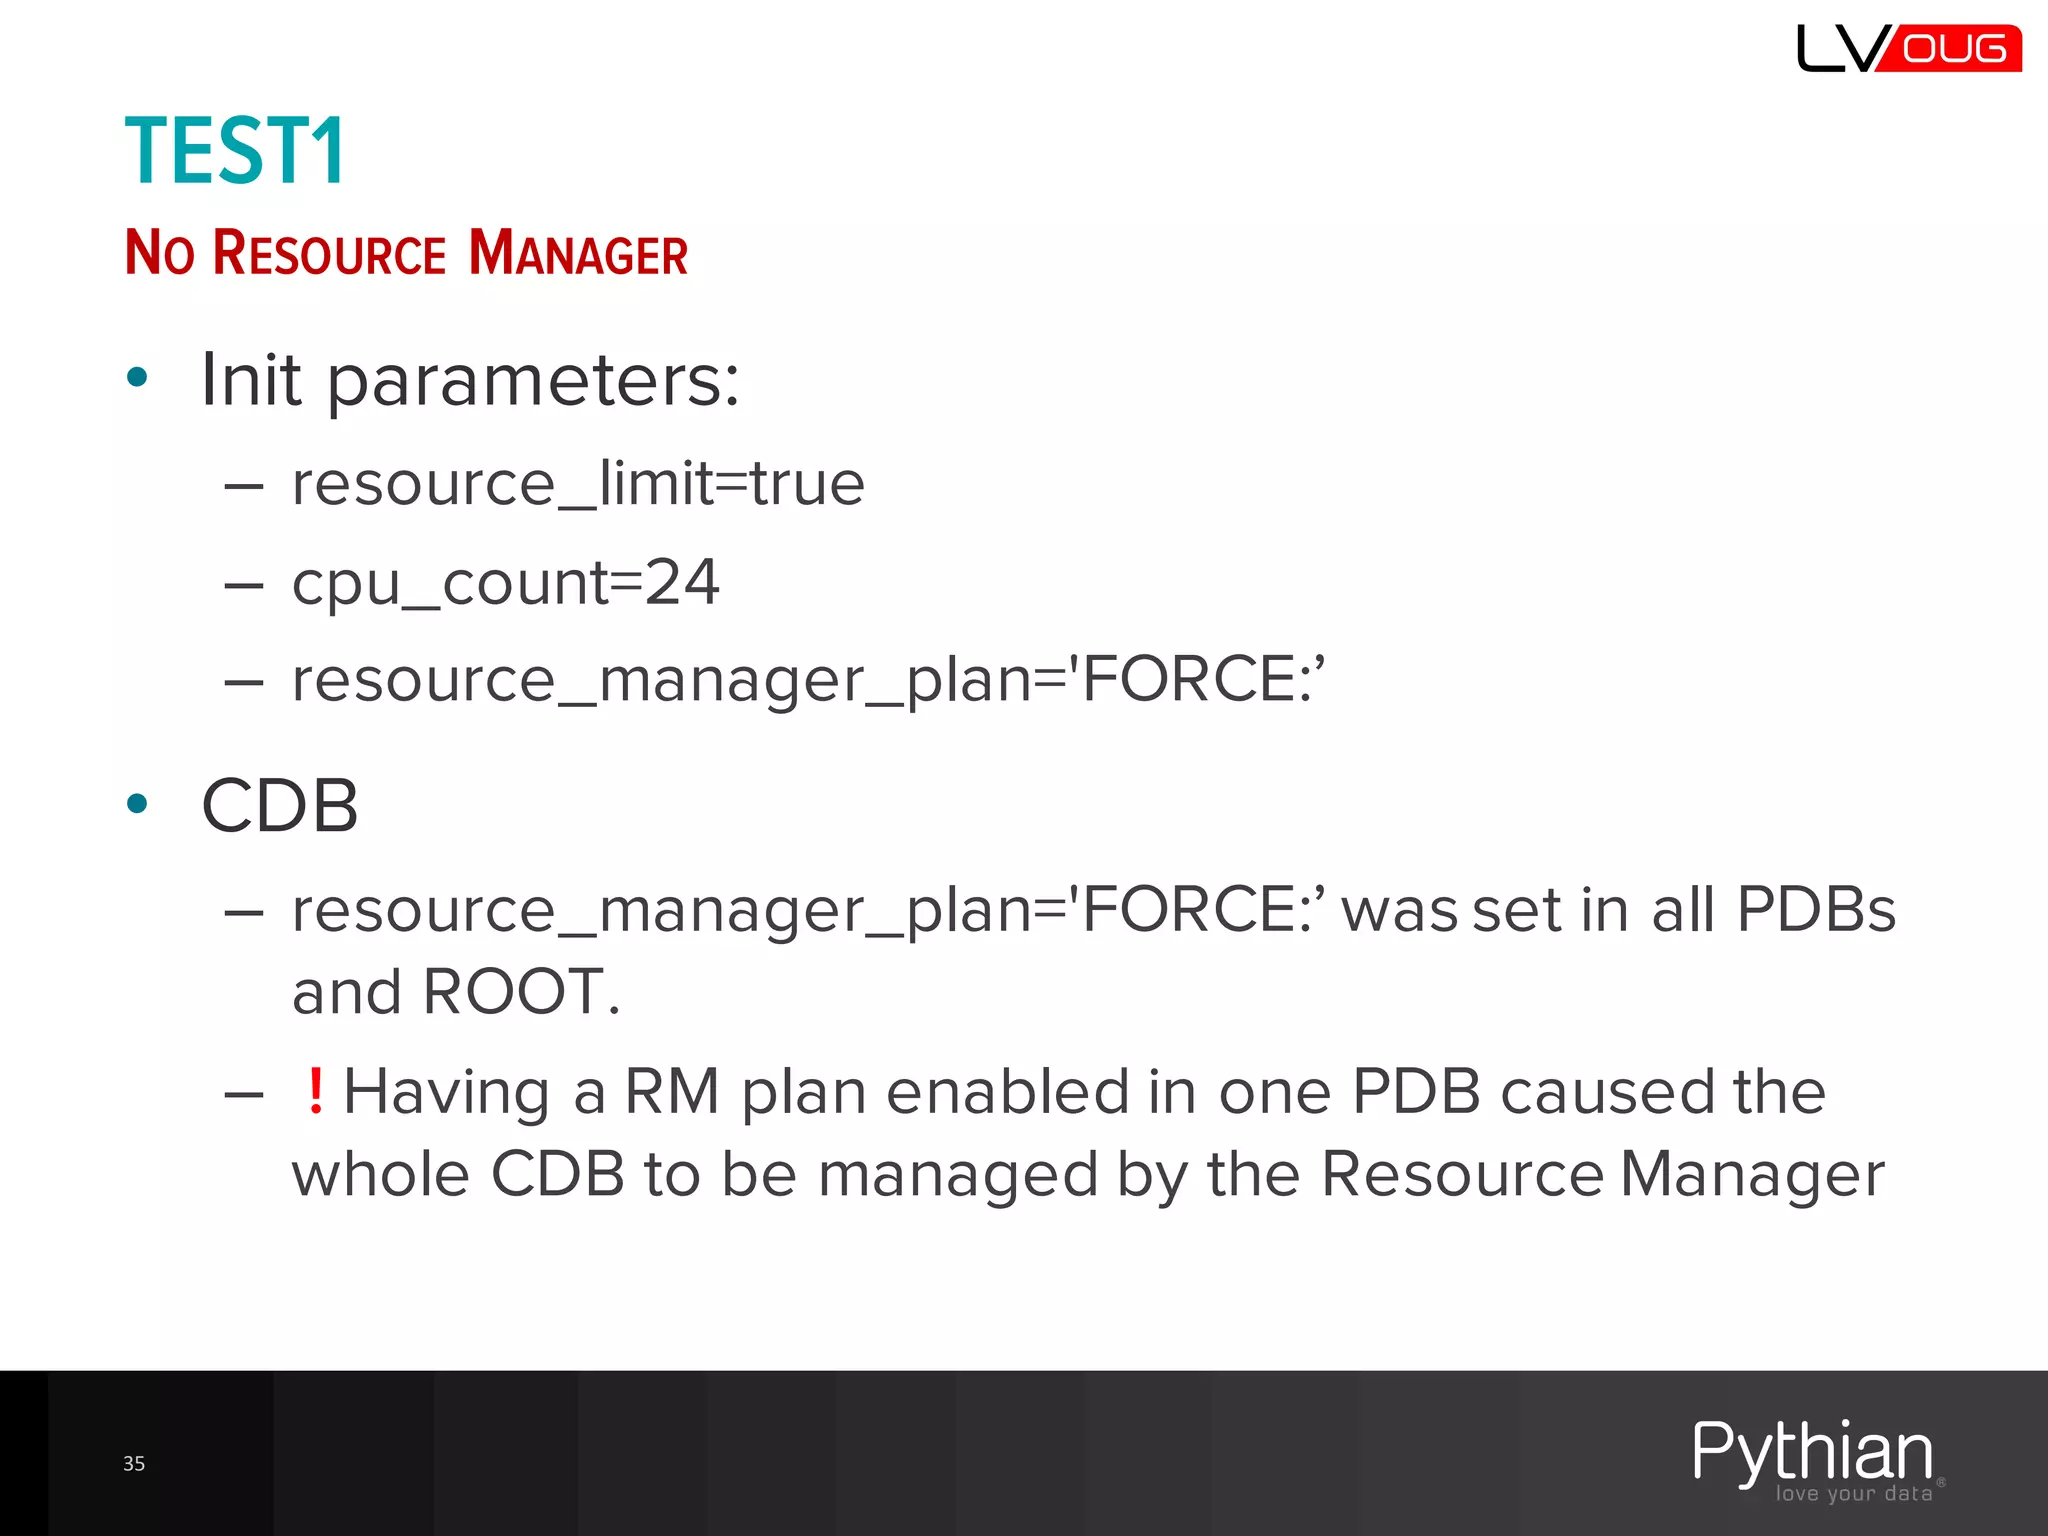
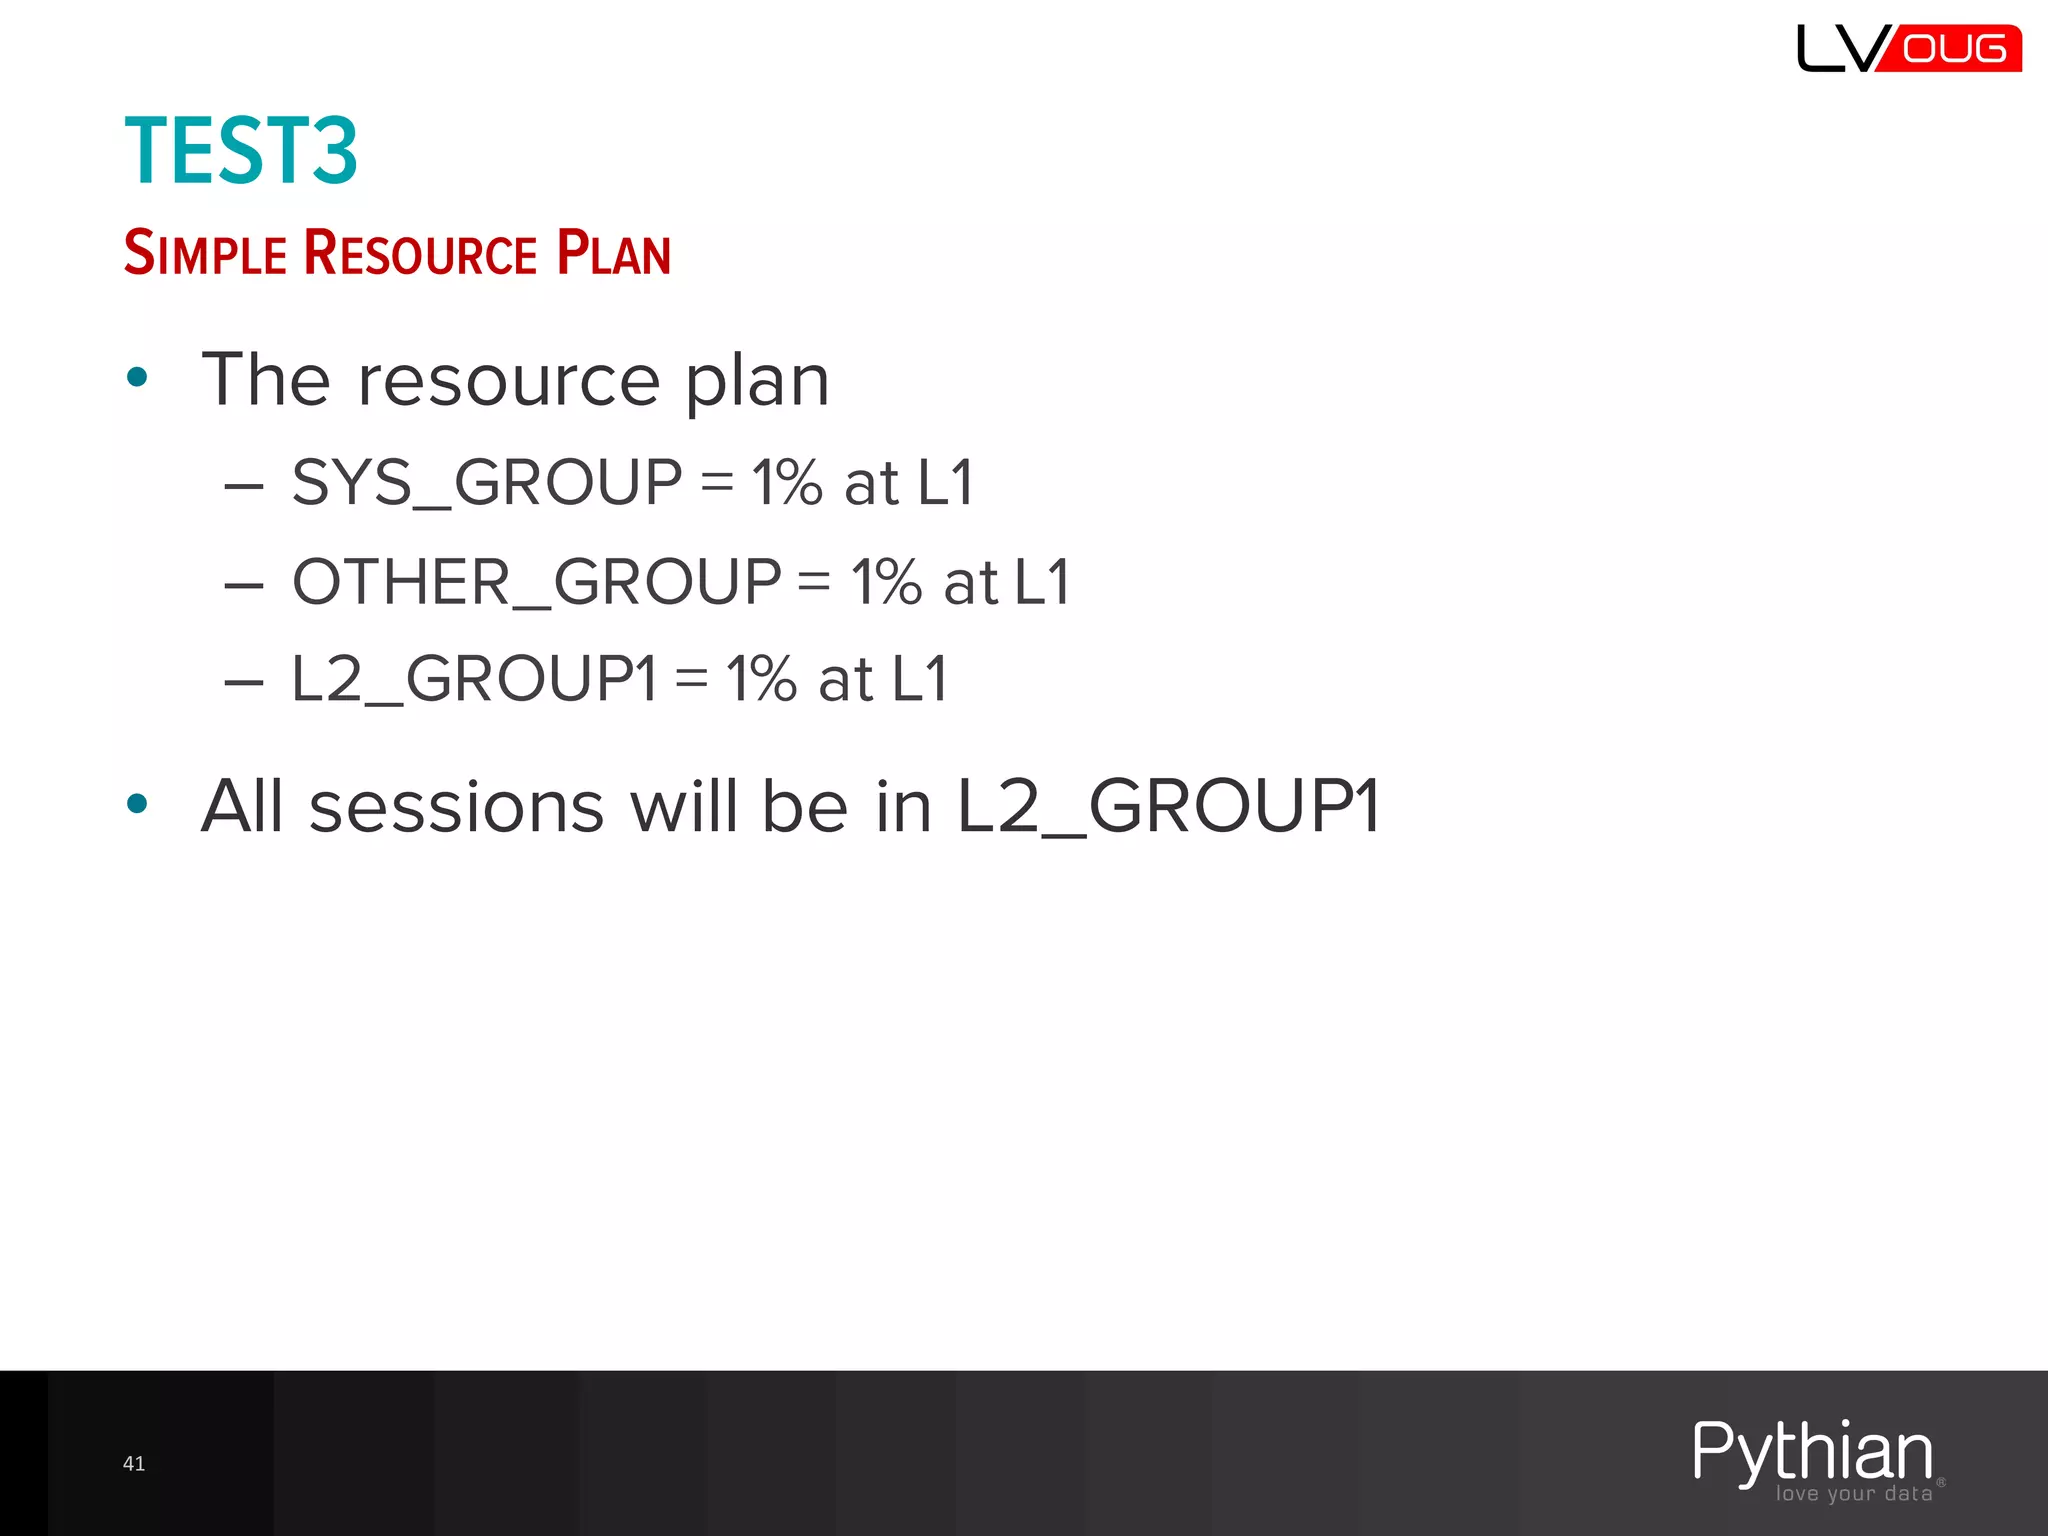
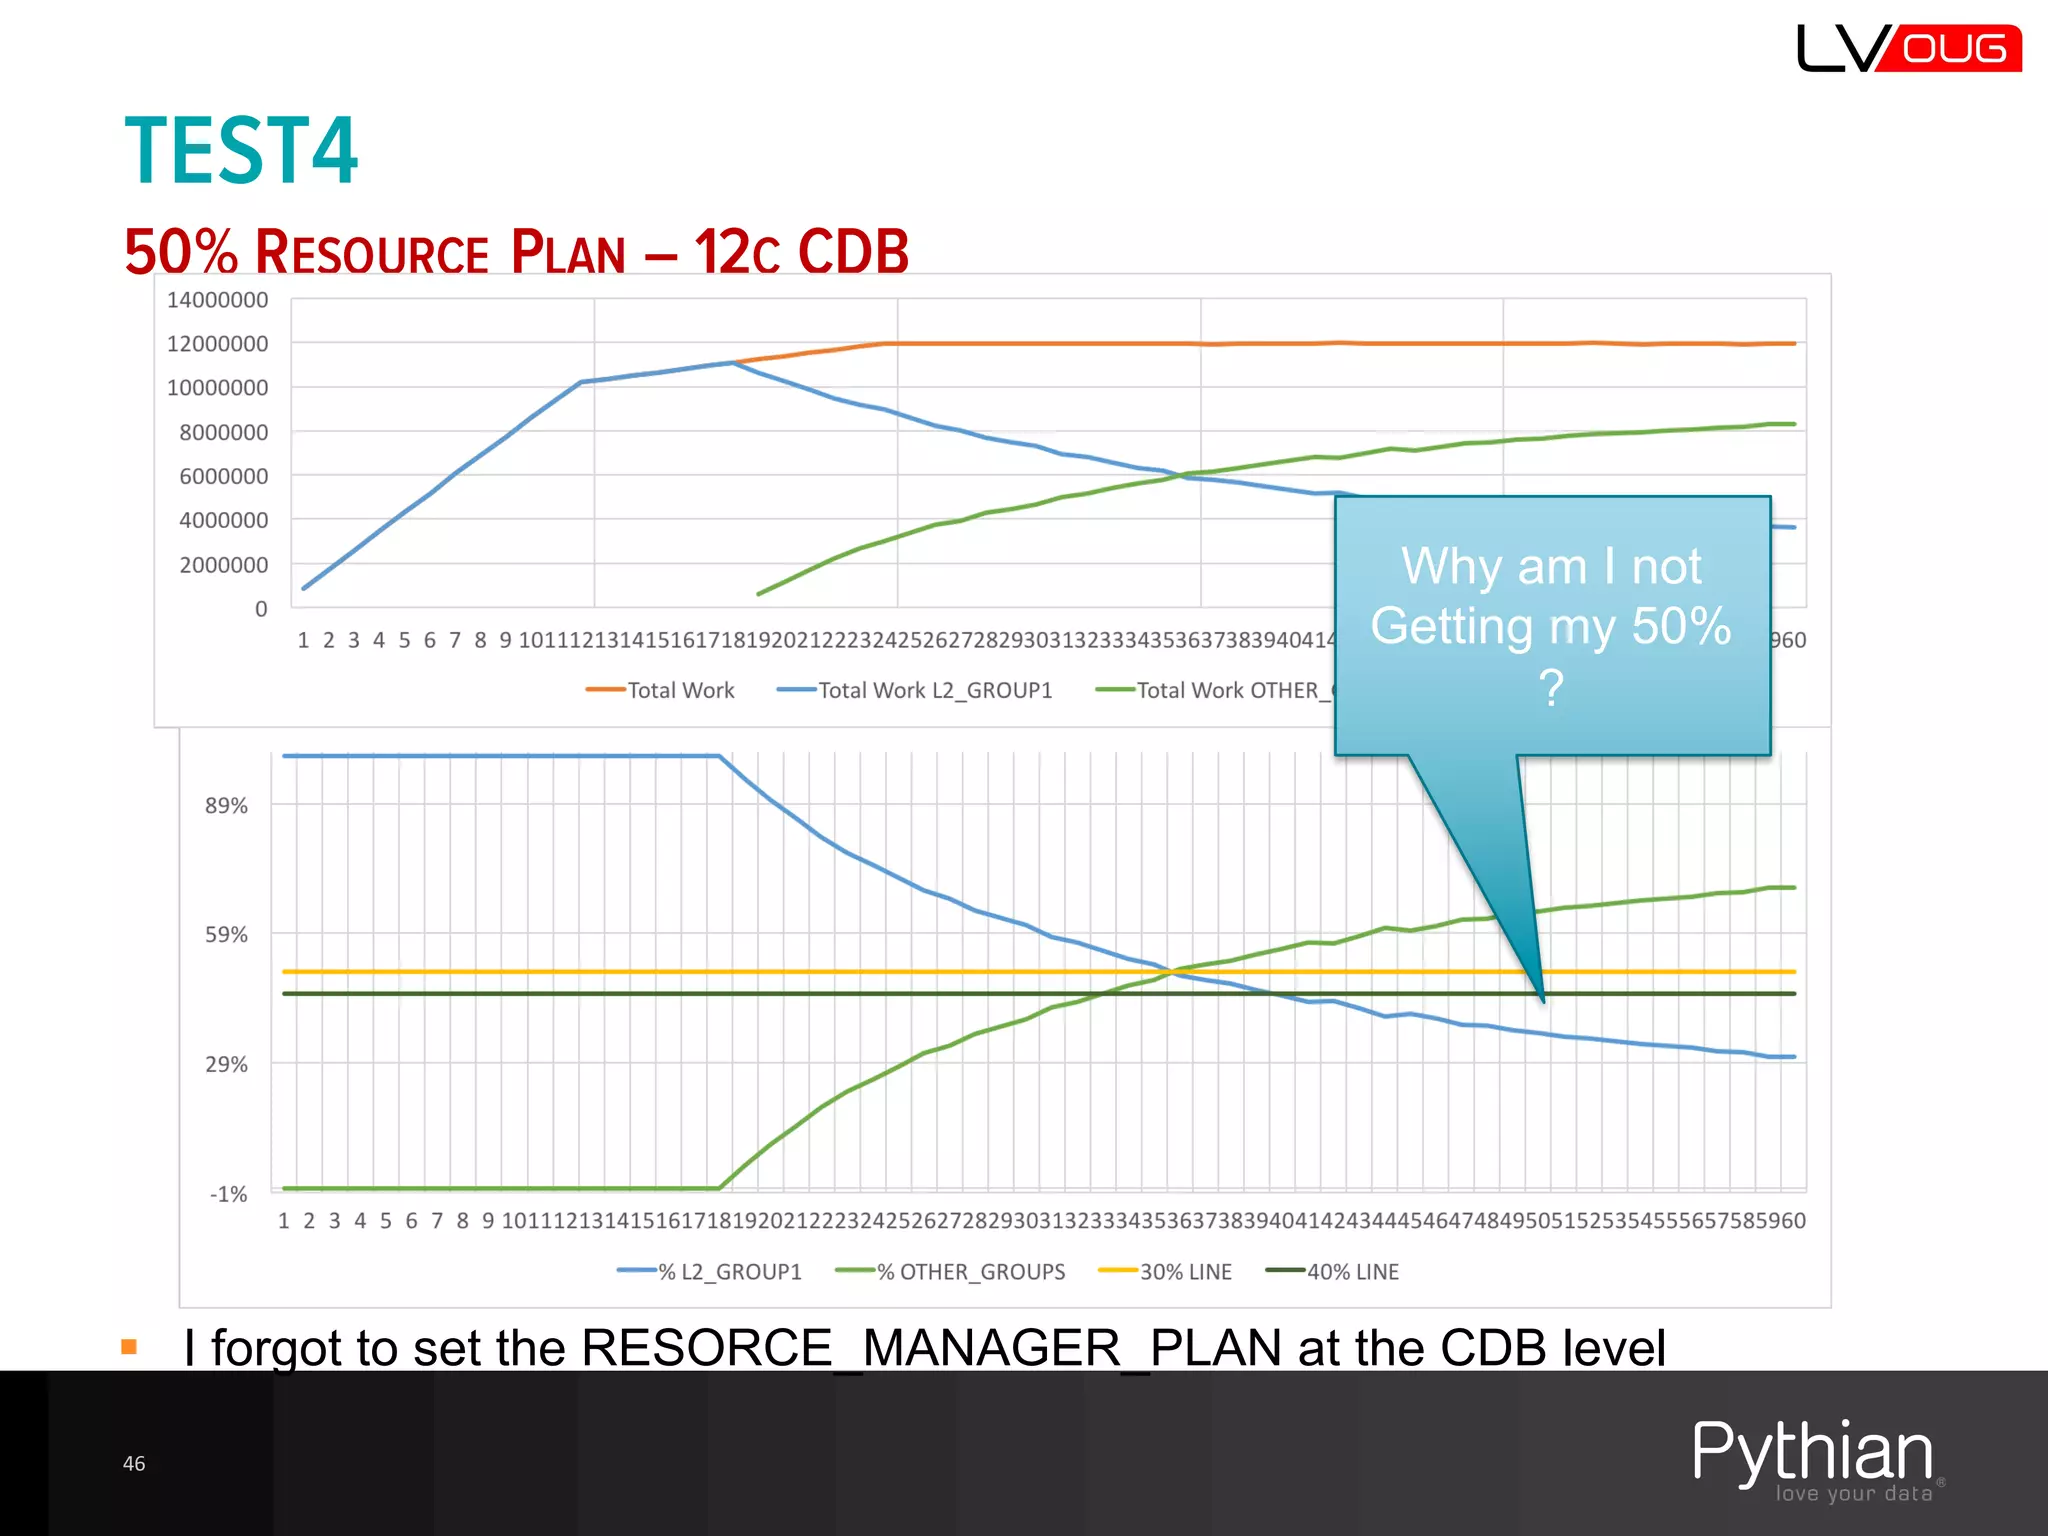
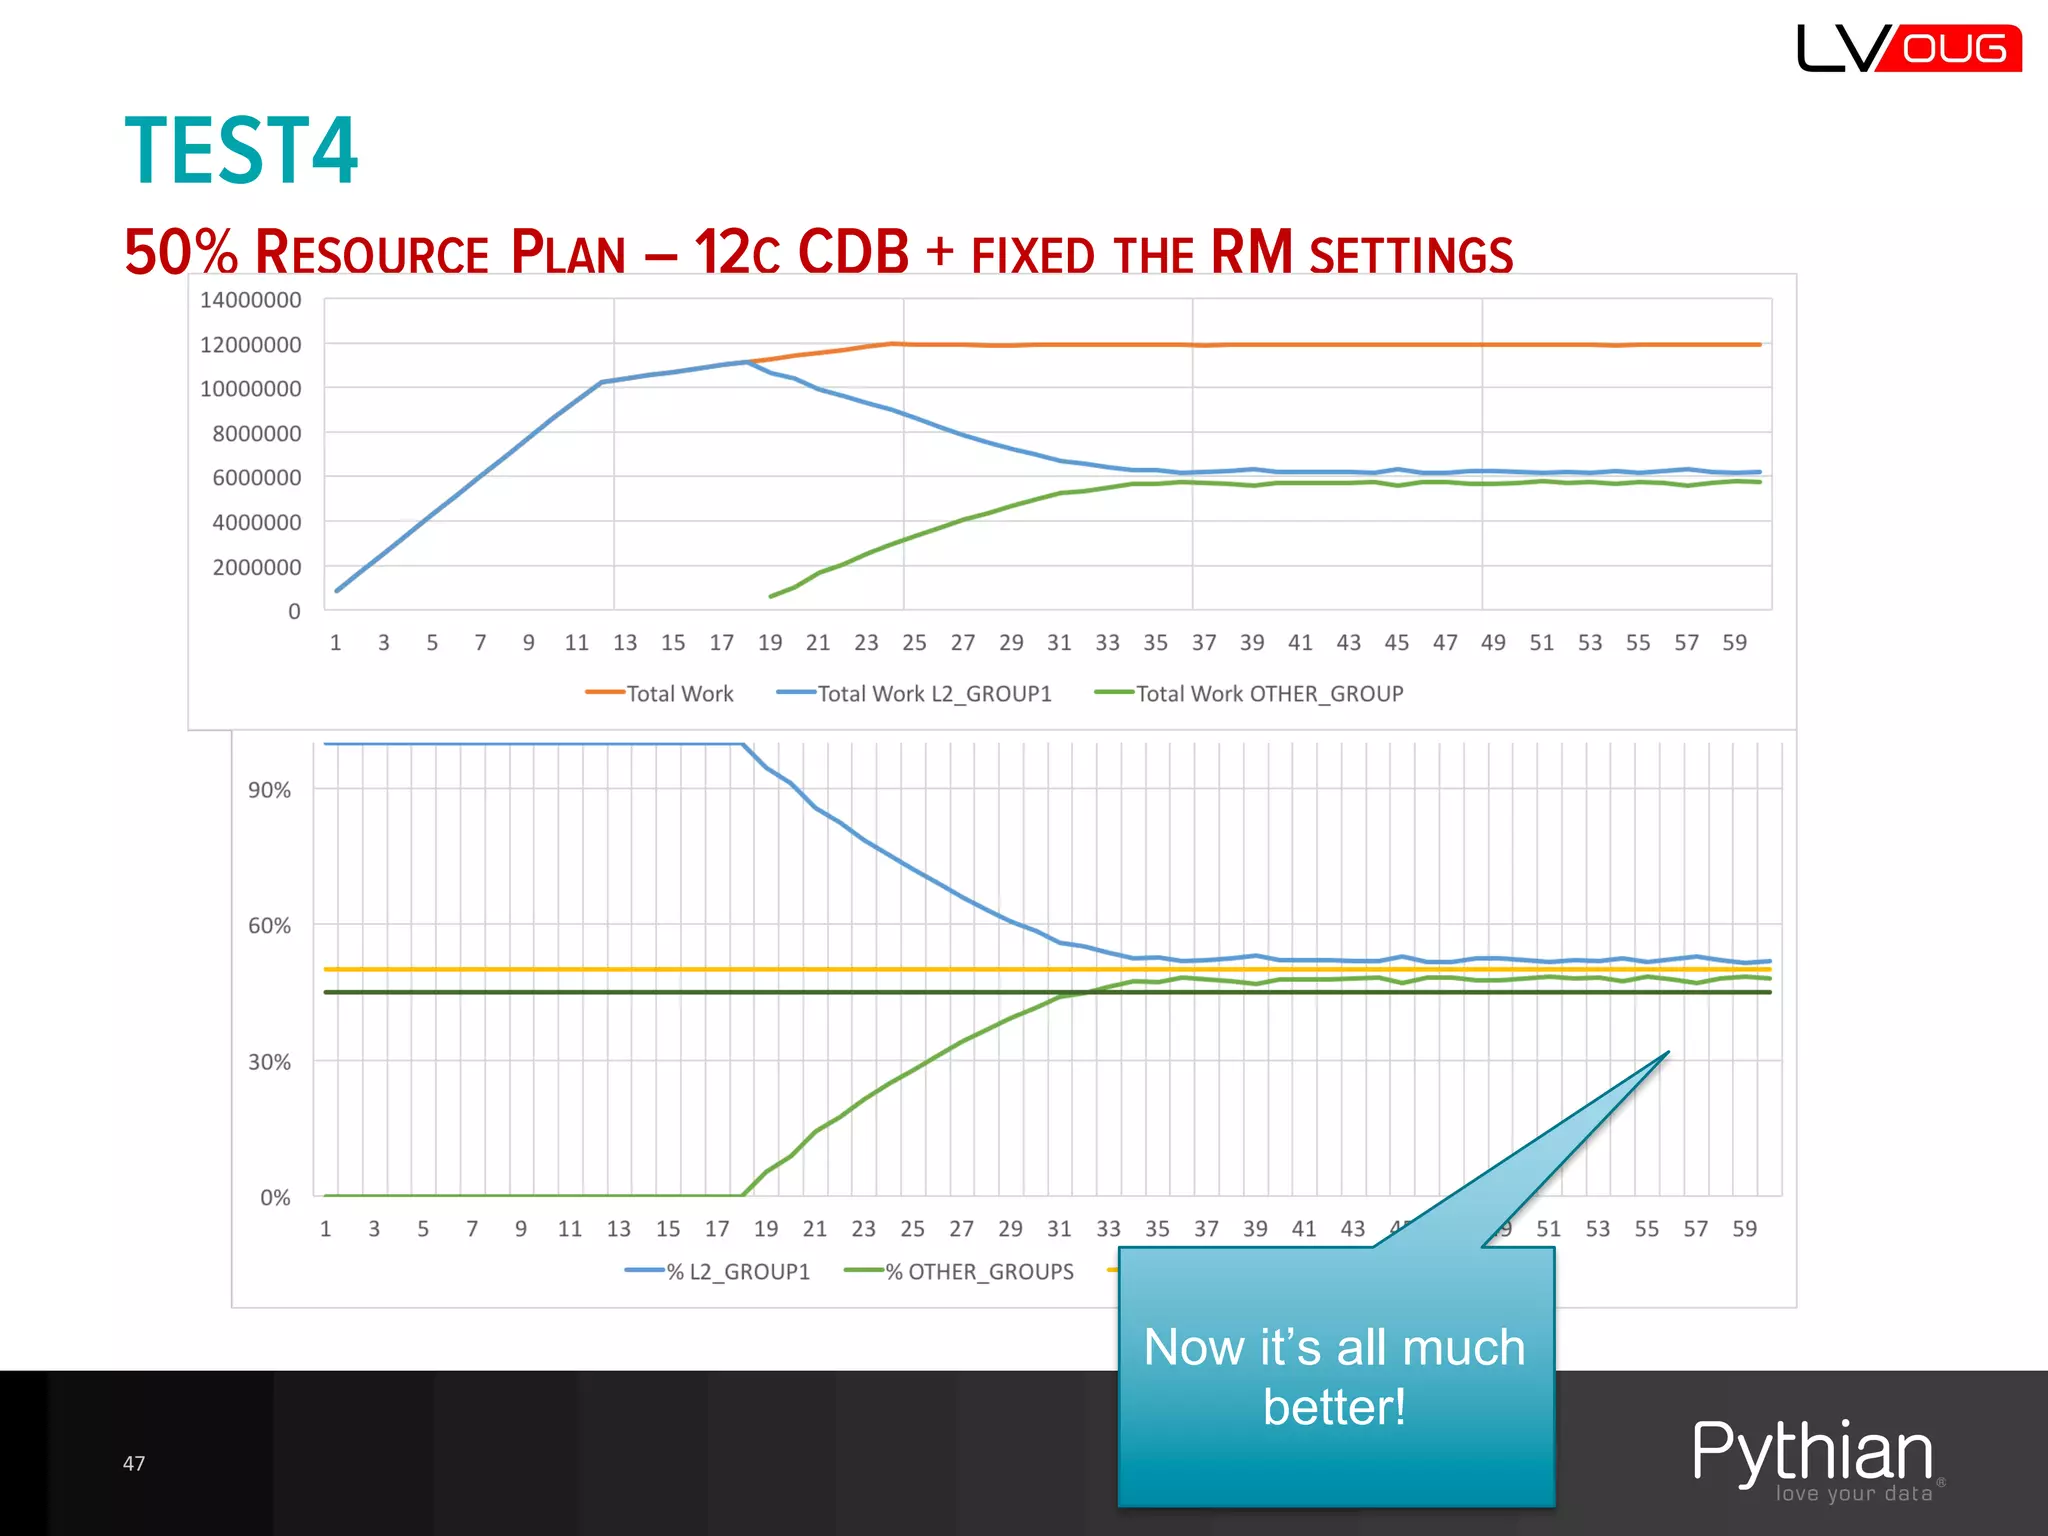
Explanation of CDB and PDB resource plans, the distribution of resources, and conversion from non-CDB.
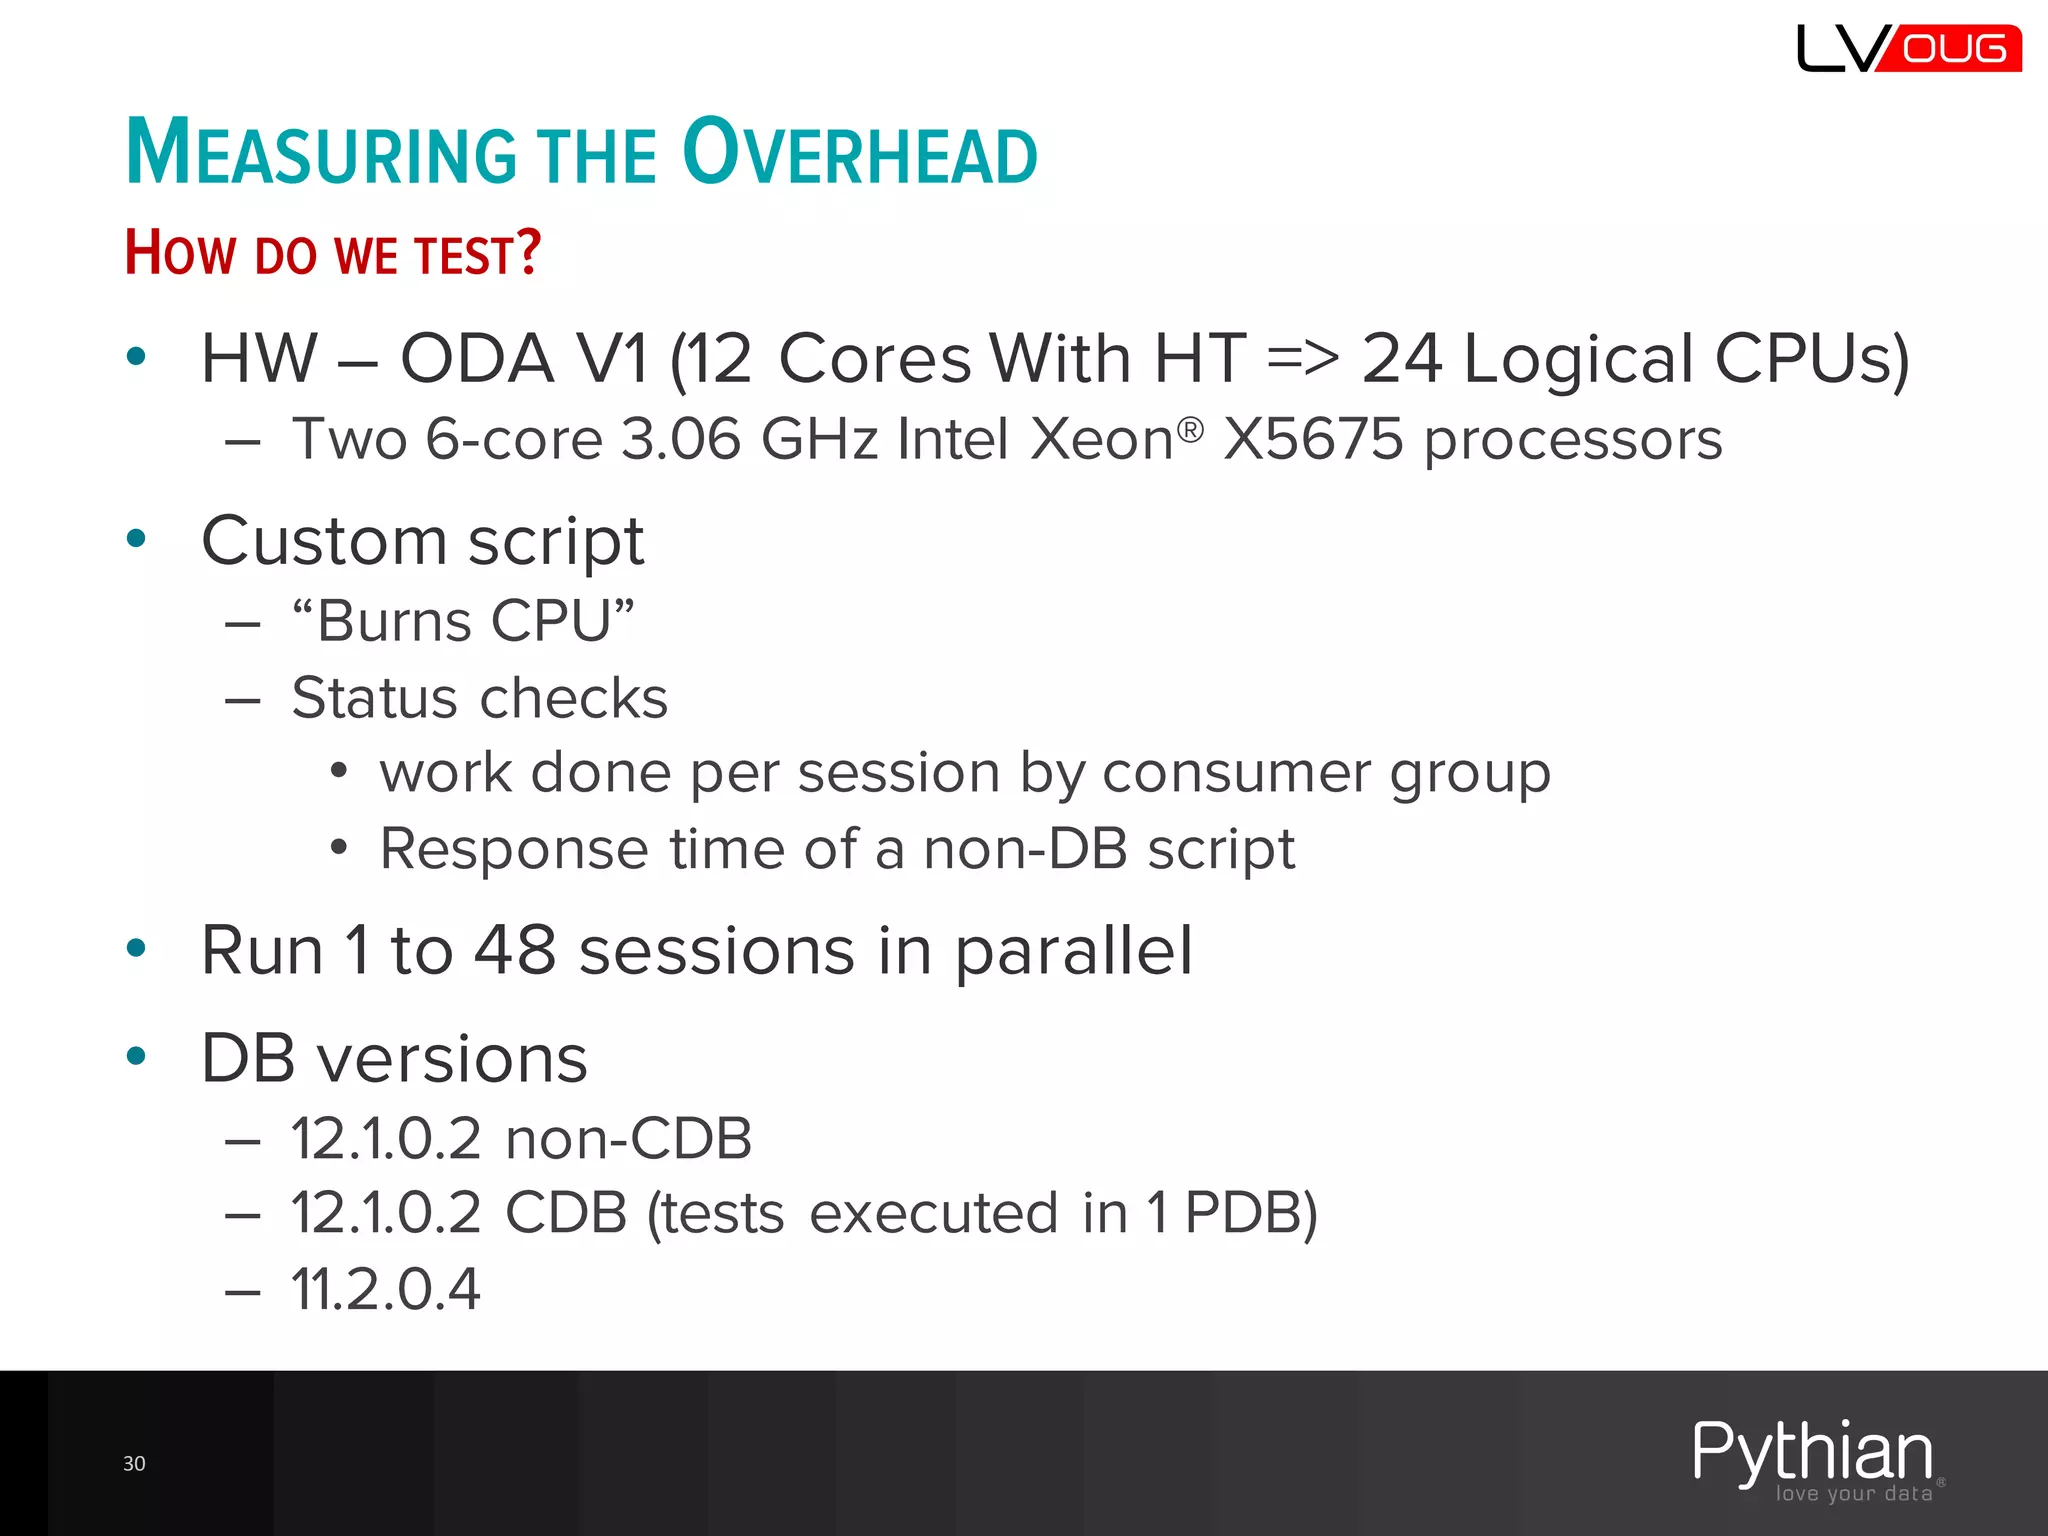
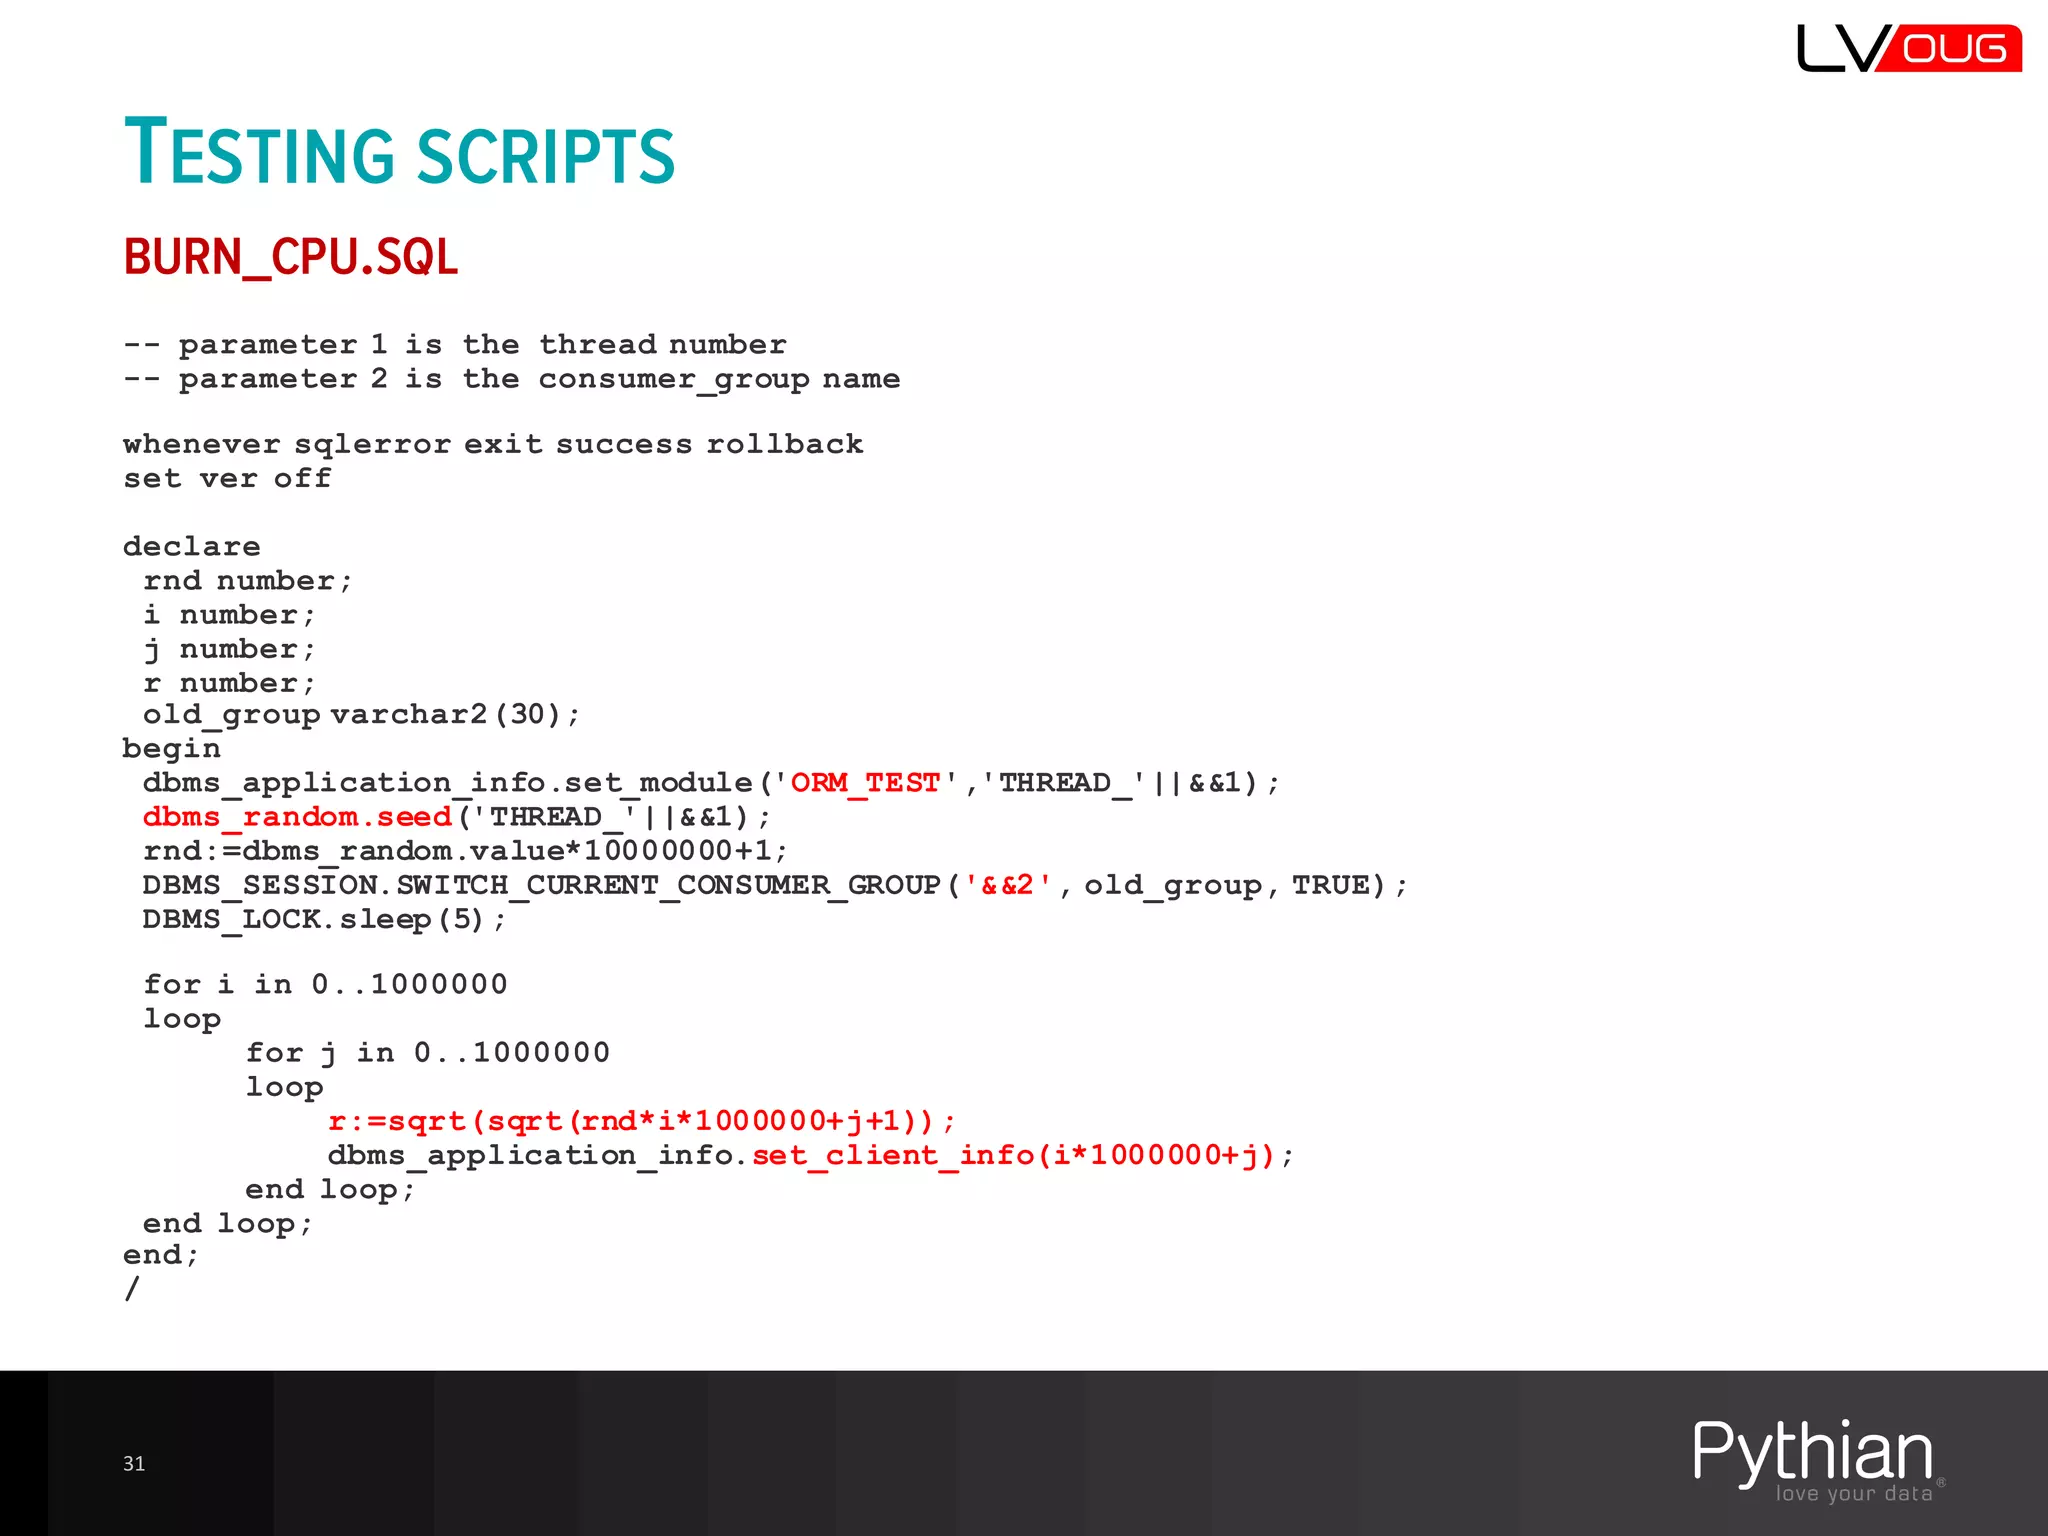
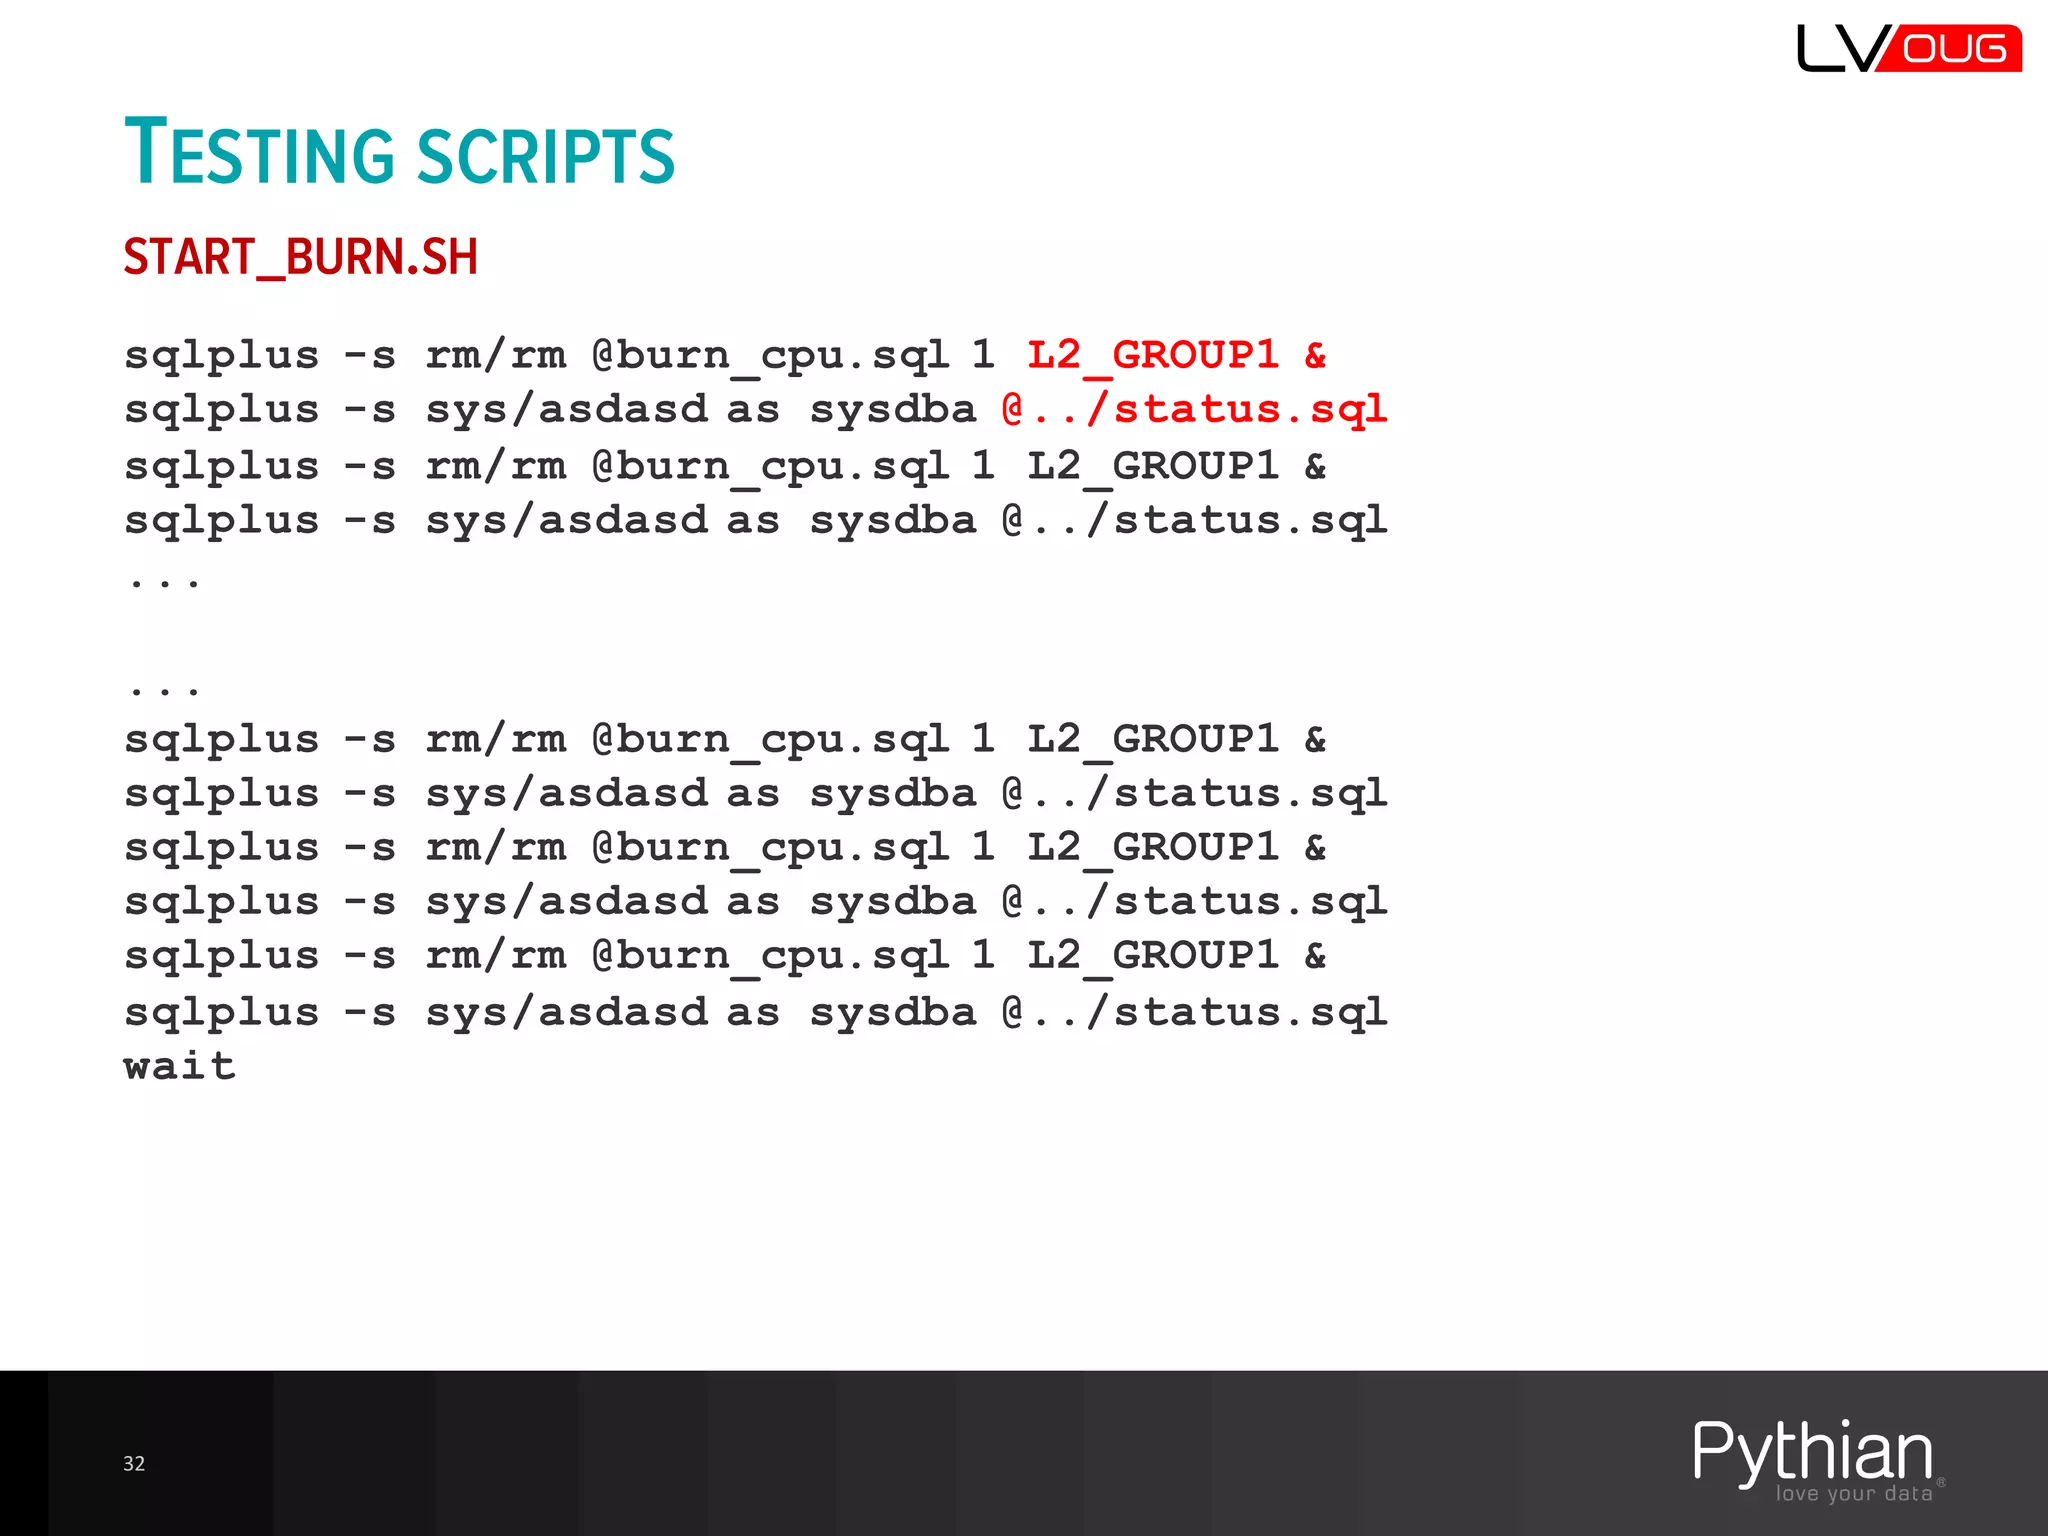
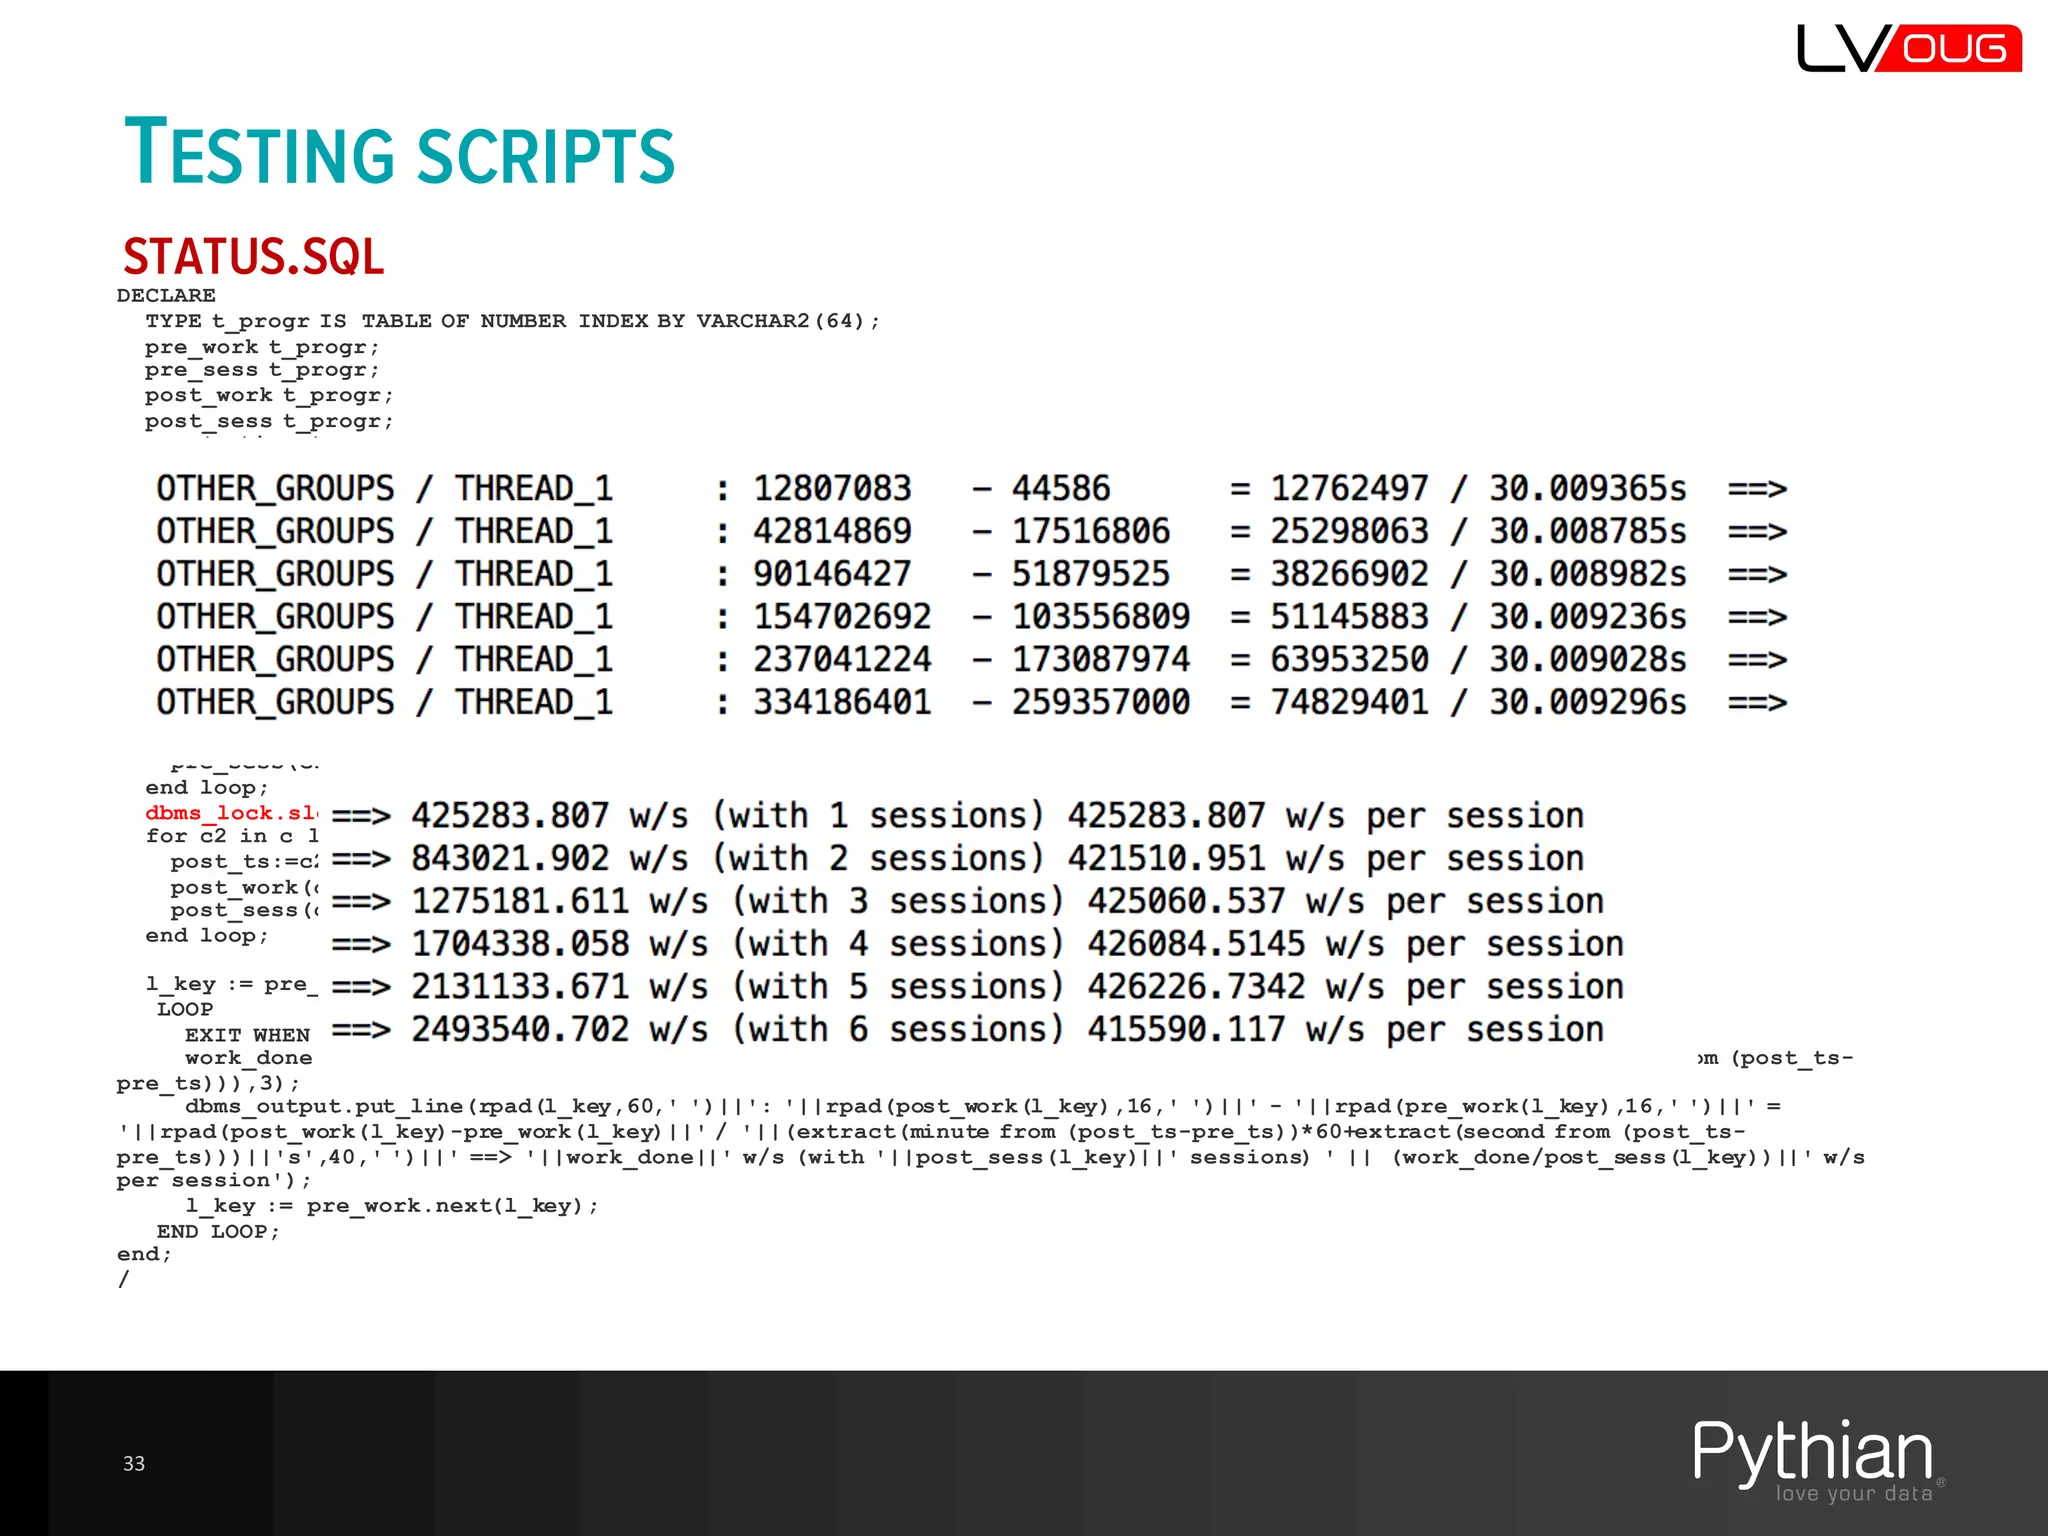
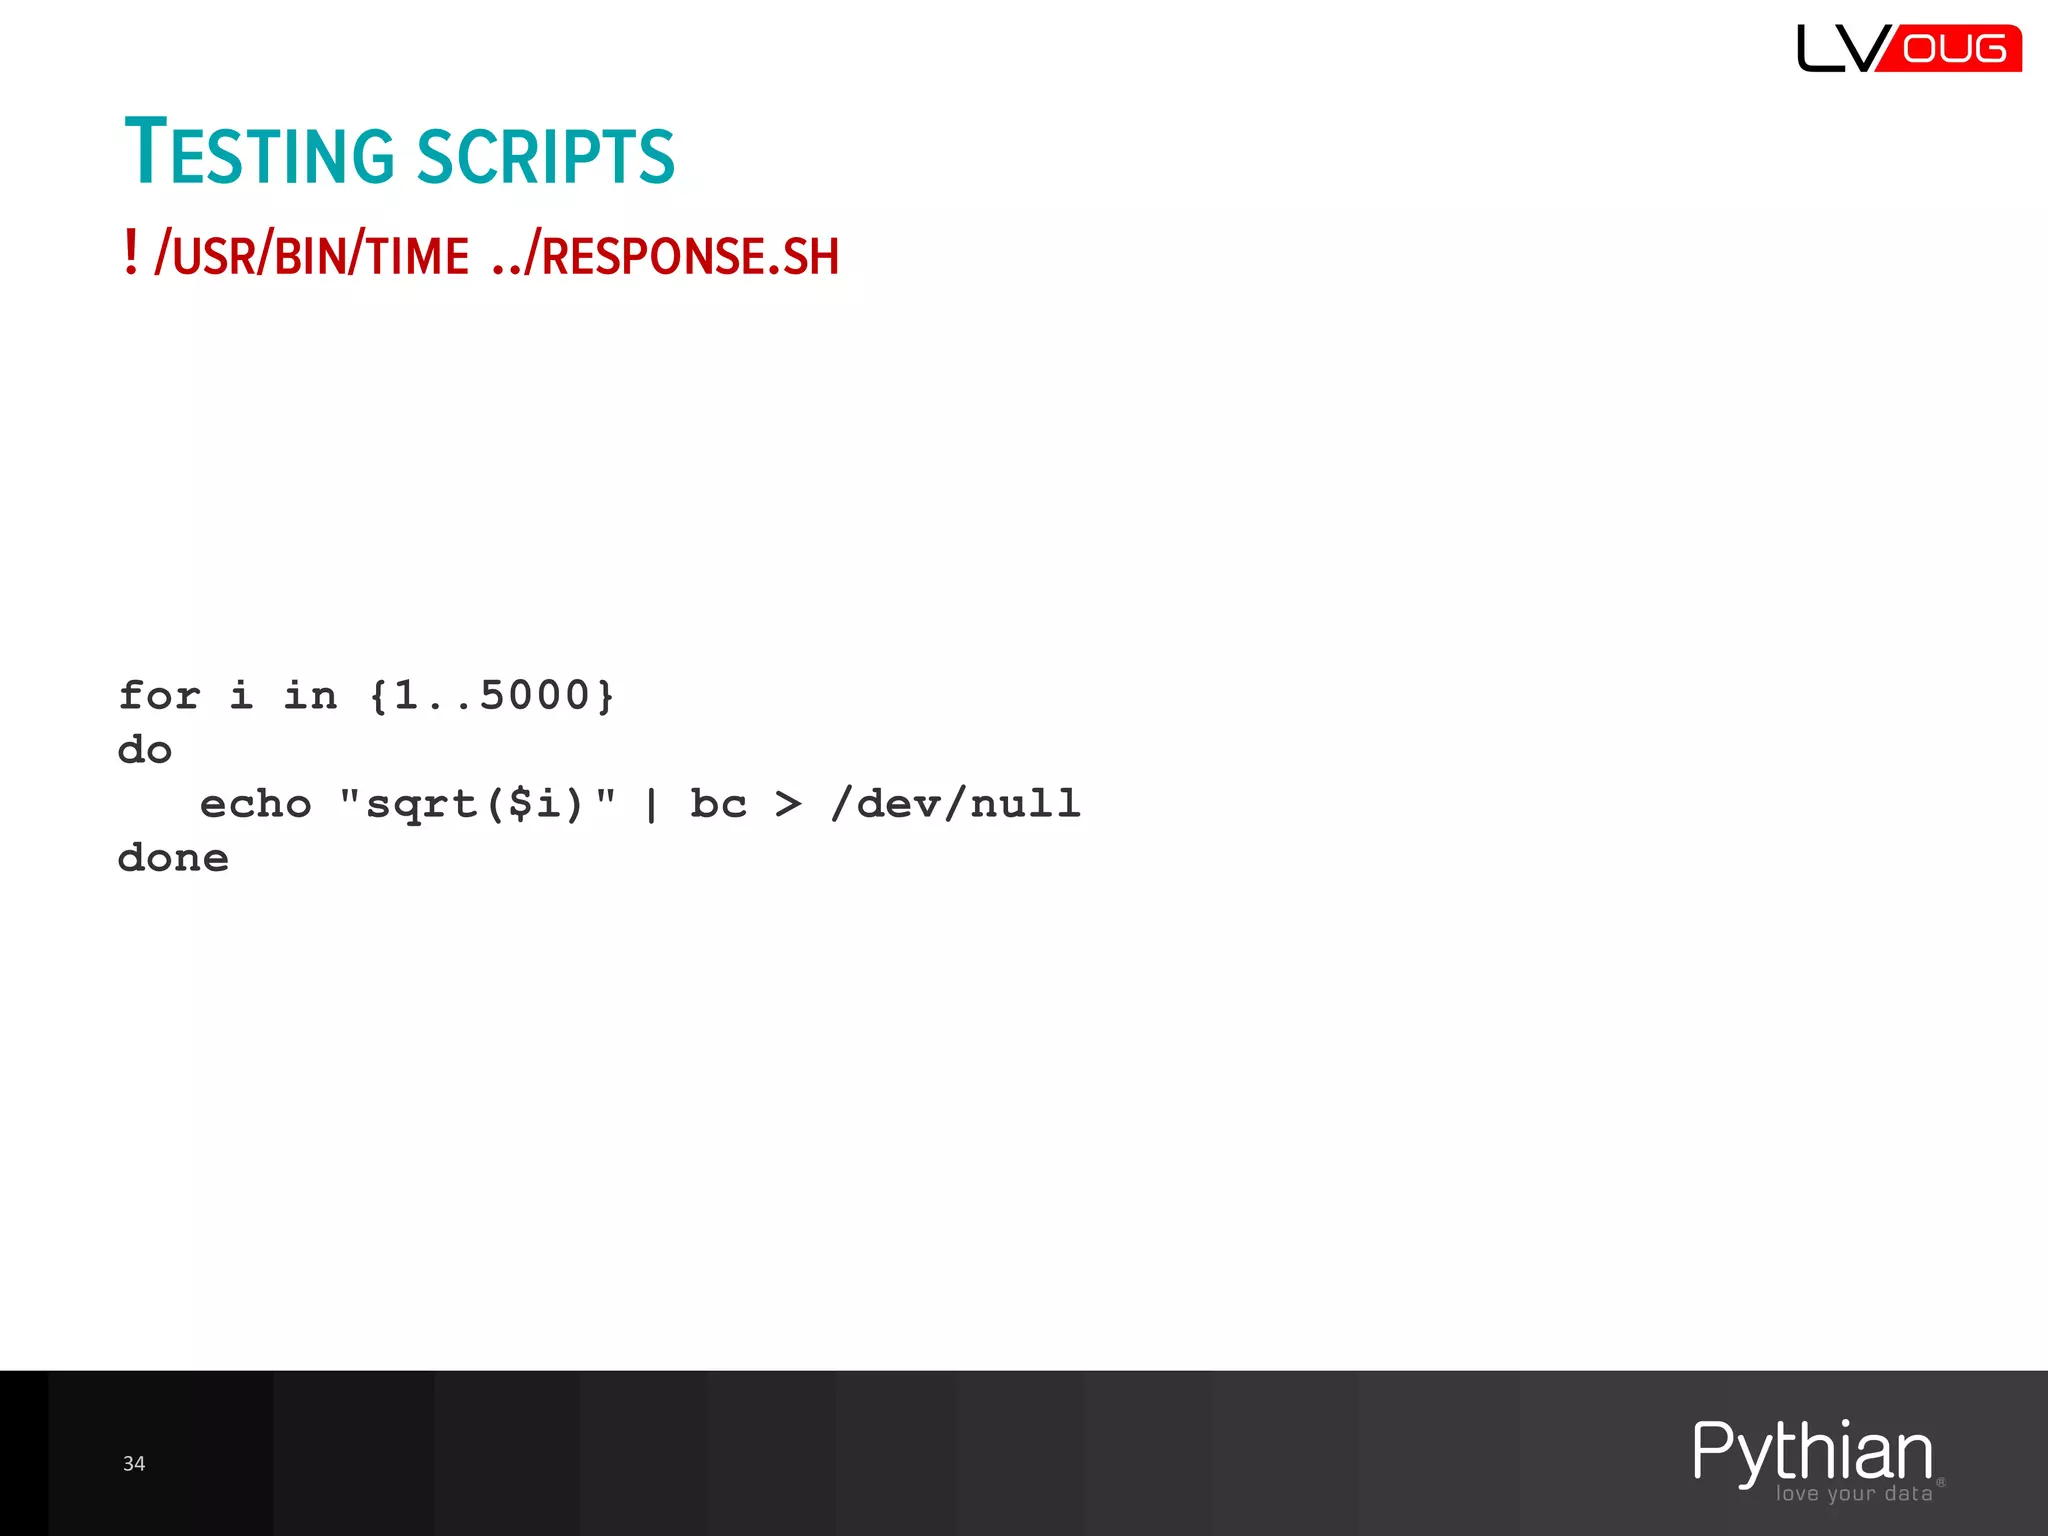
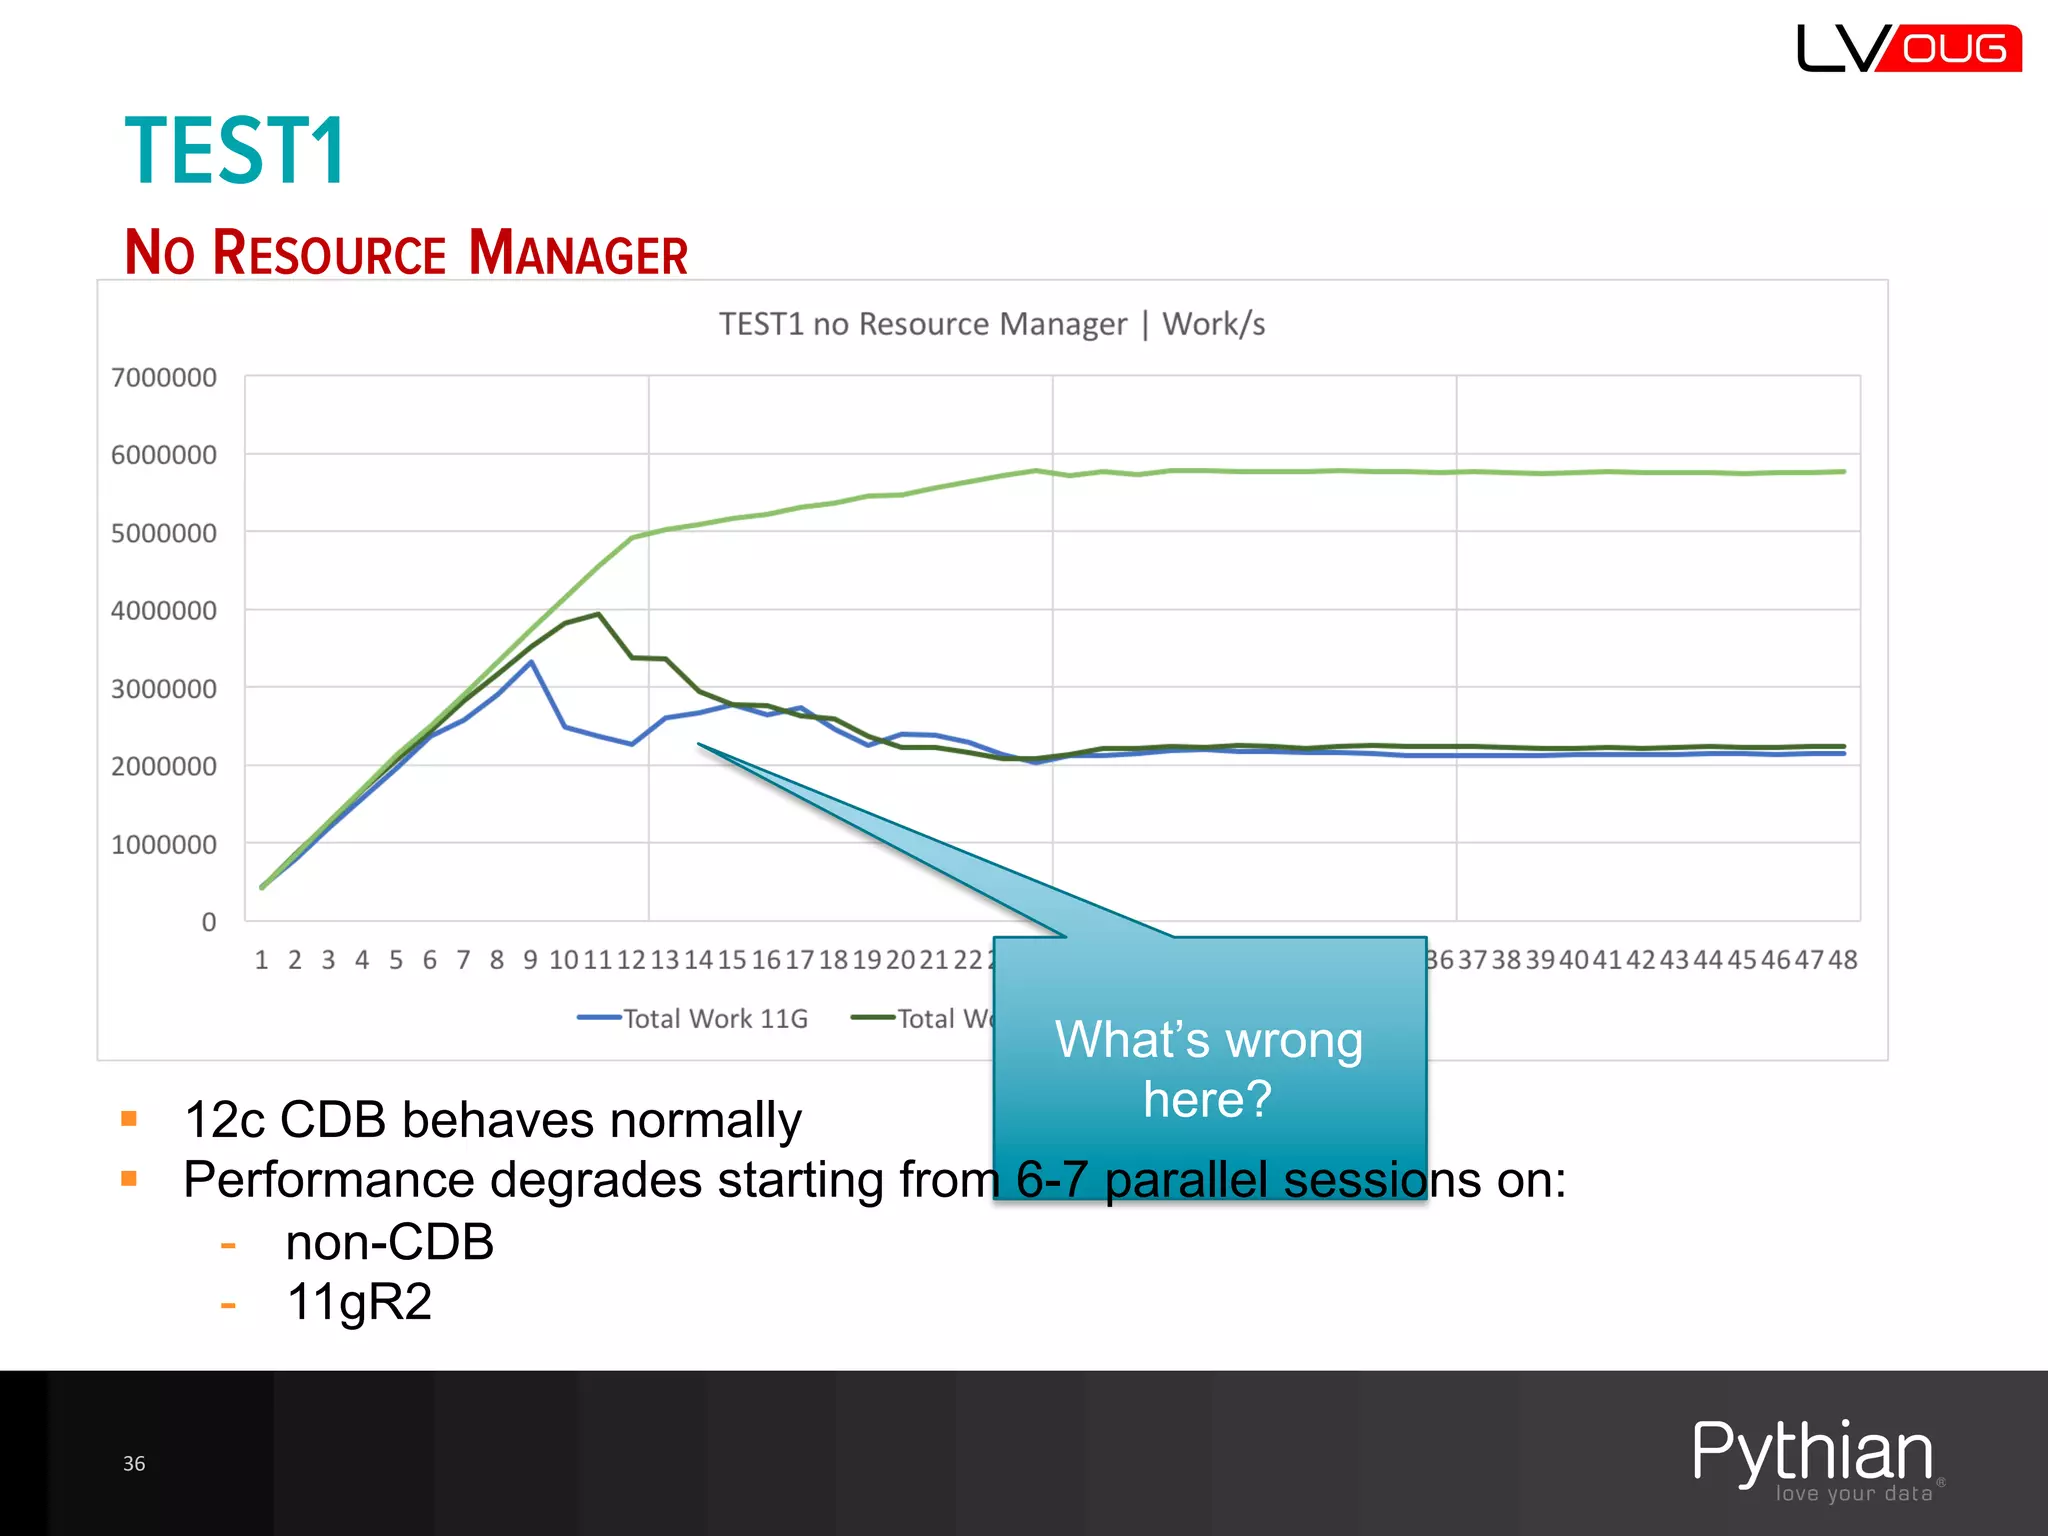
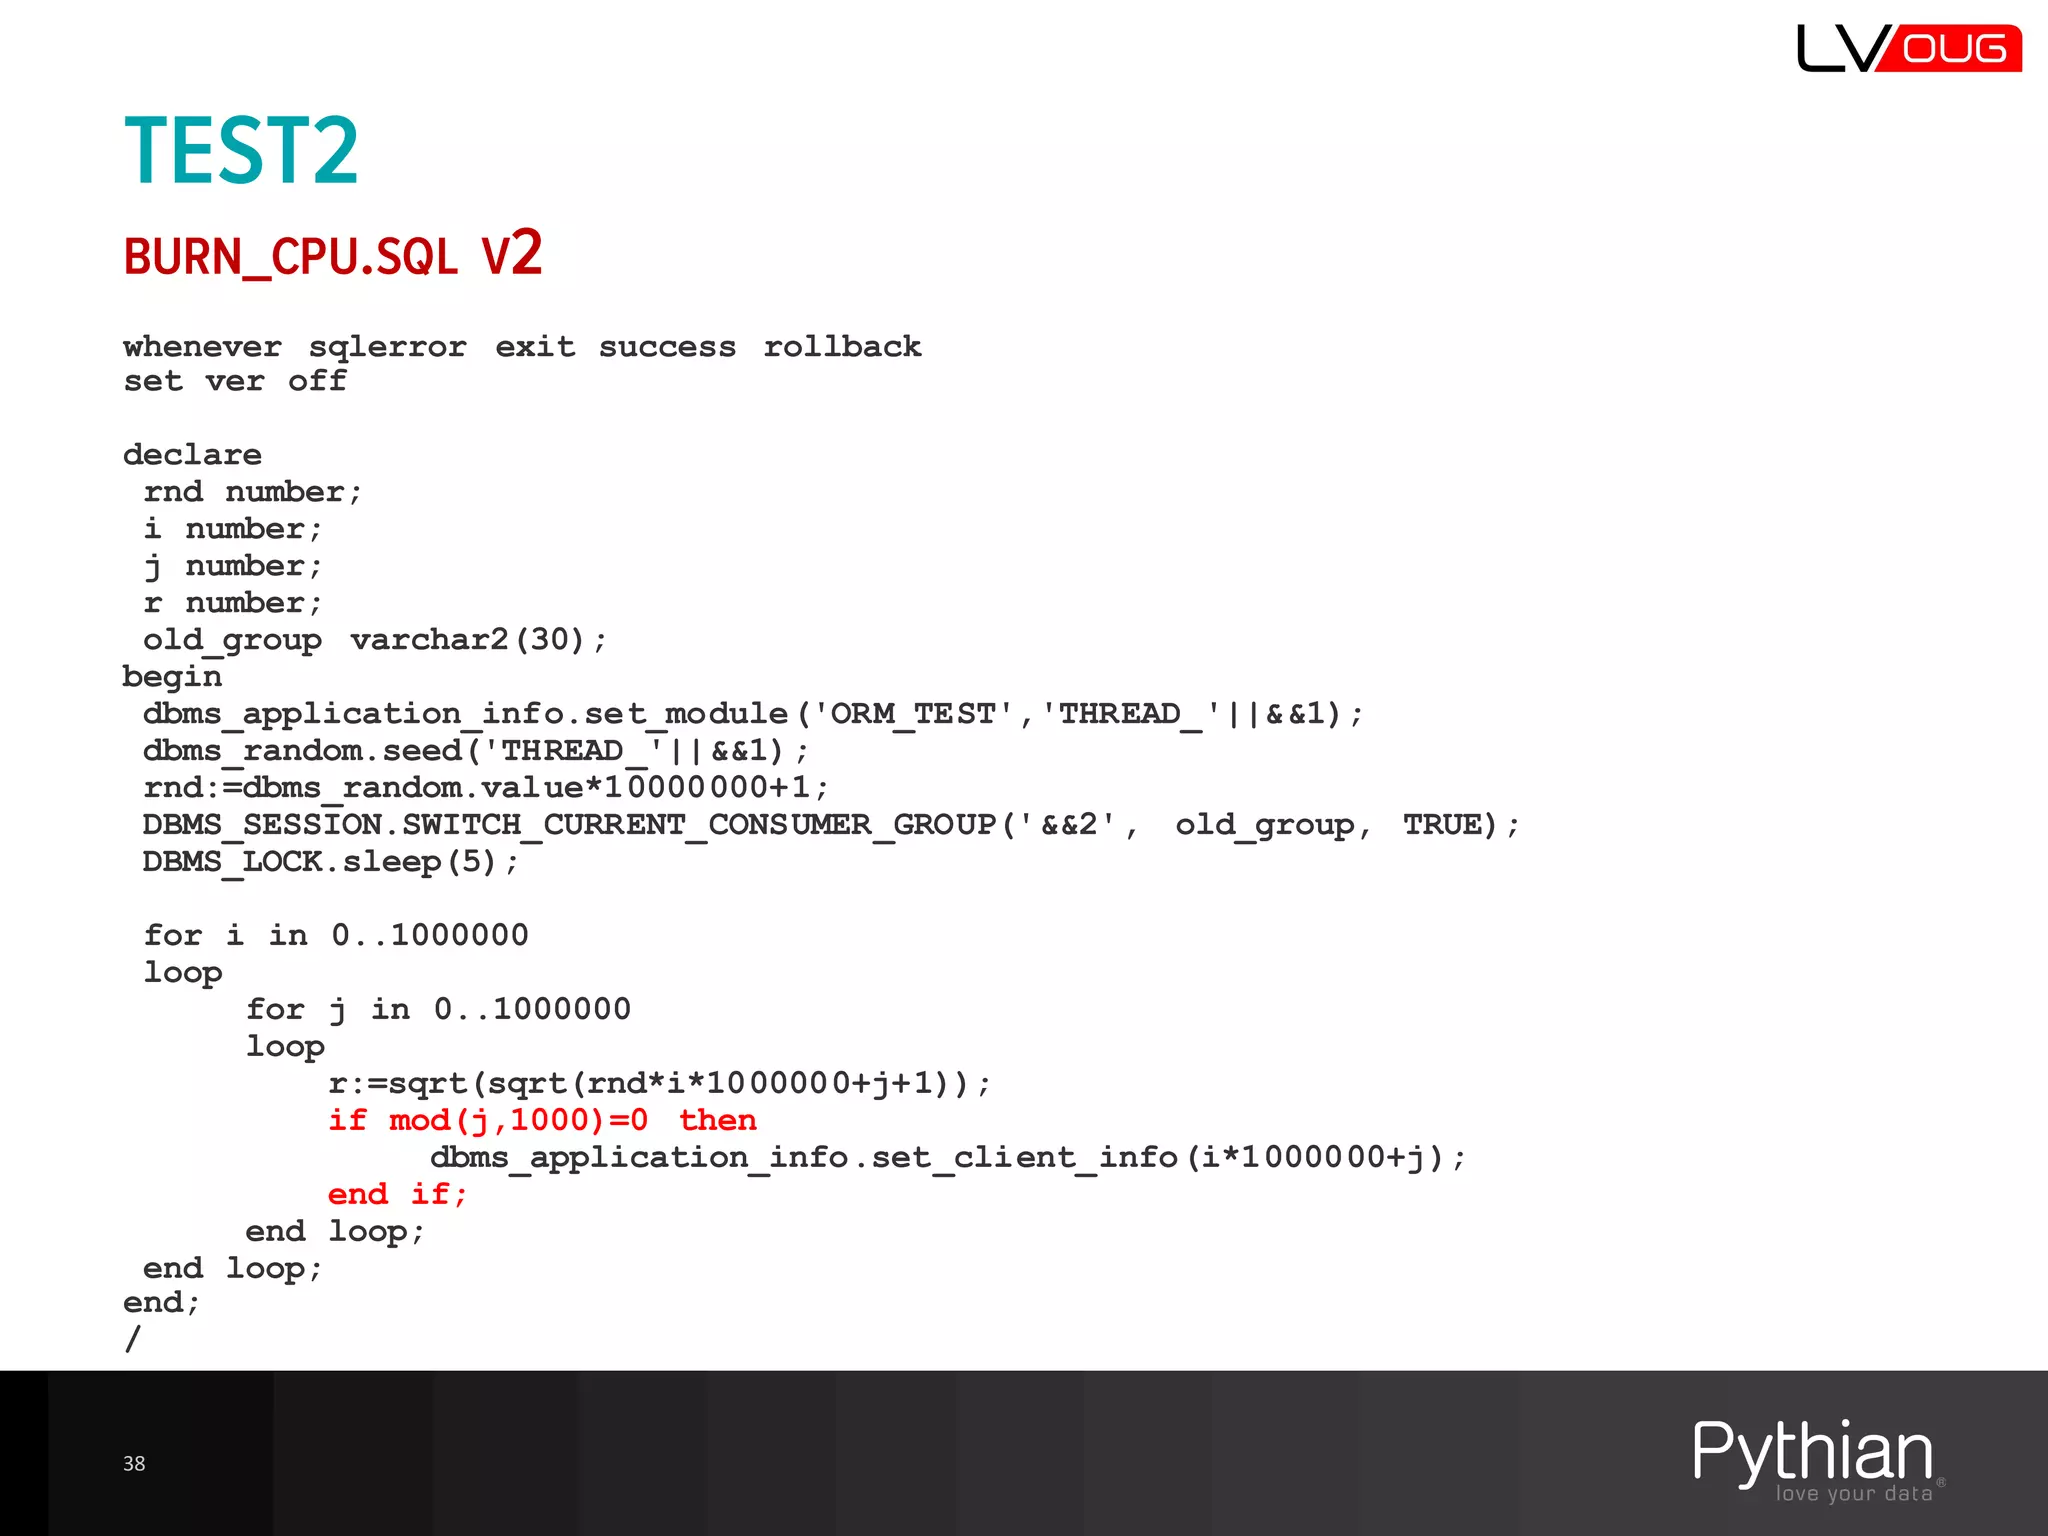
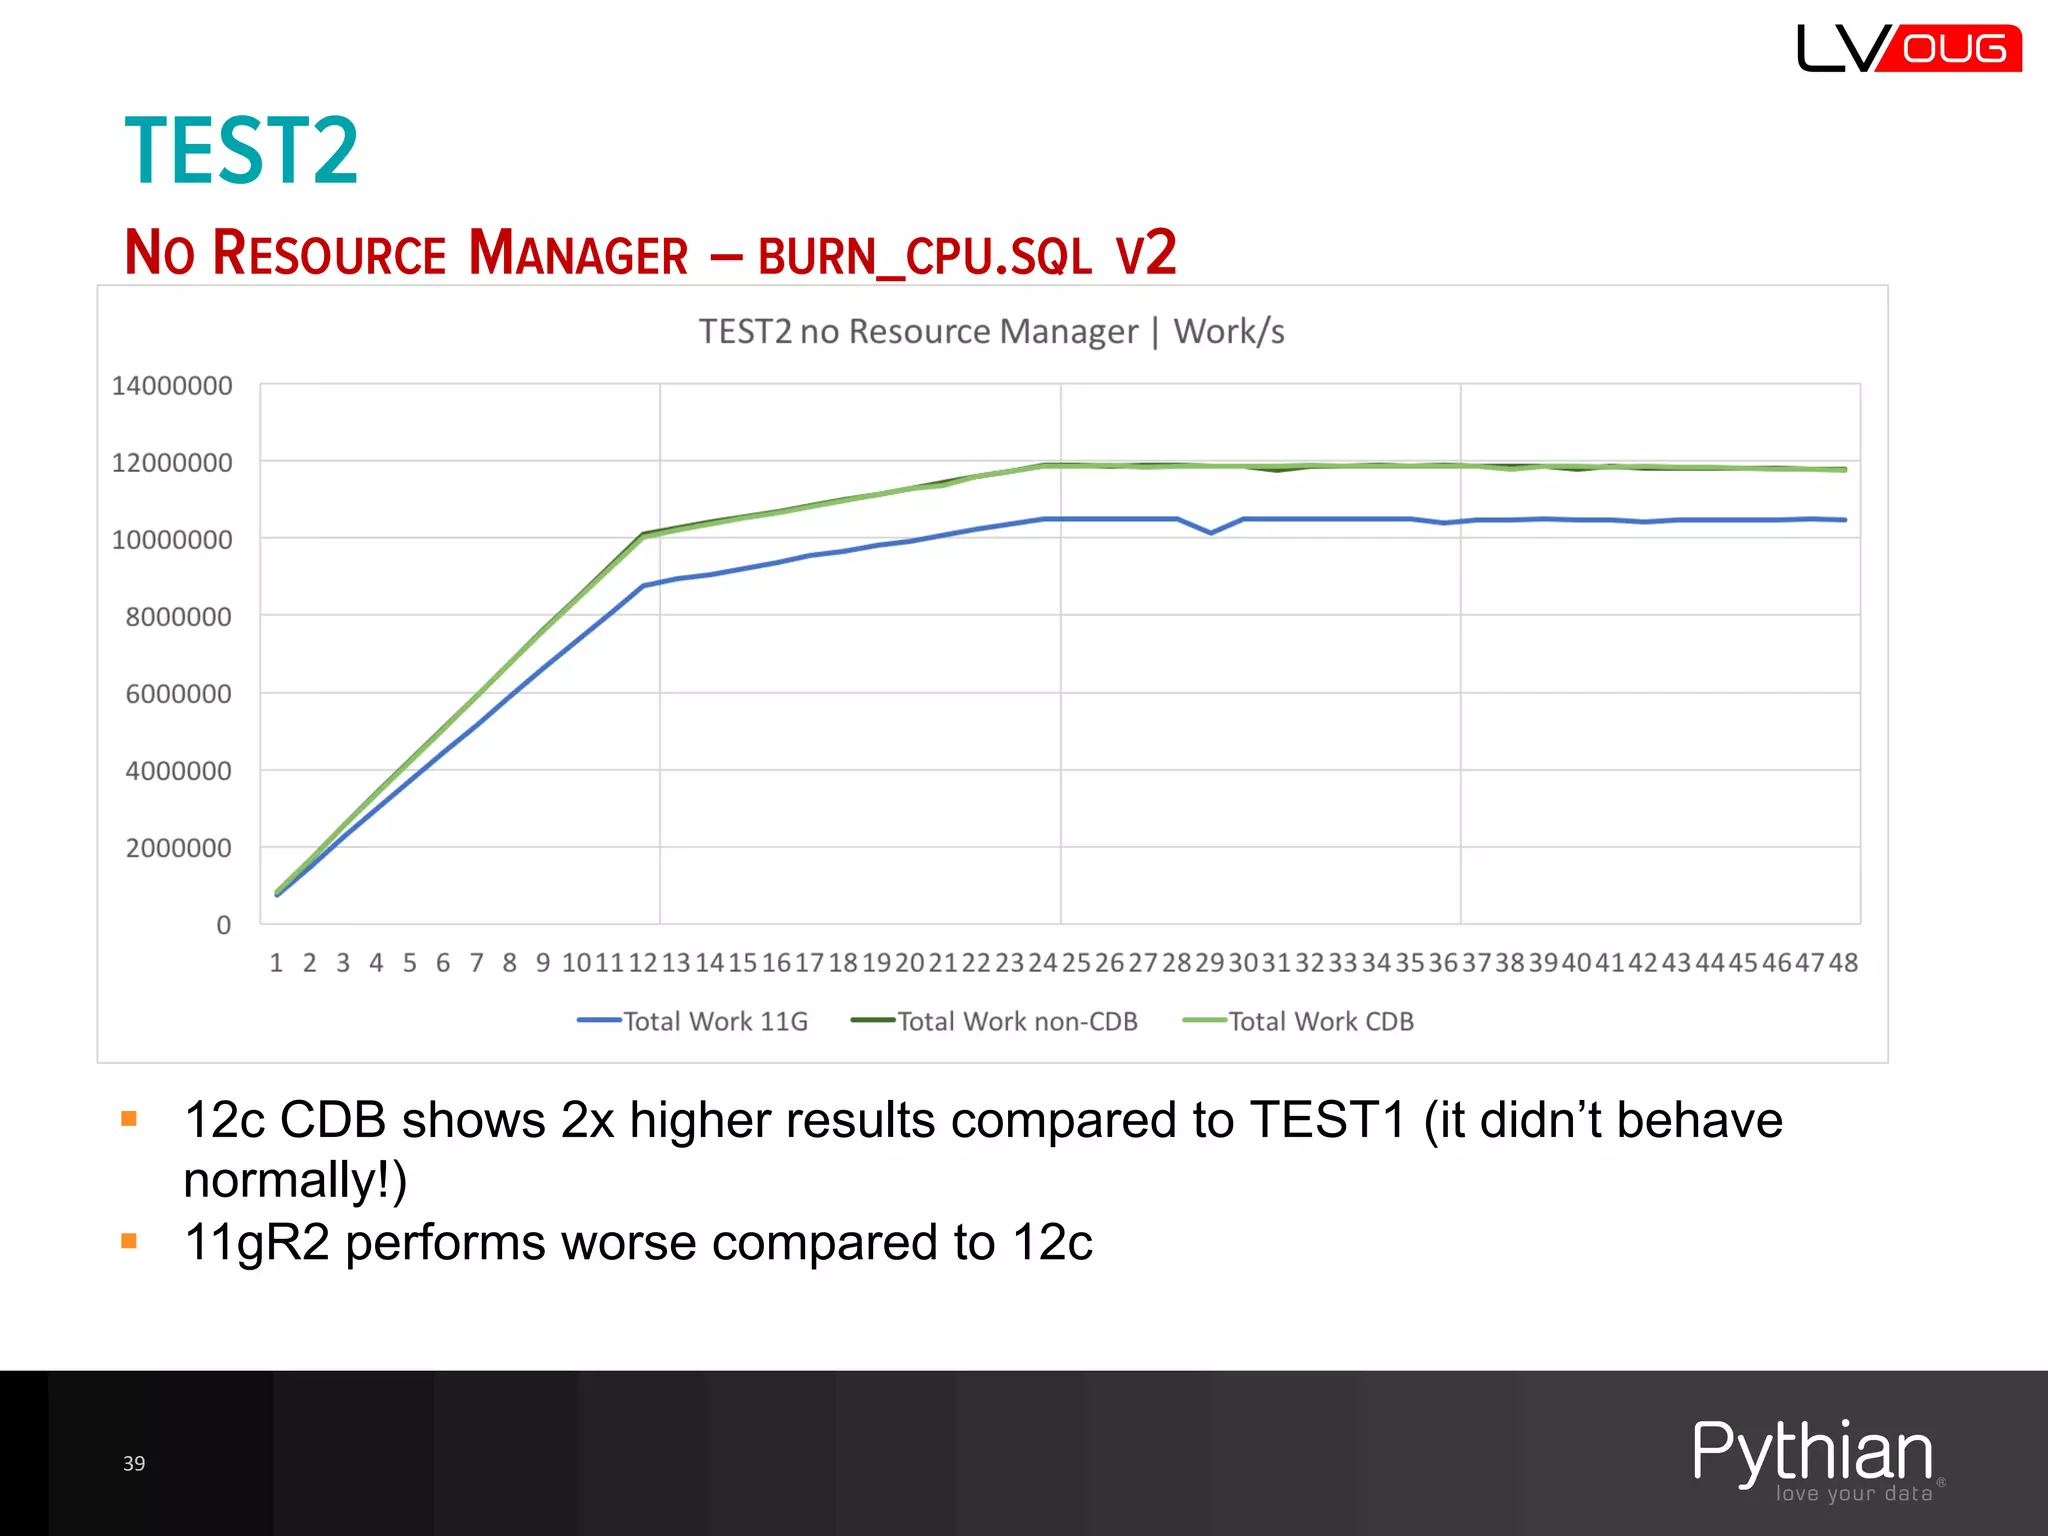
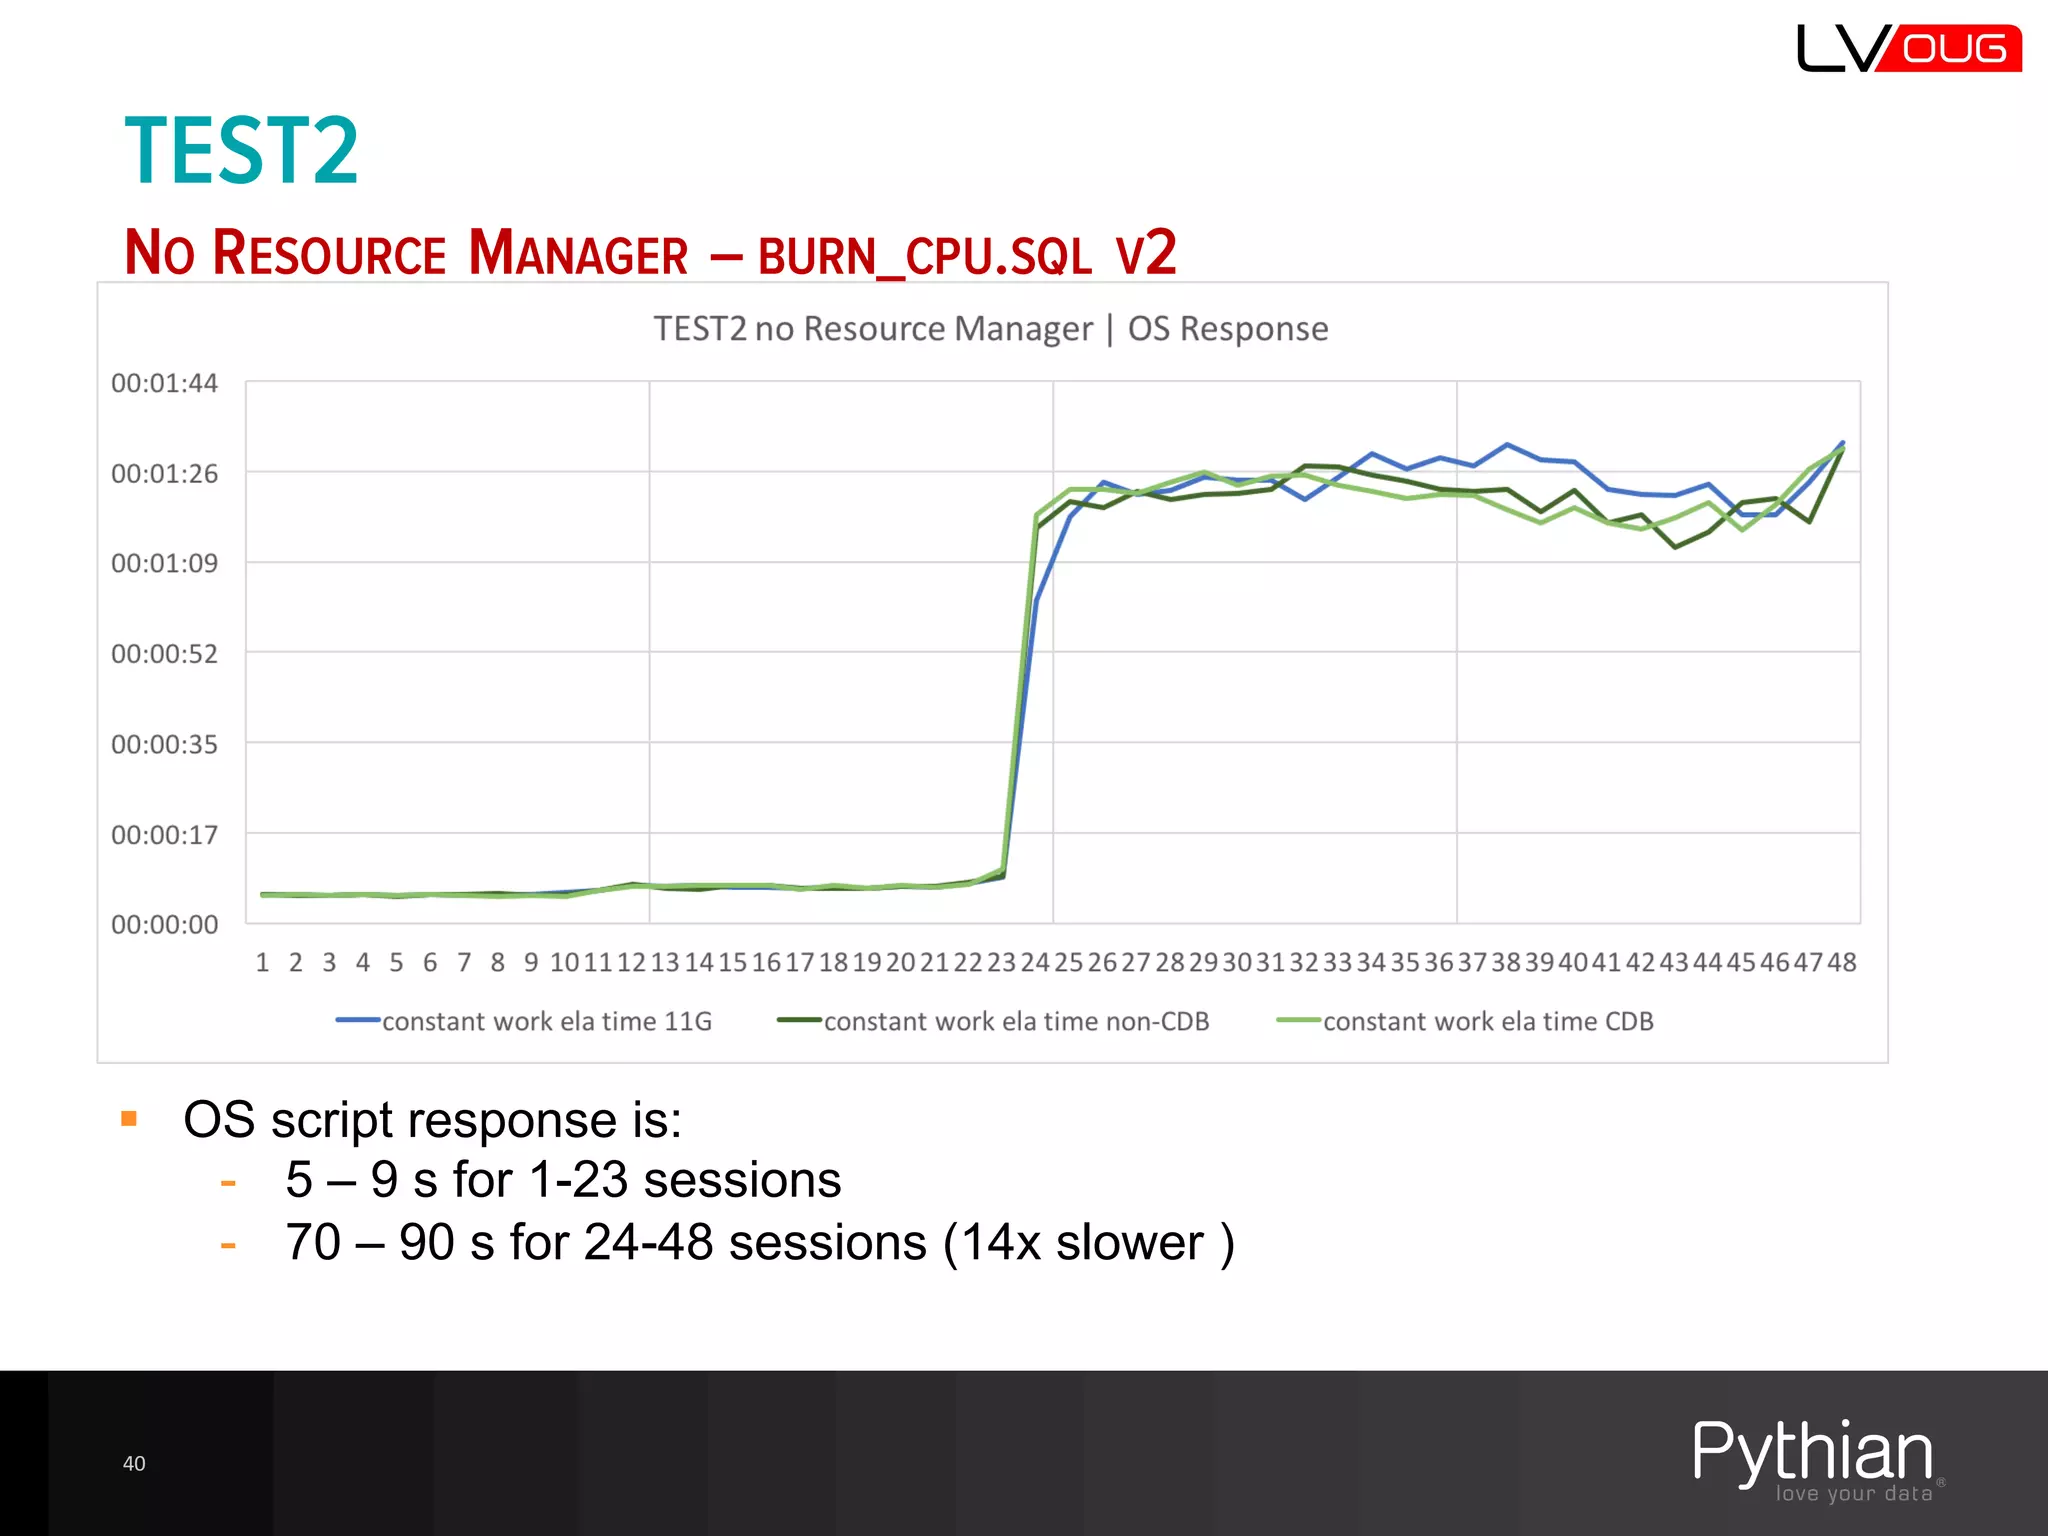
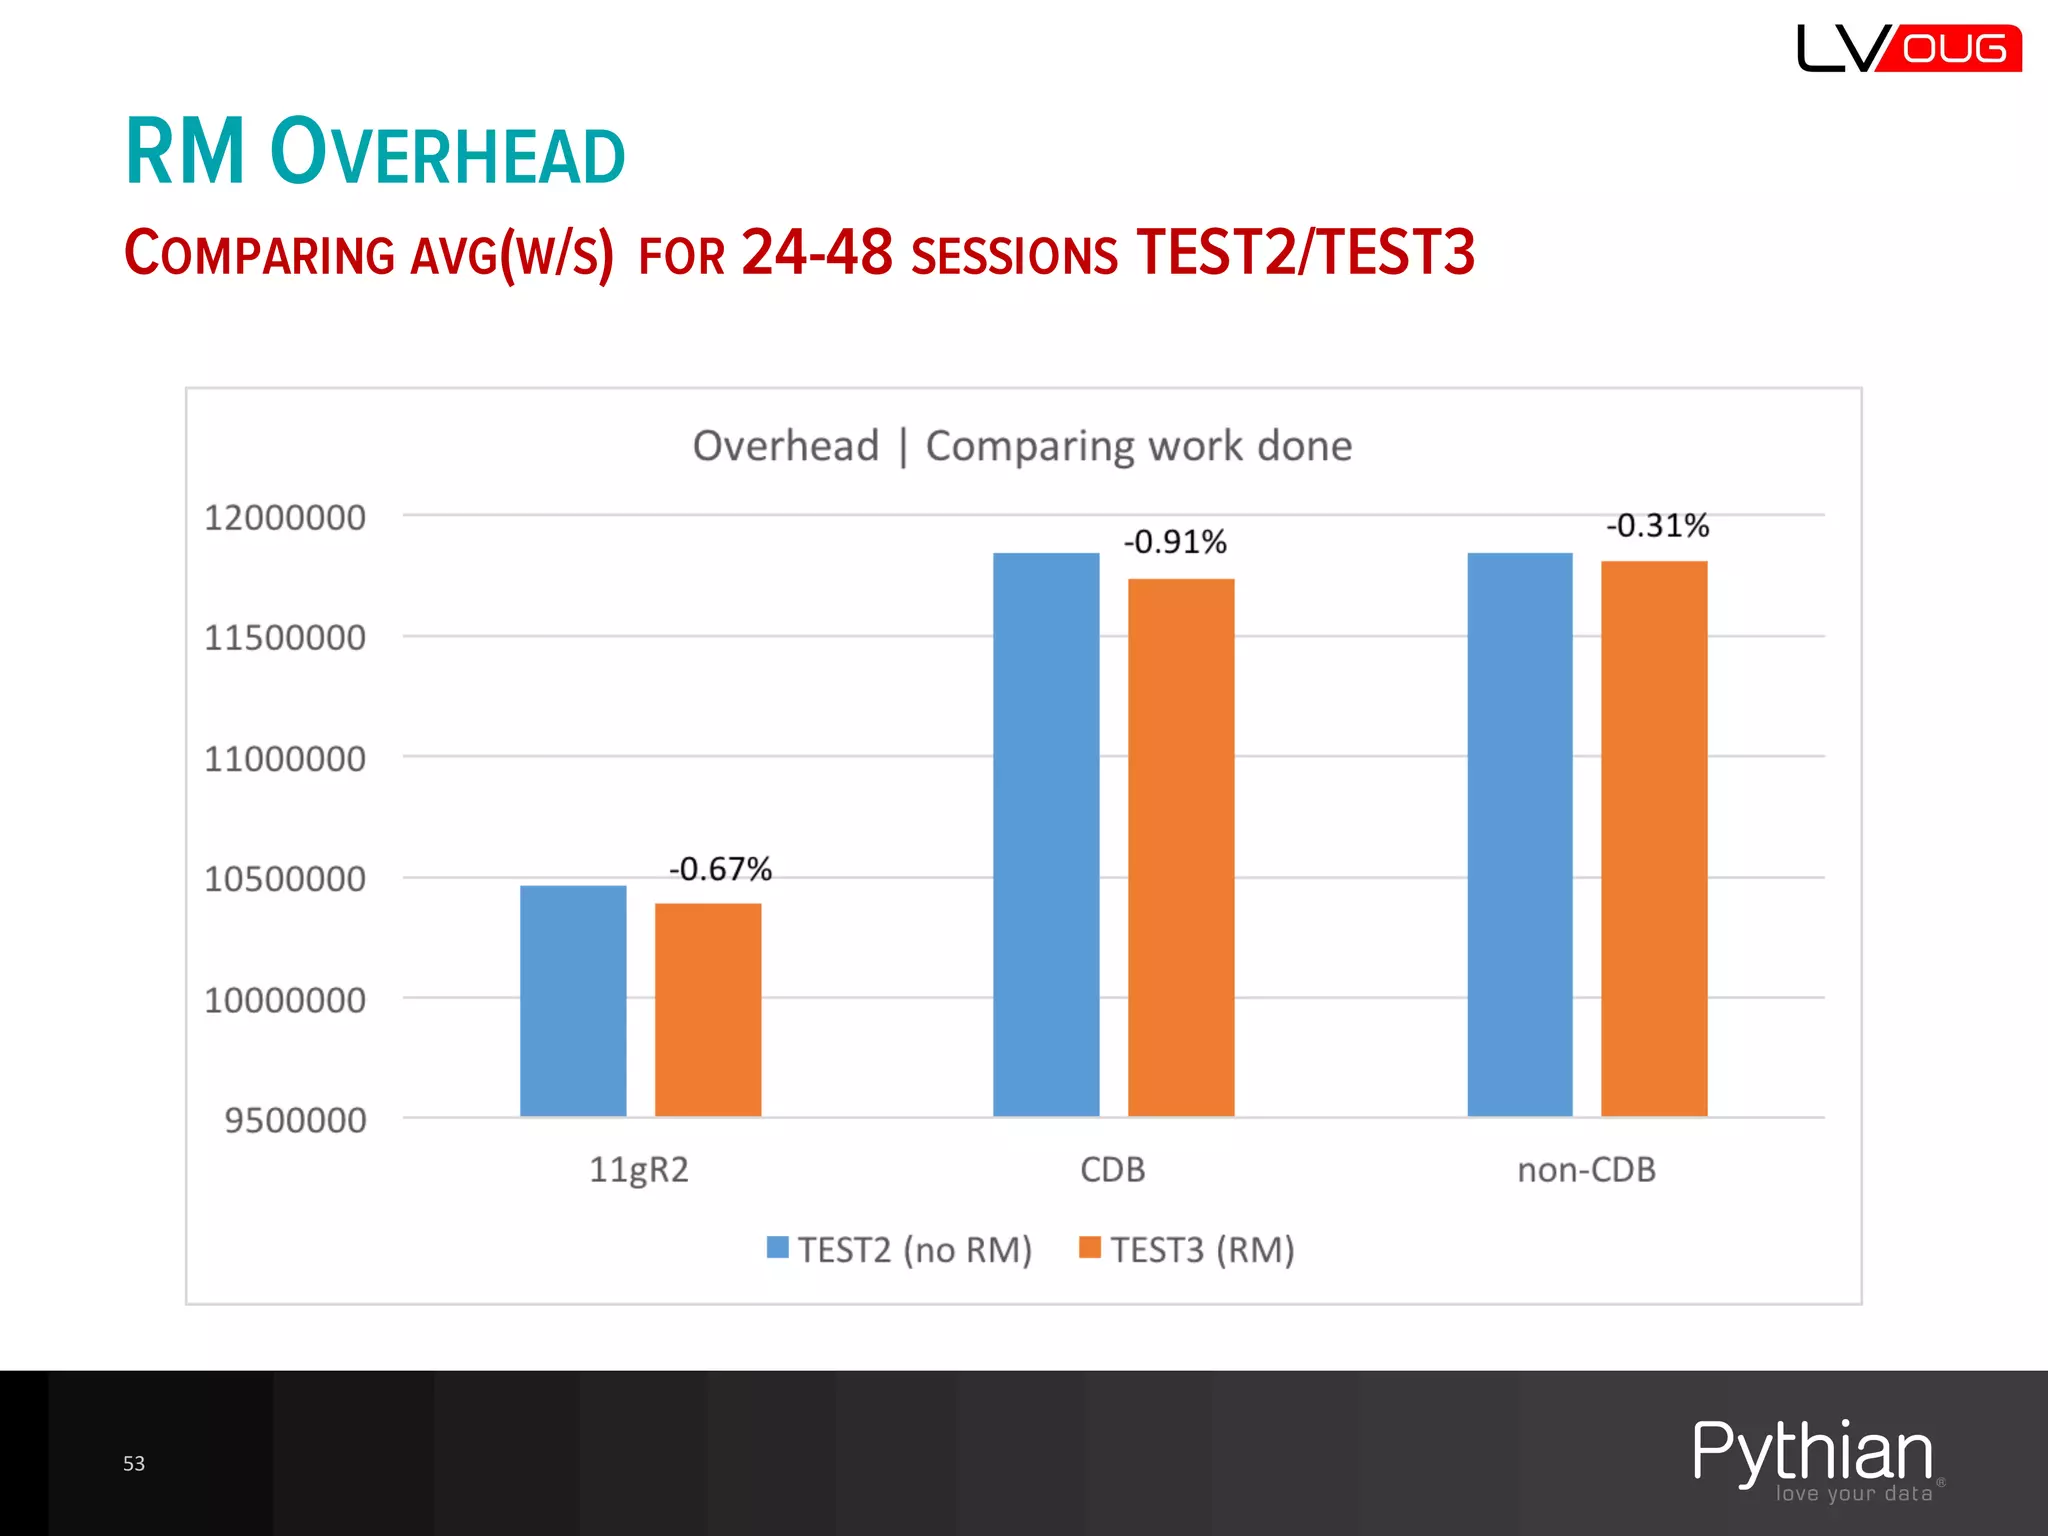
Discussion about Resource Manager overhead, testing scripts, and methodologies for evaluating performance.
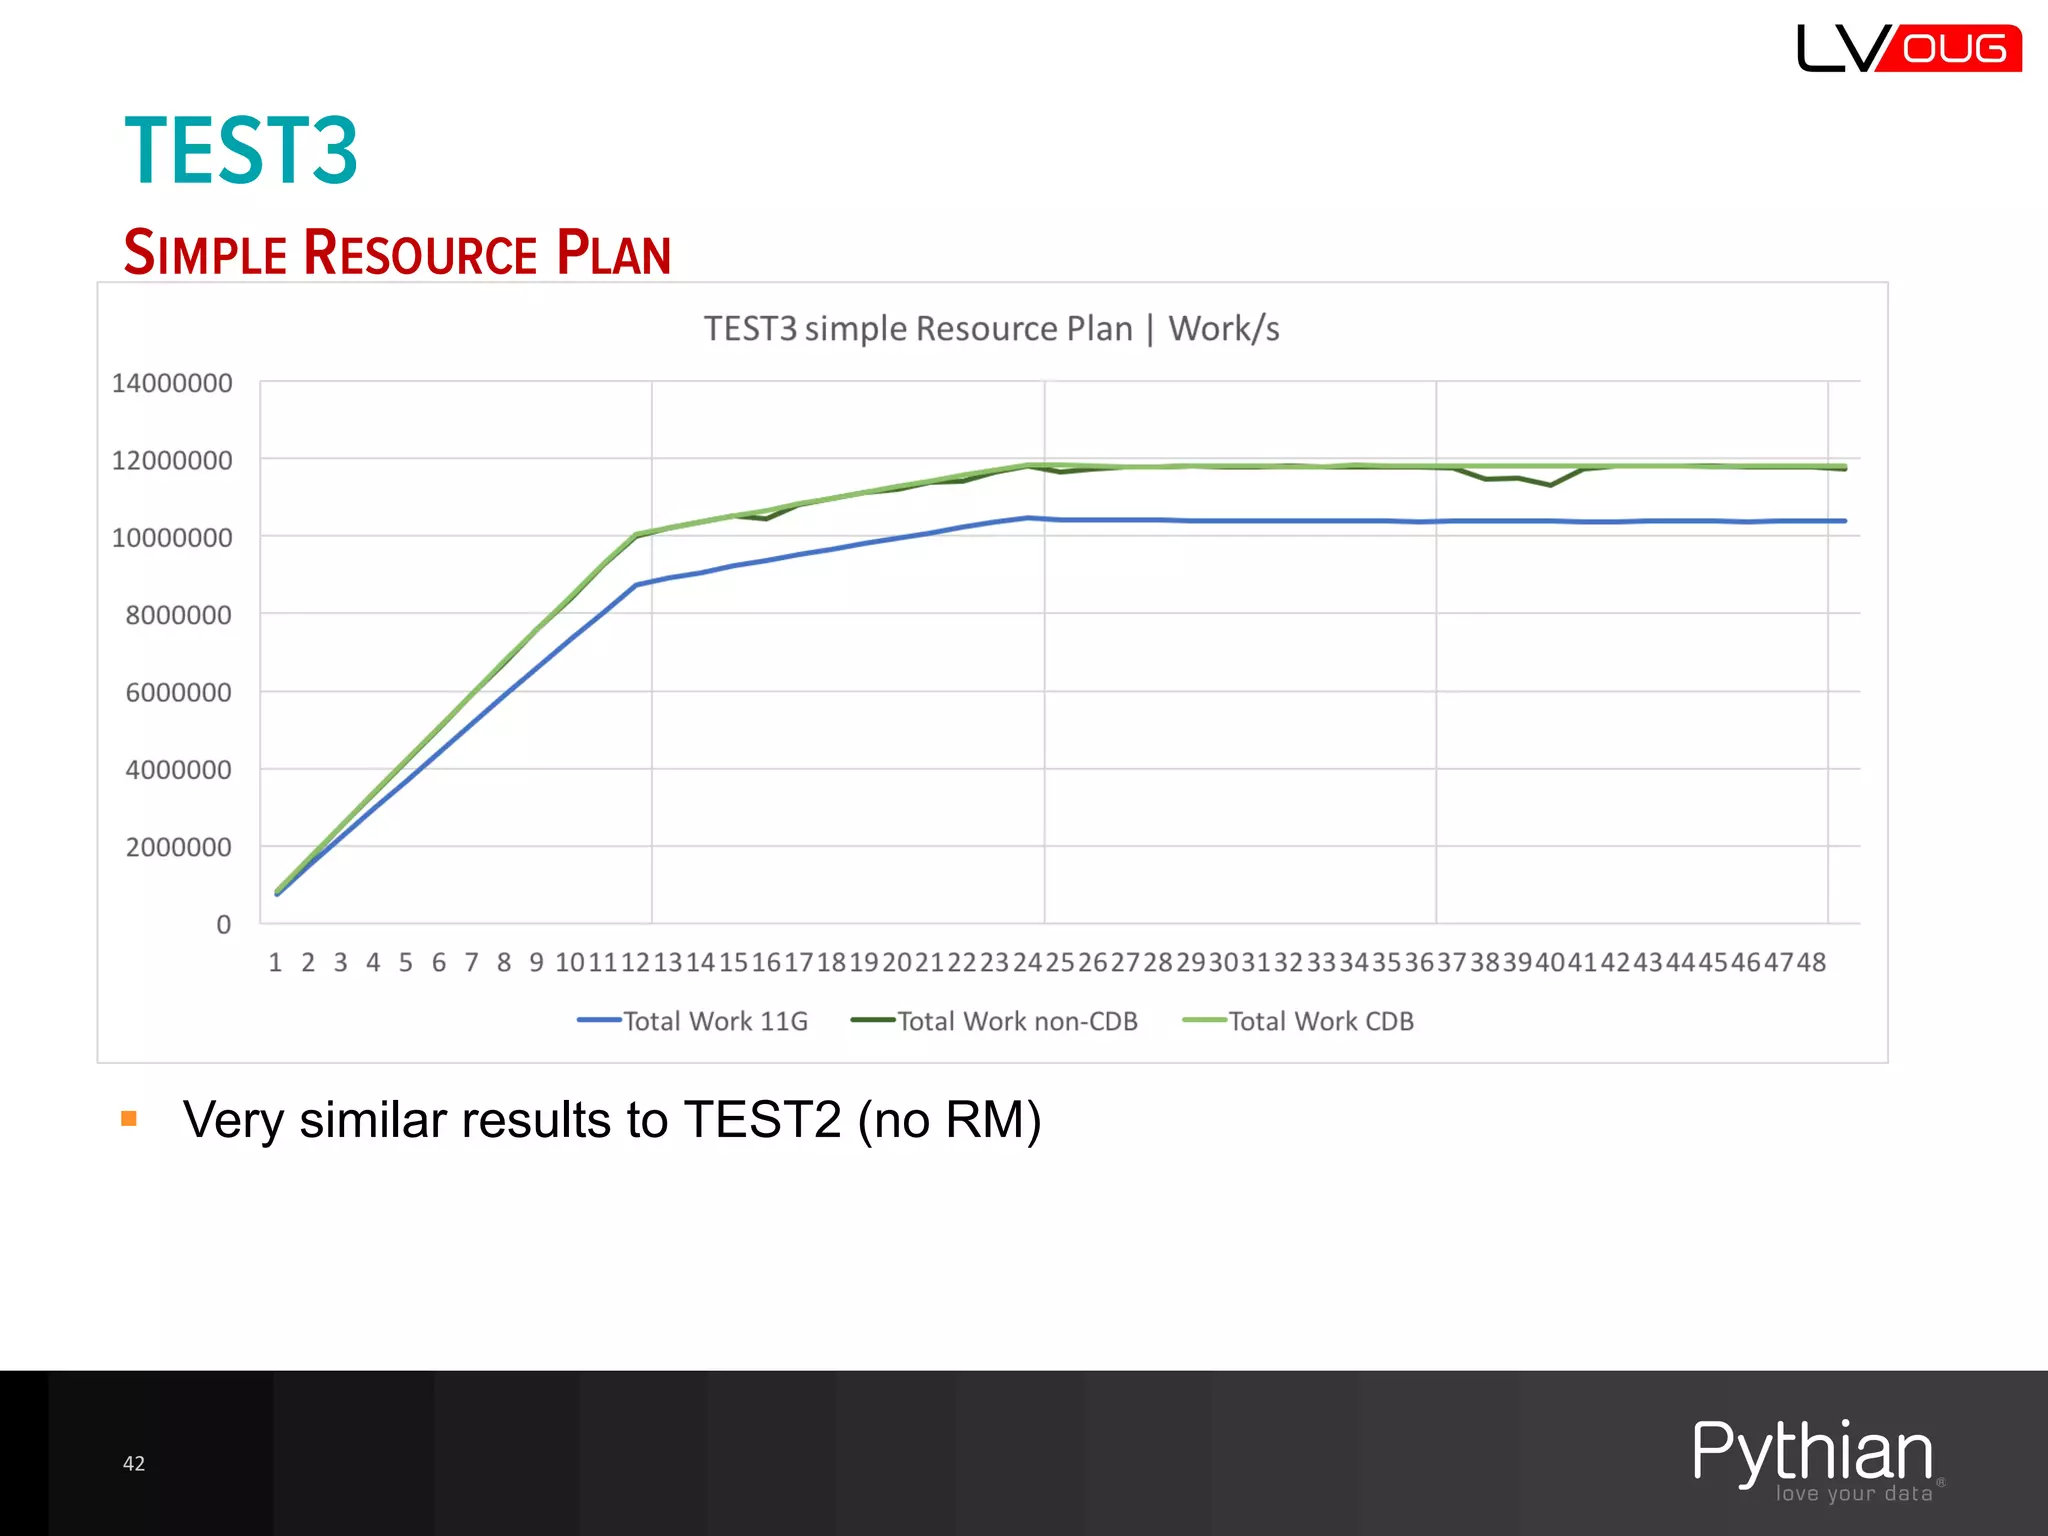
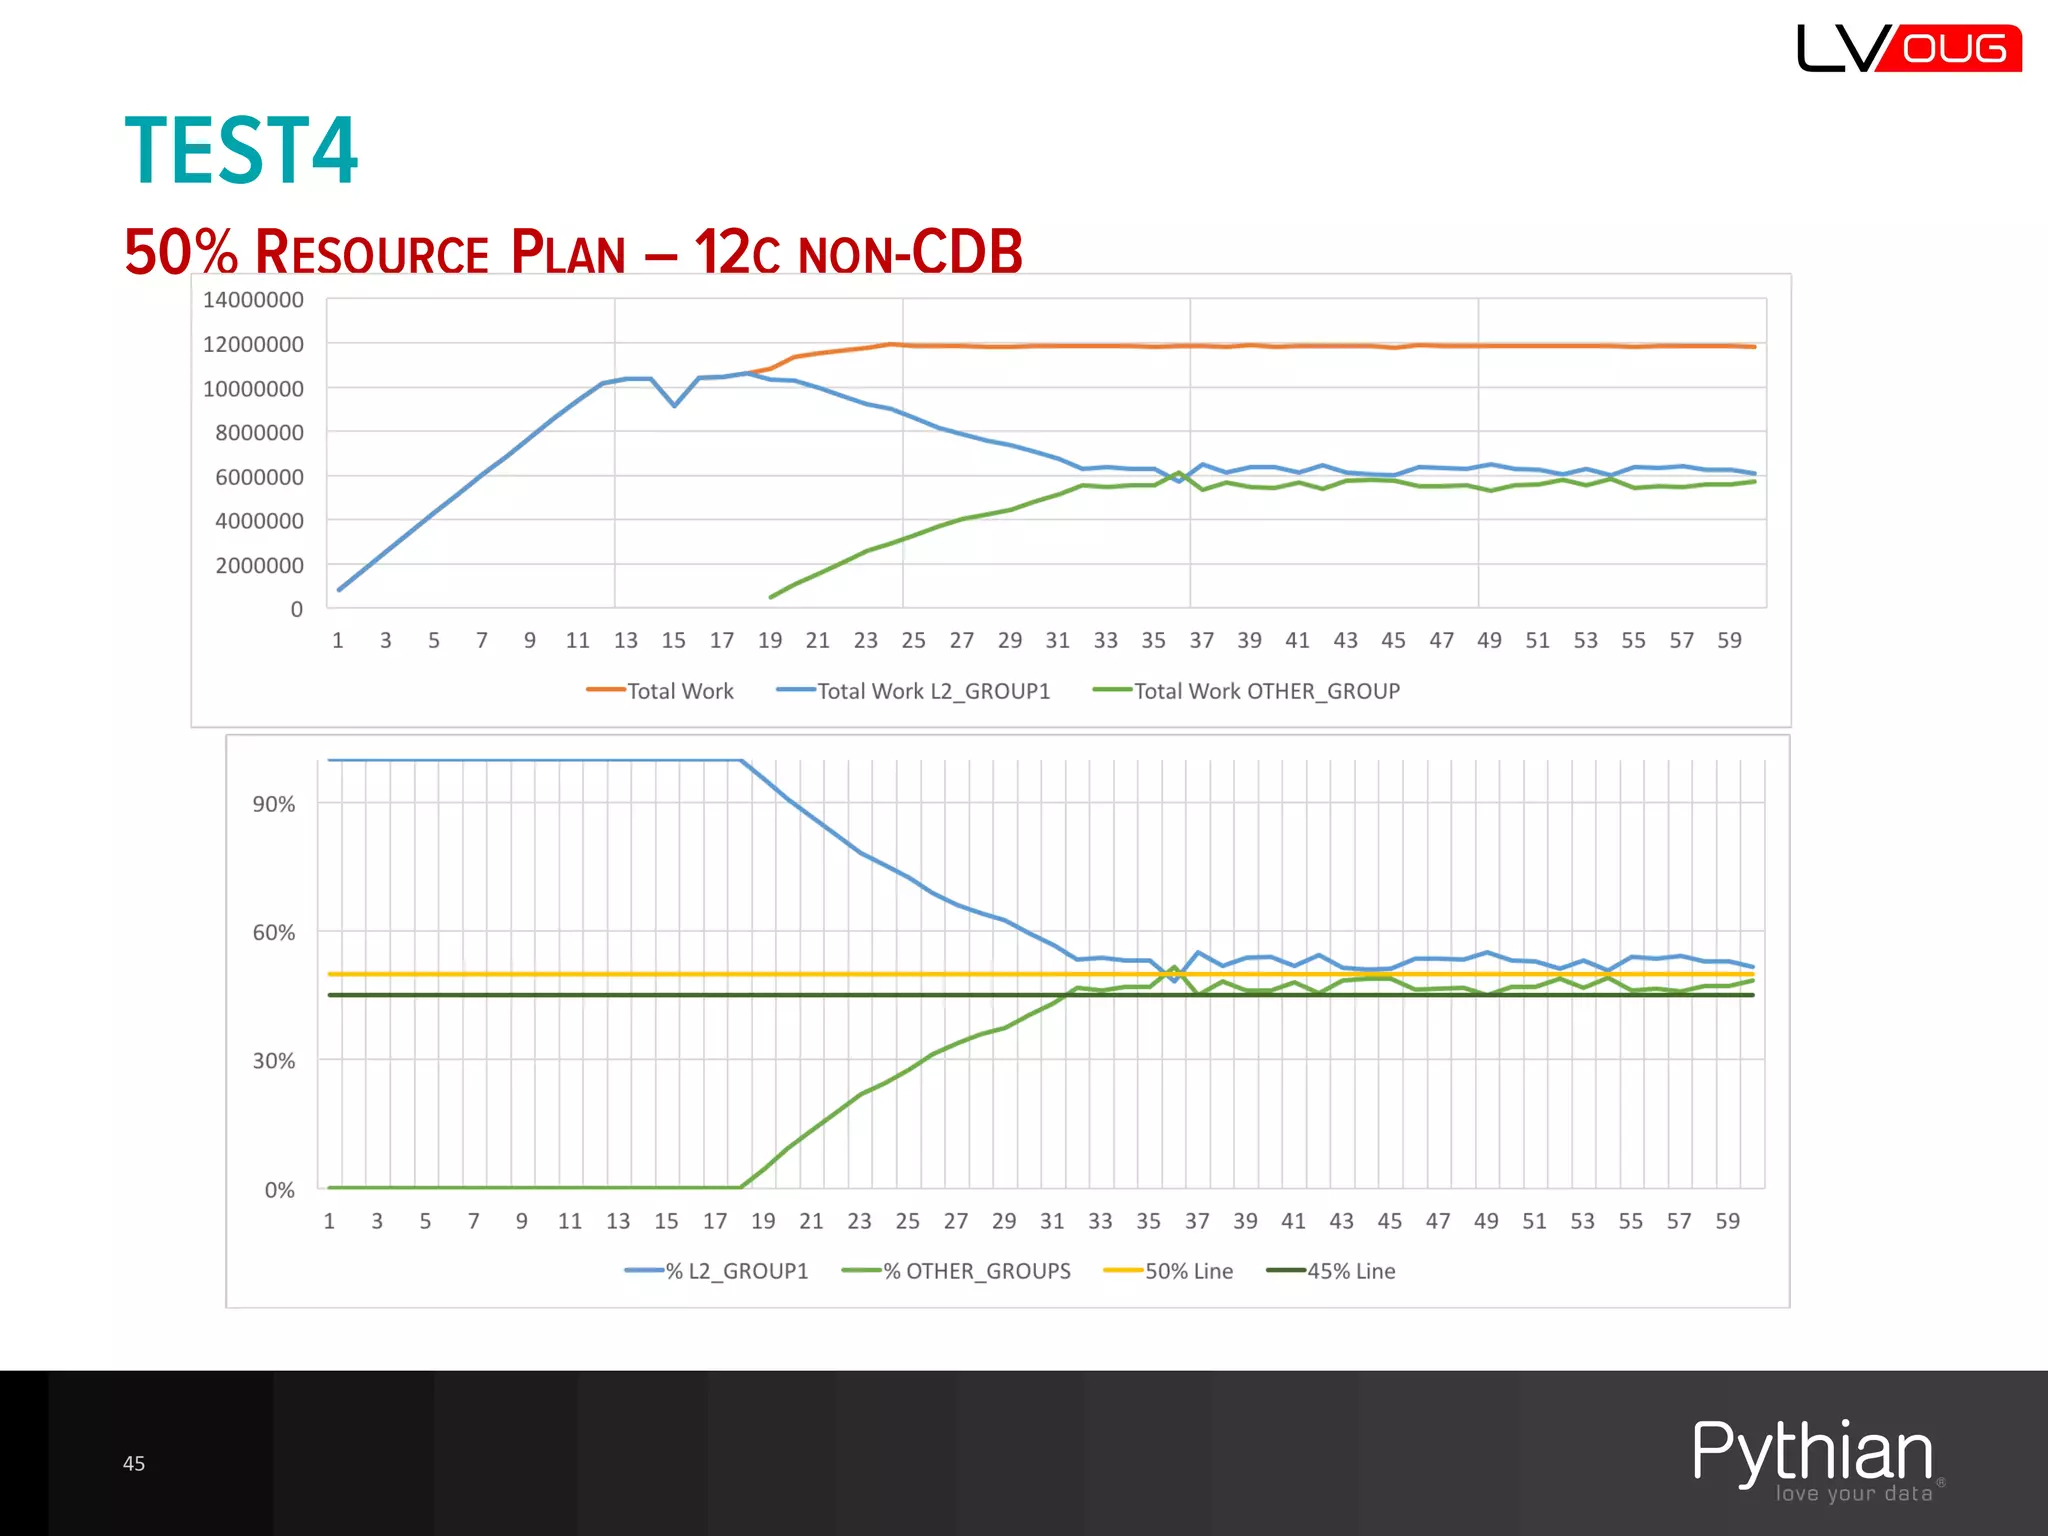
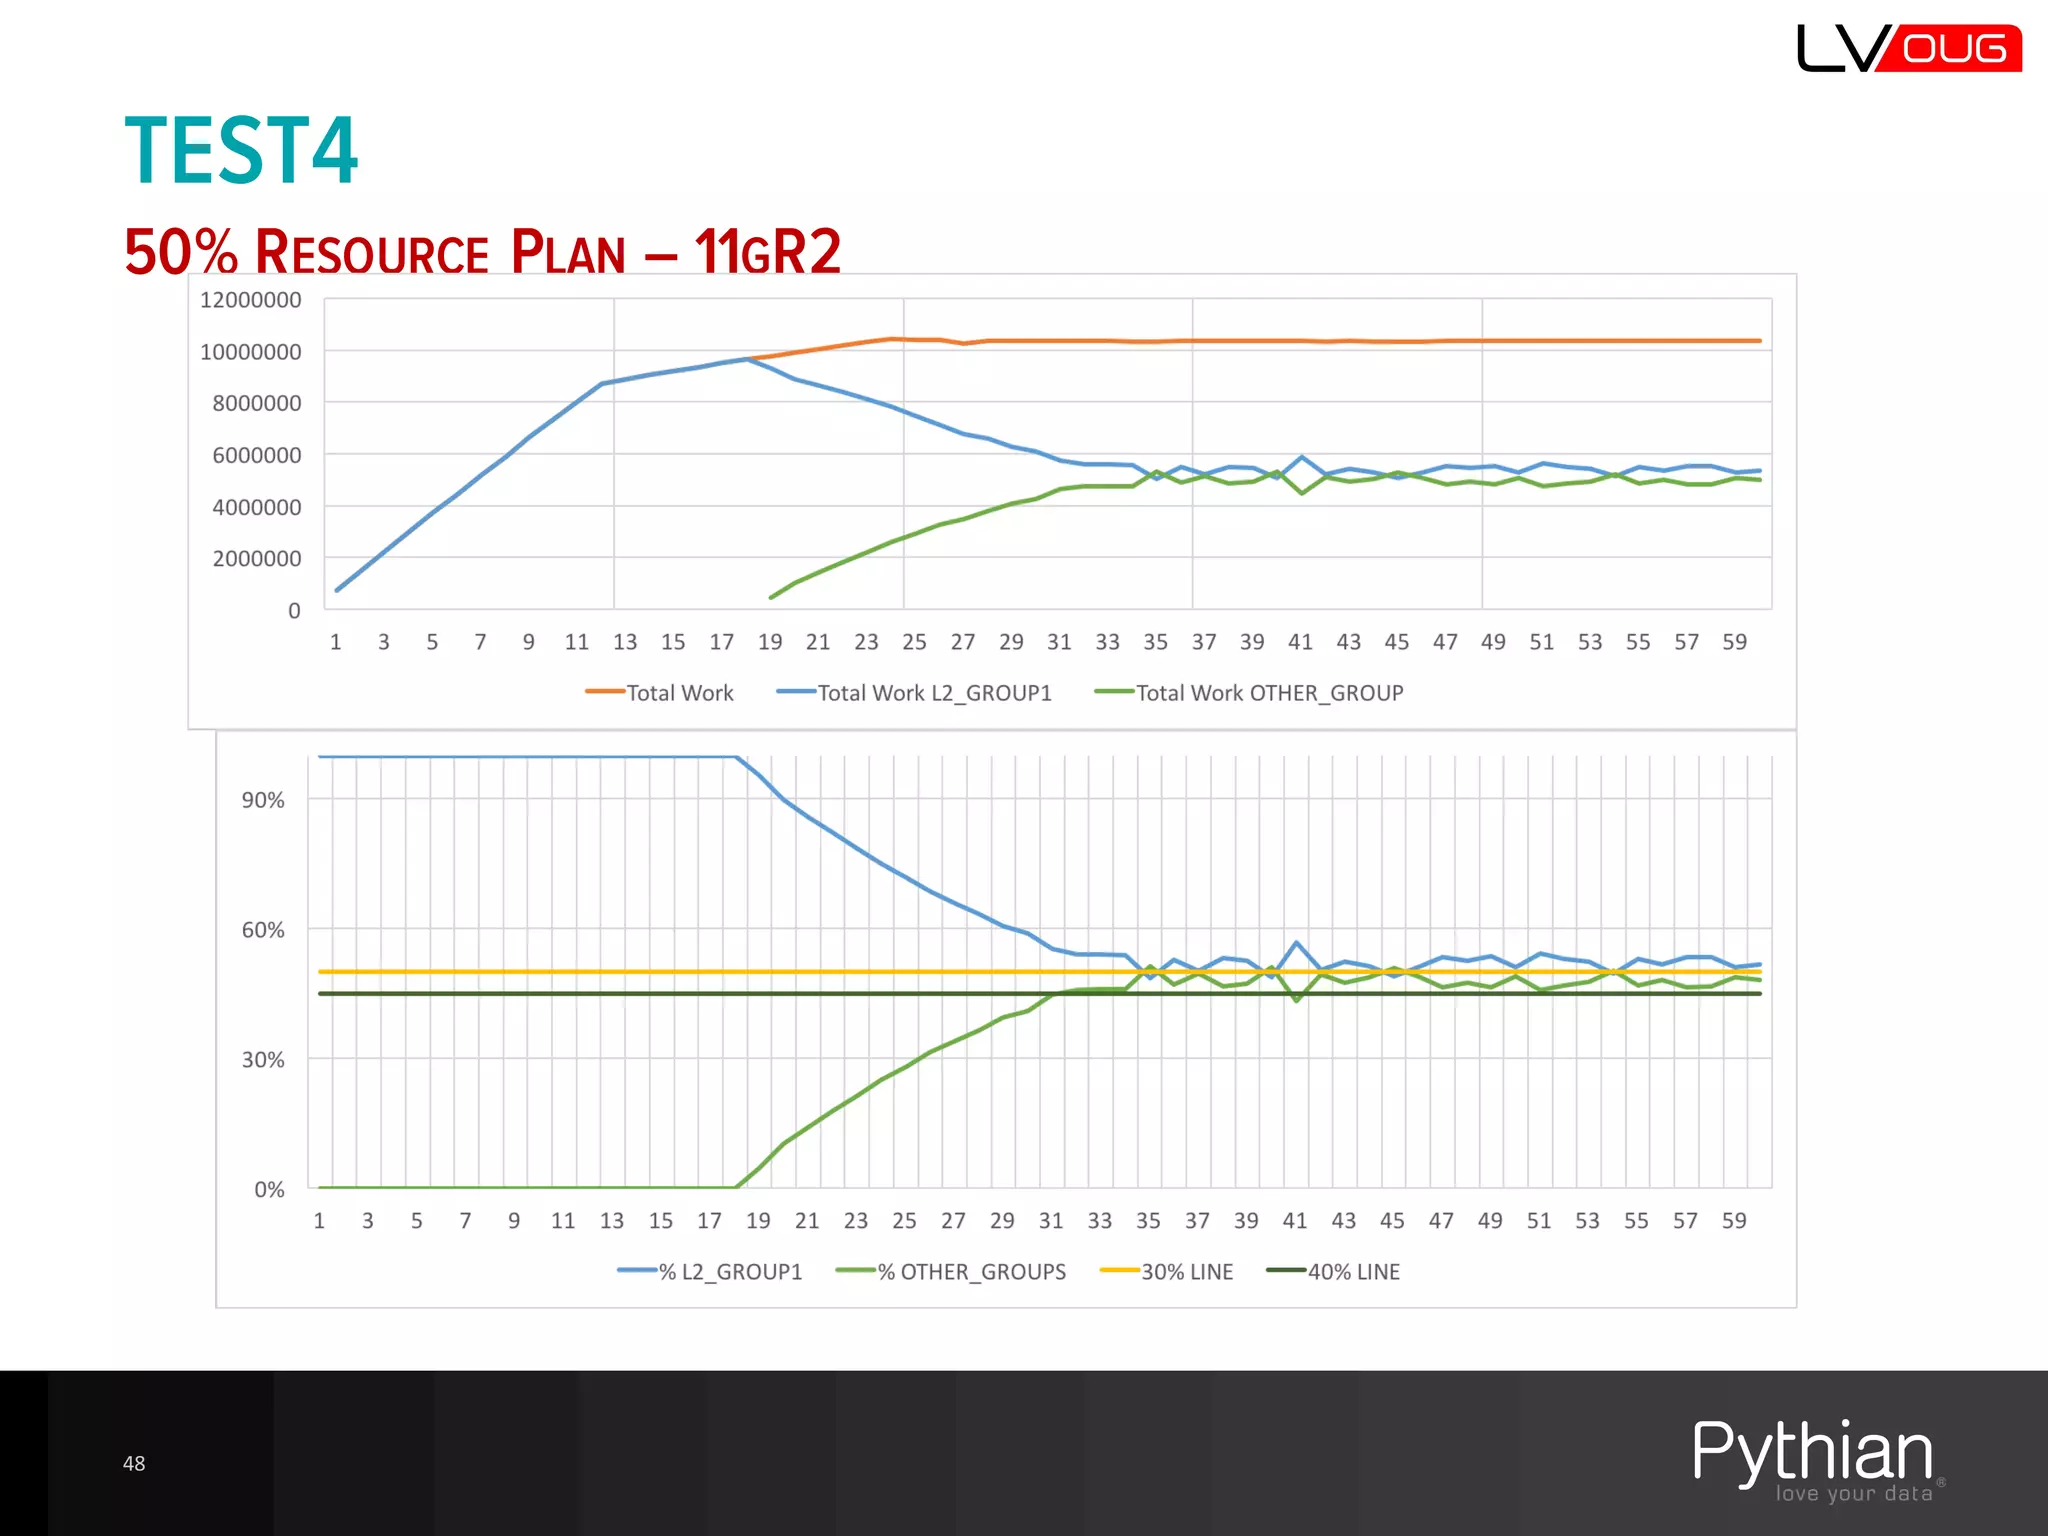
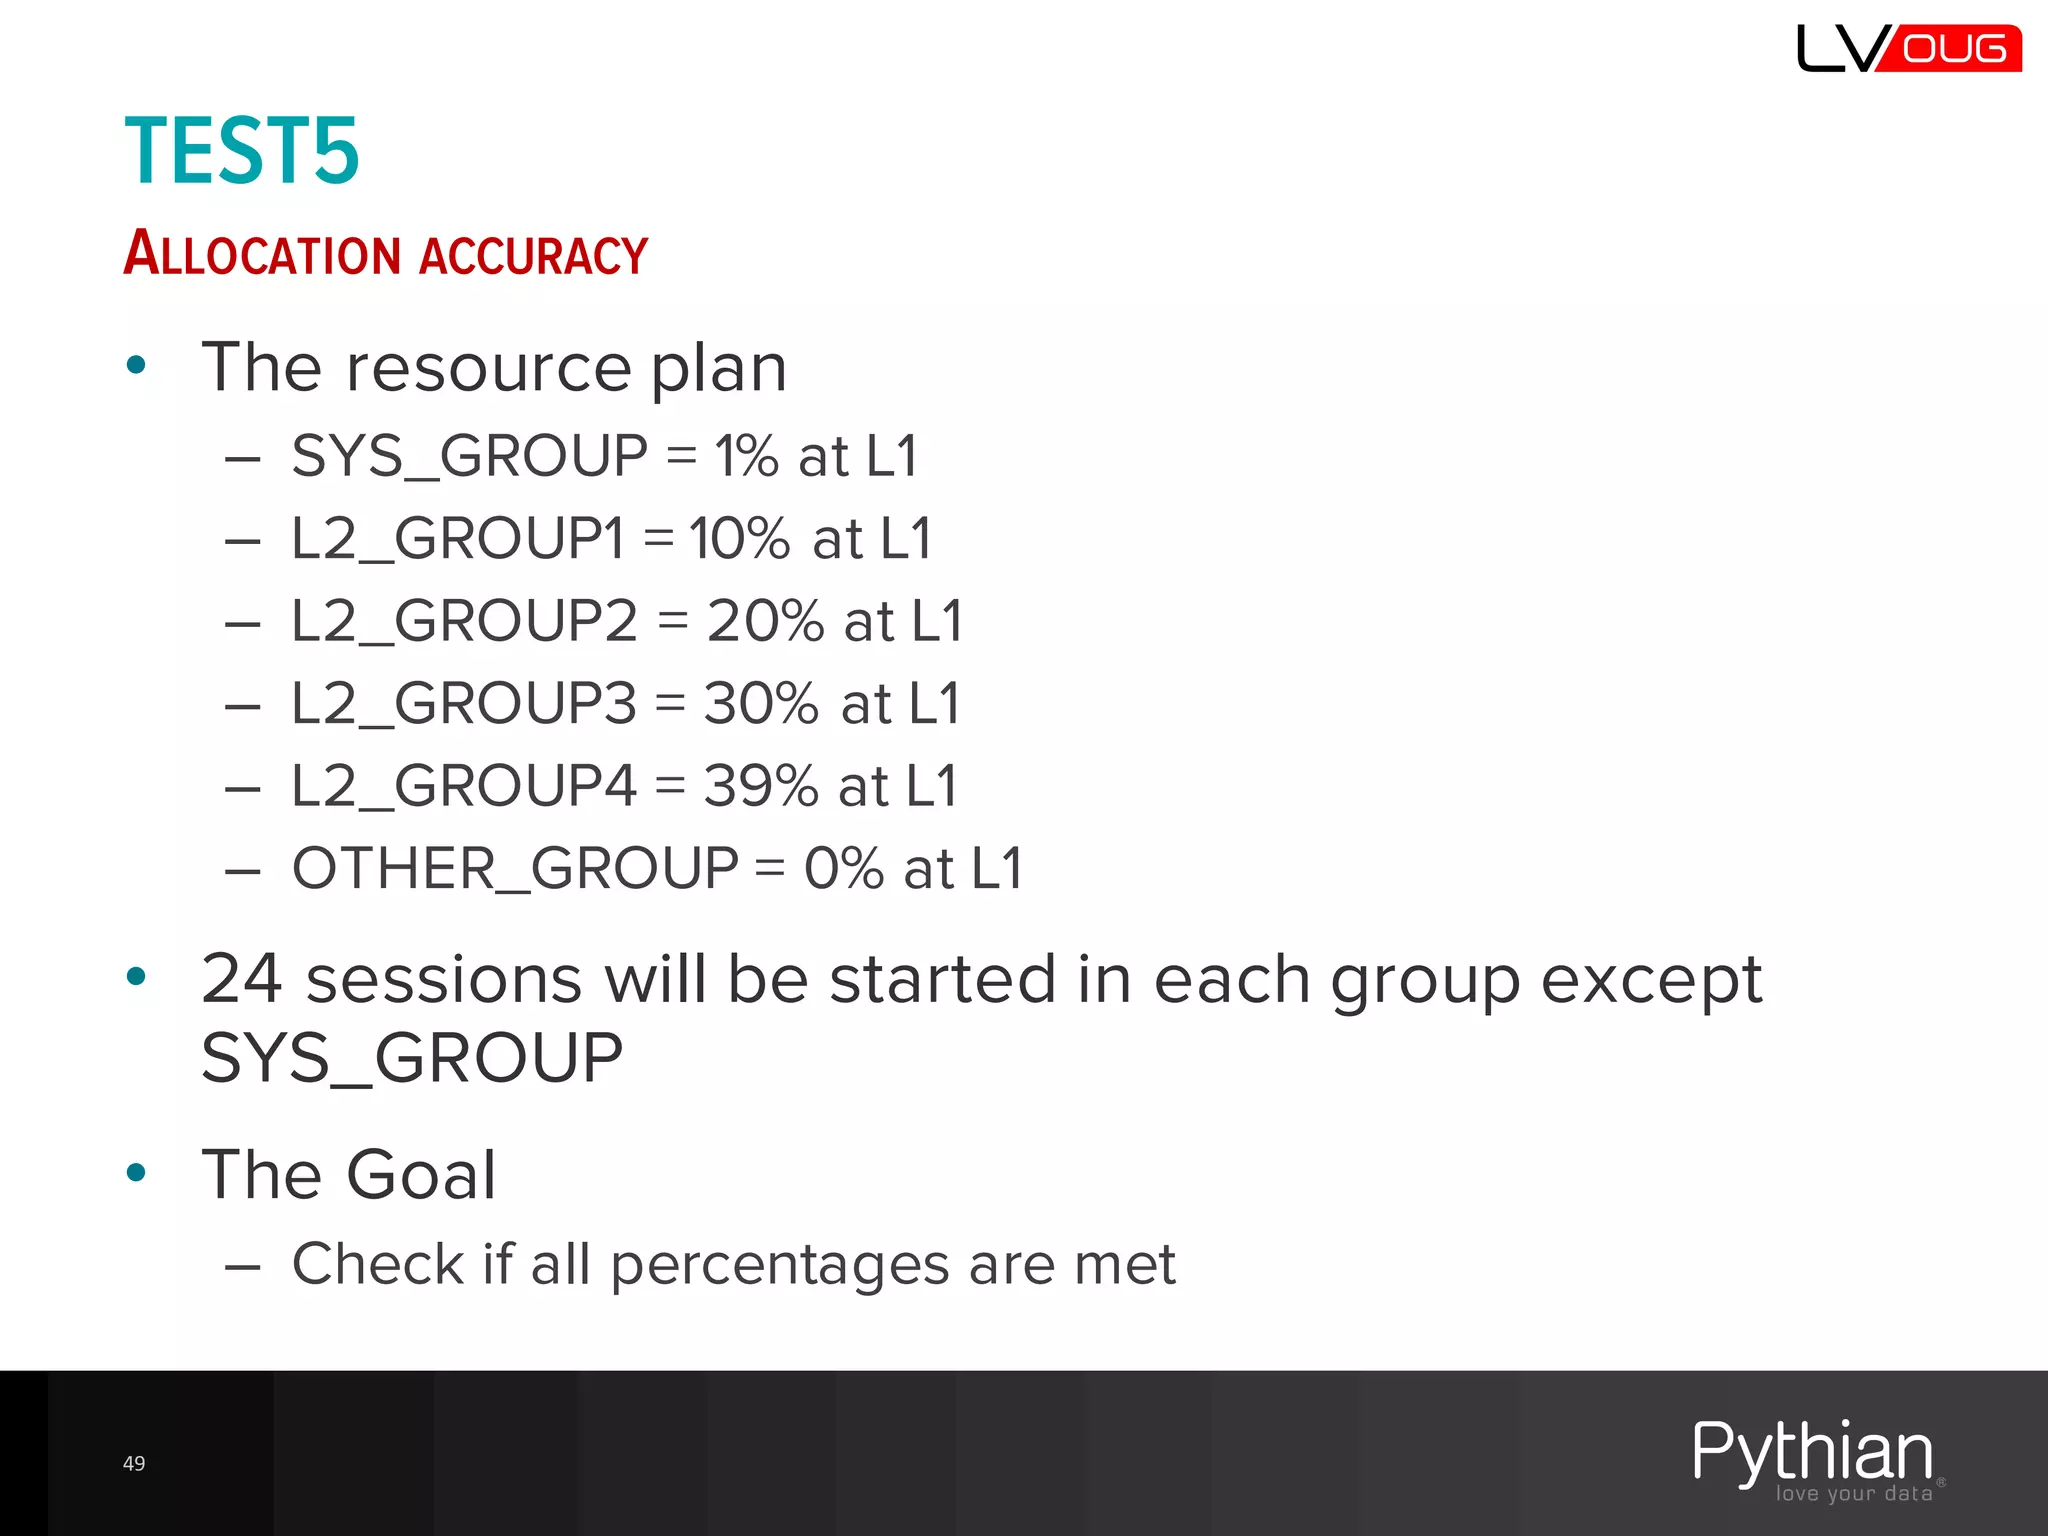
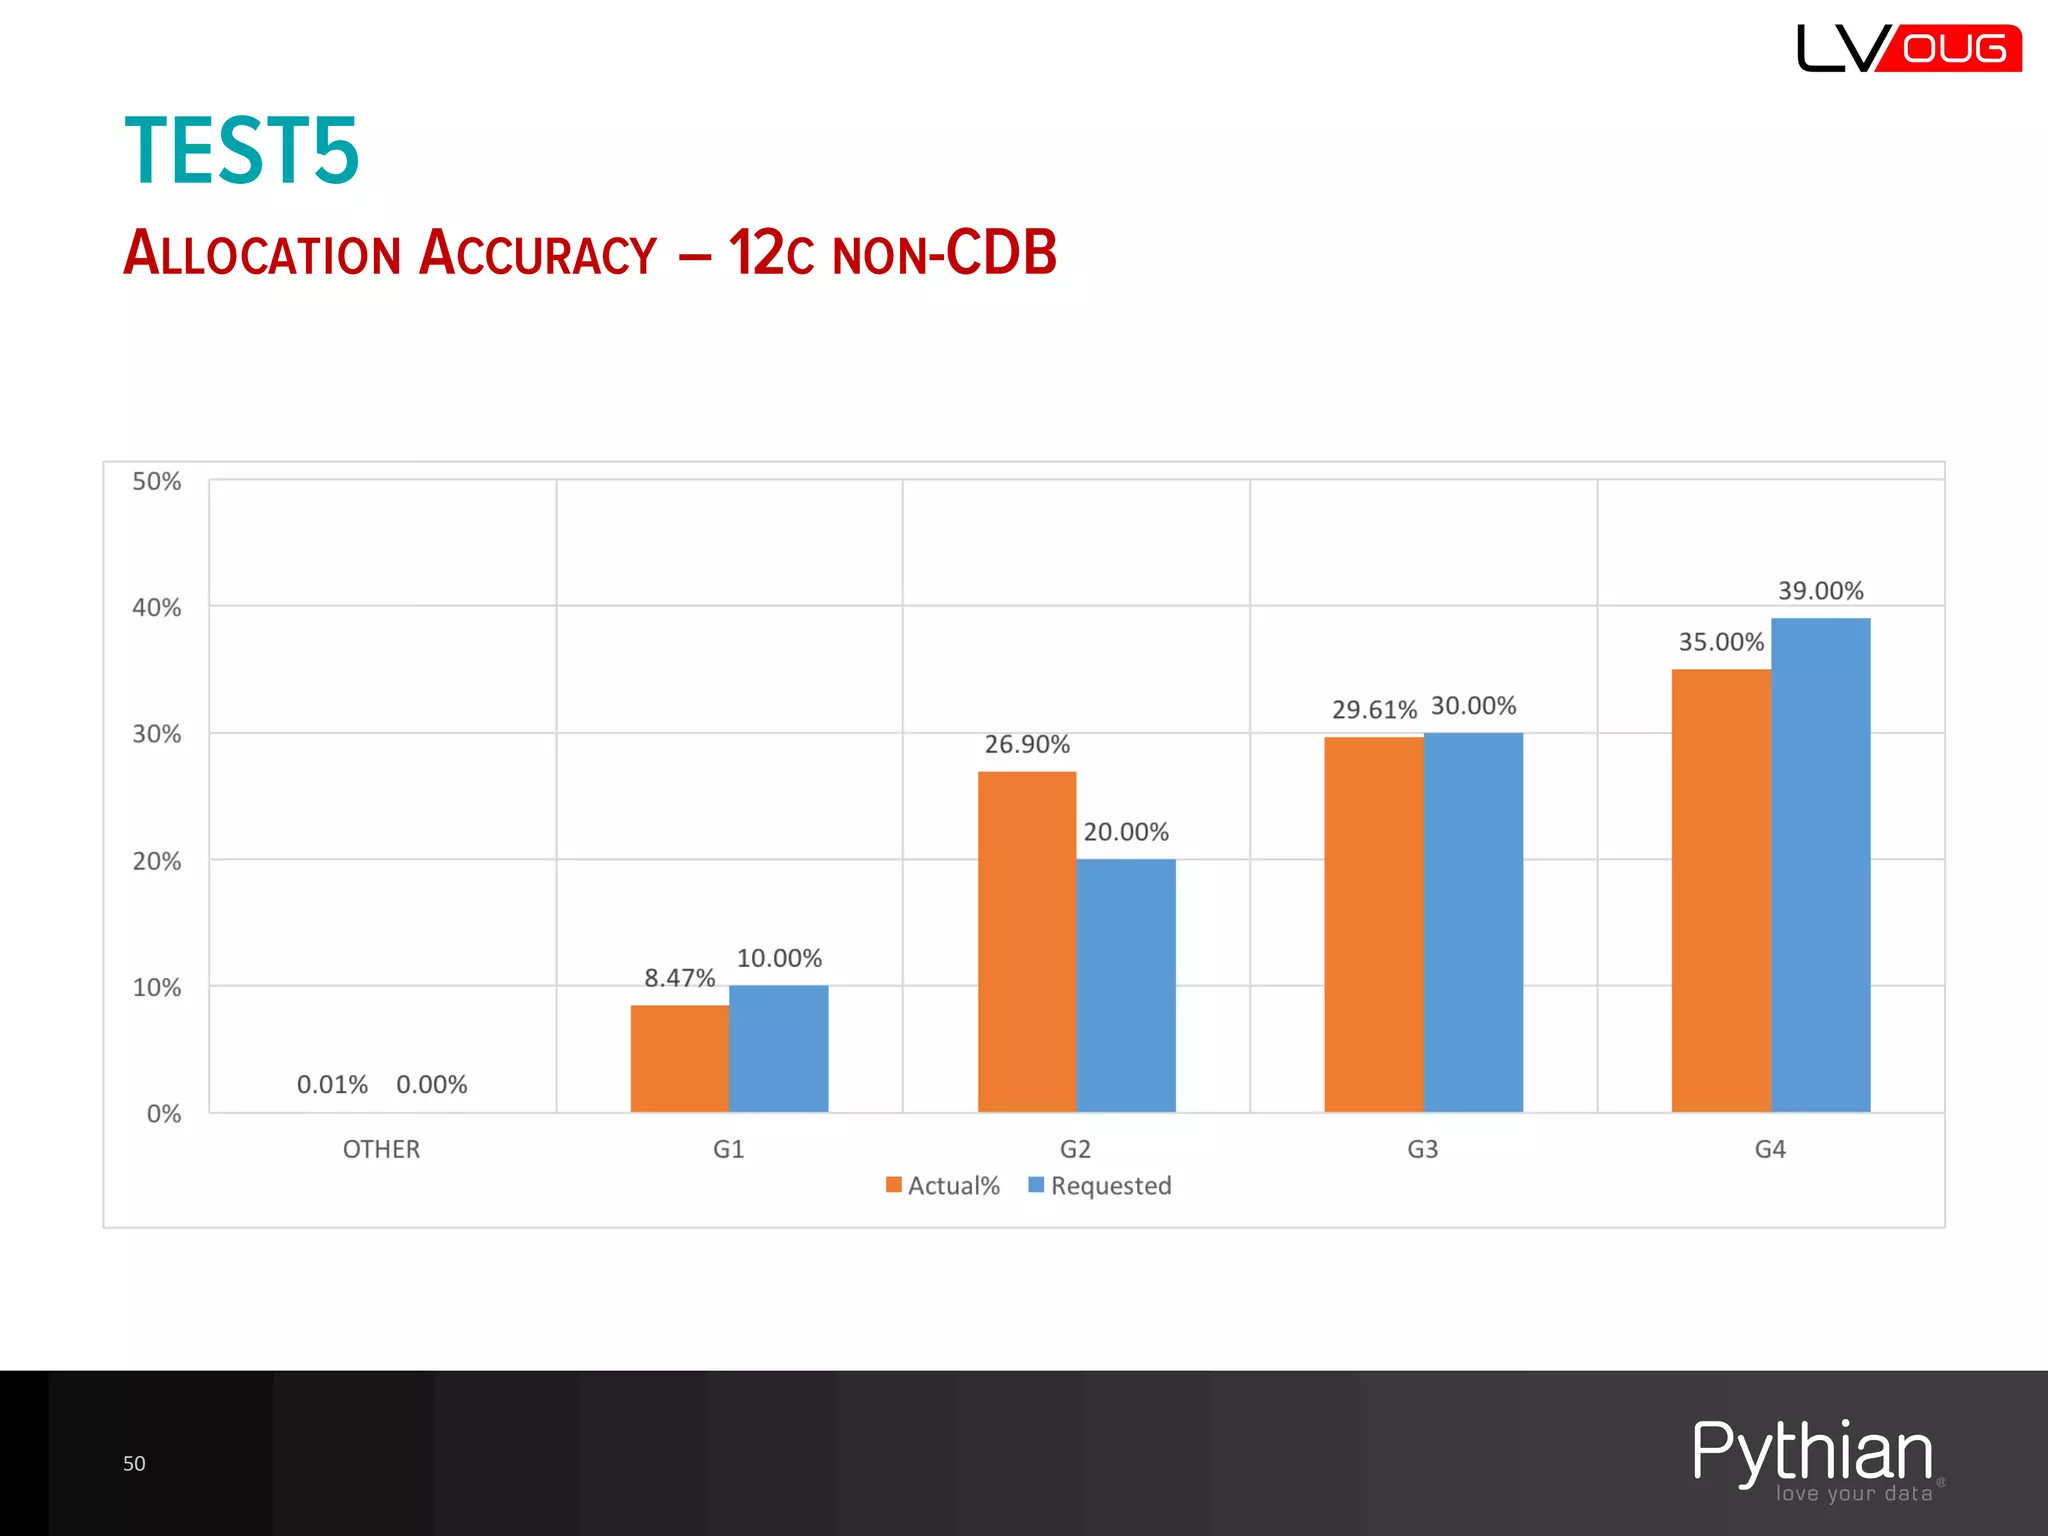
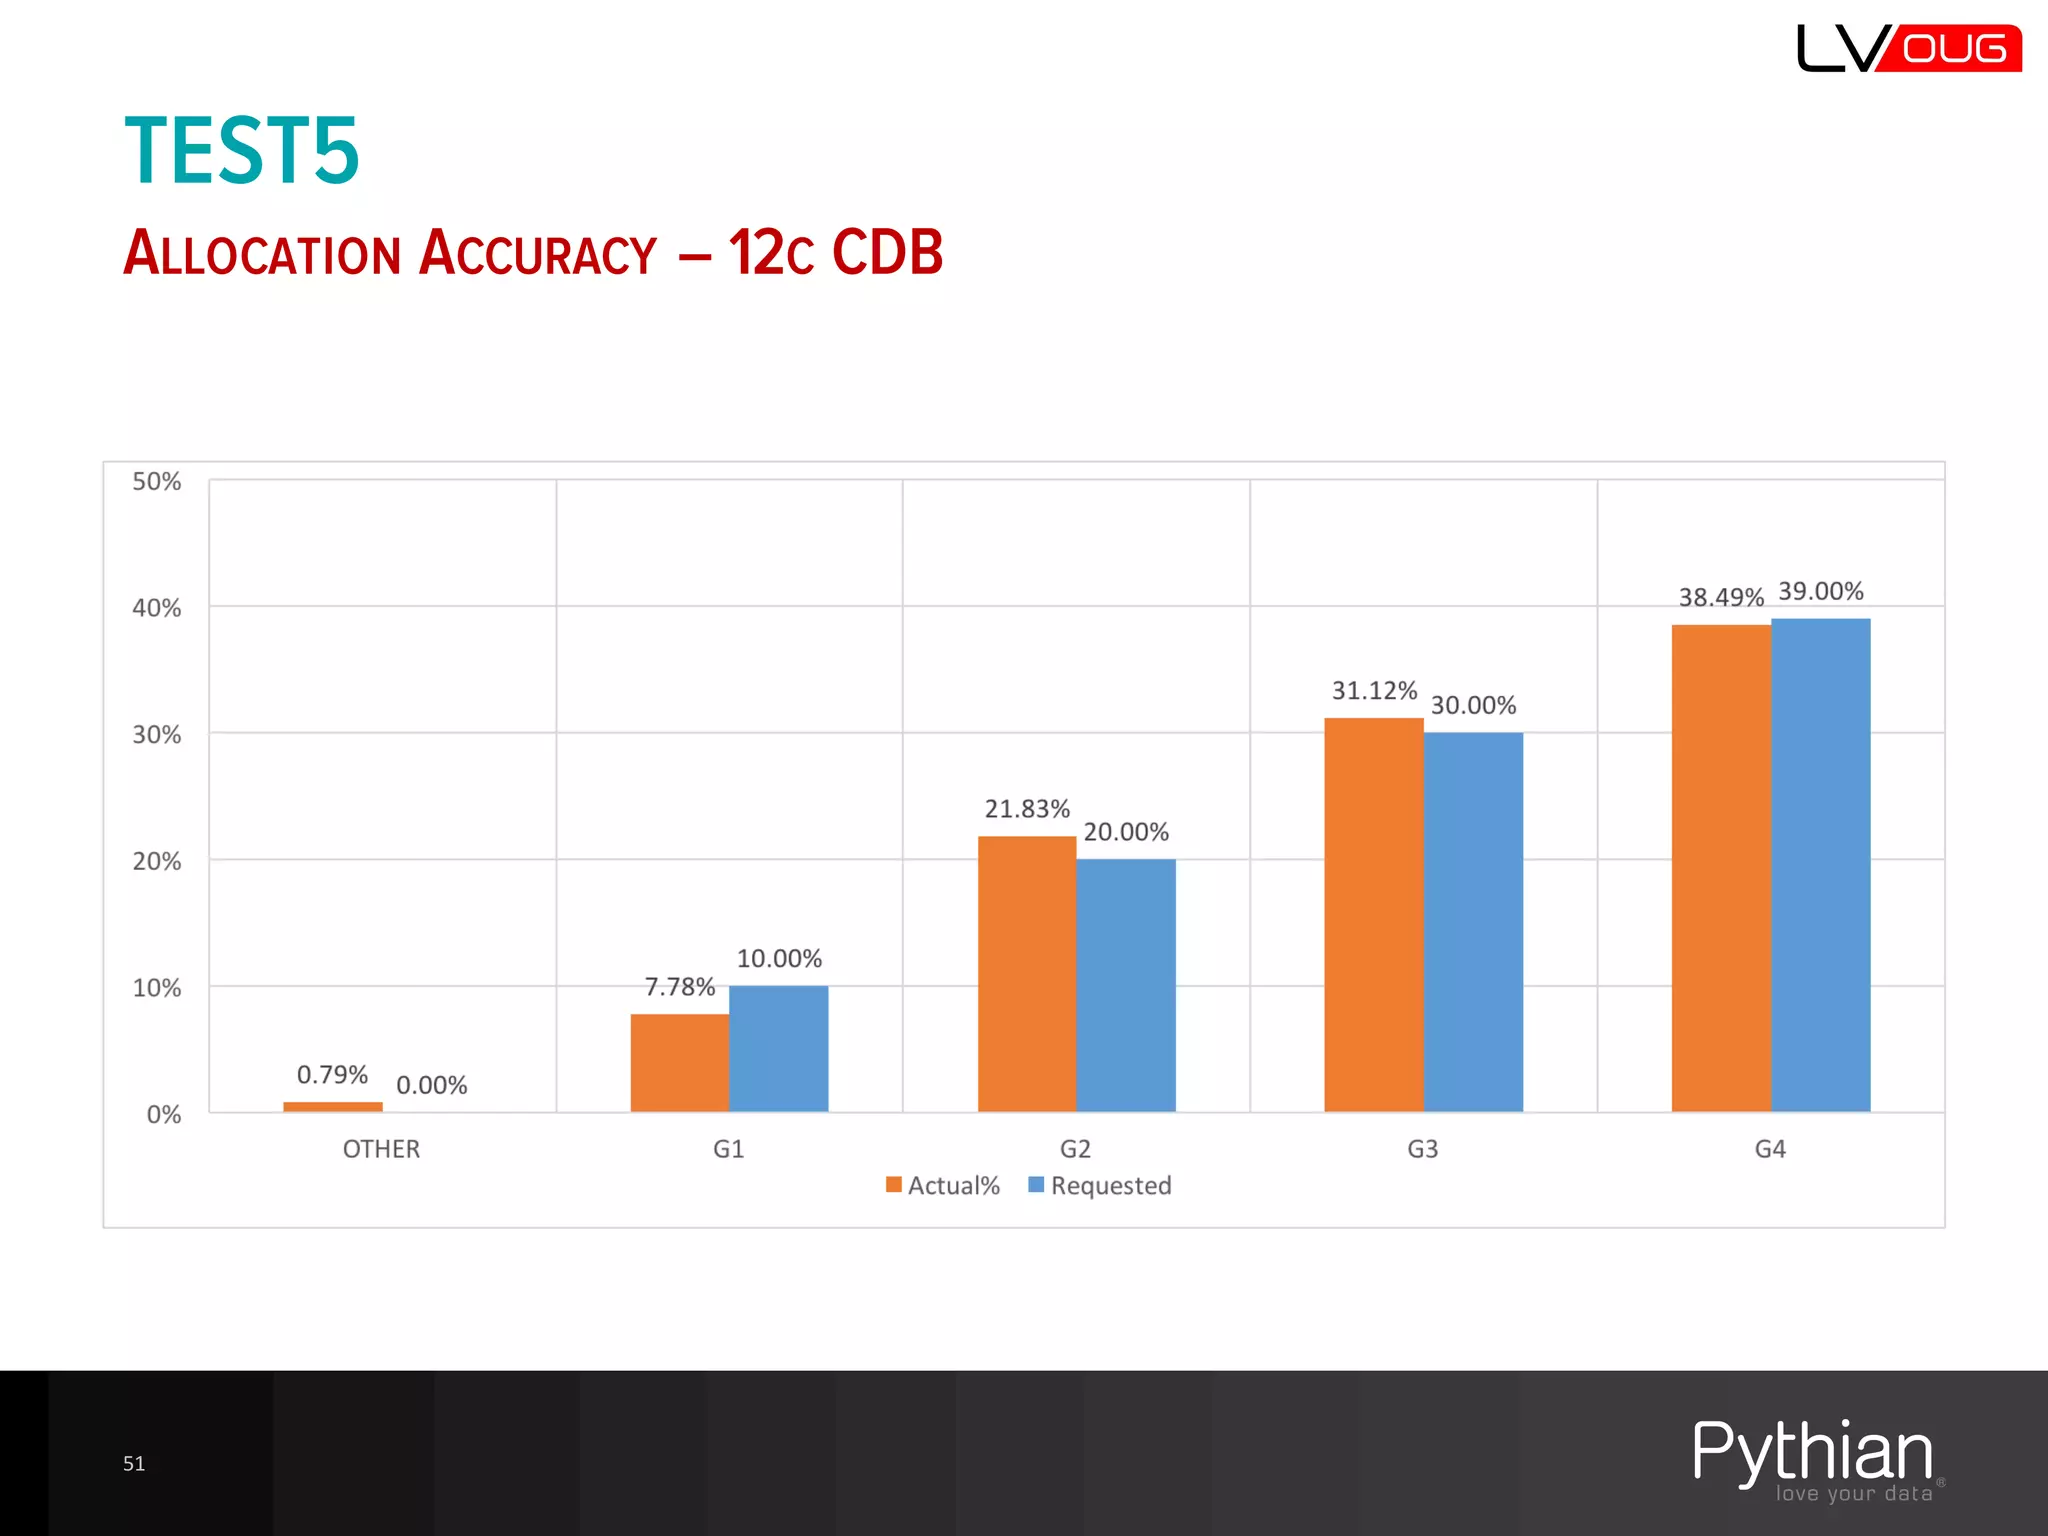
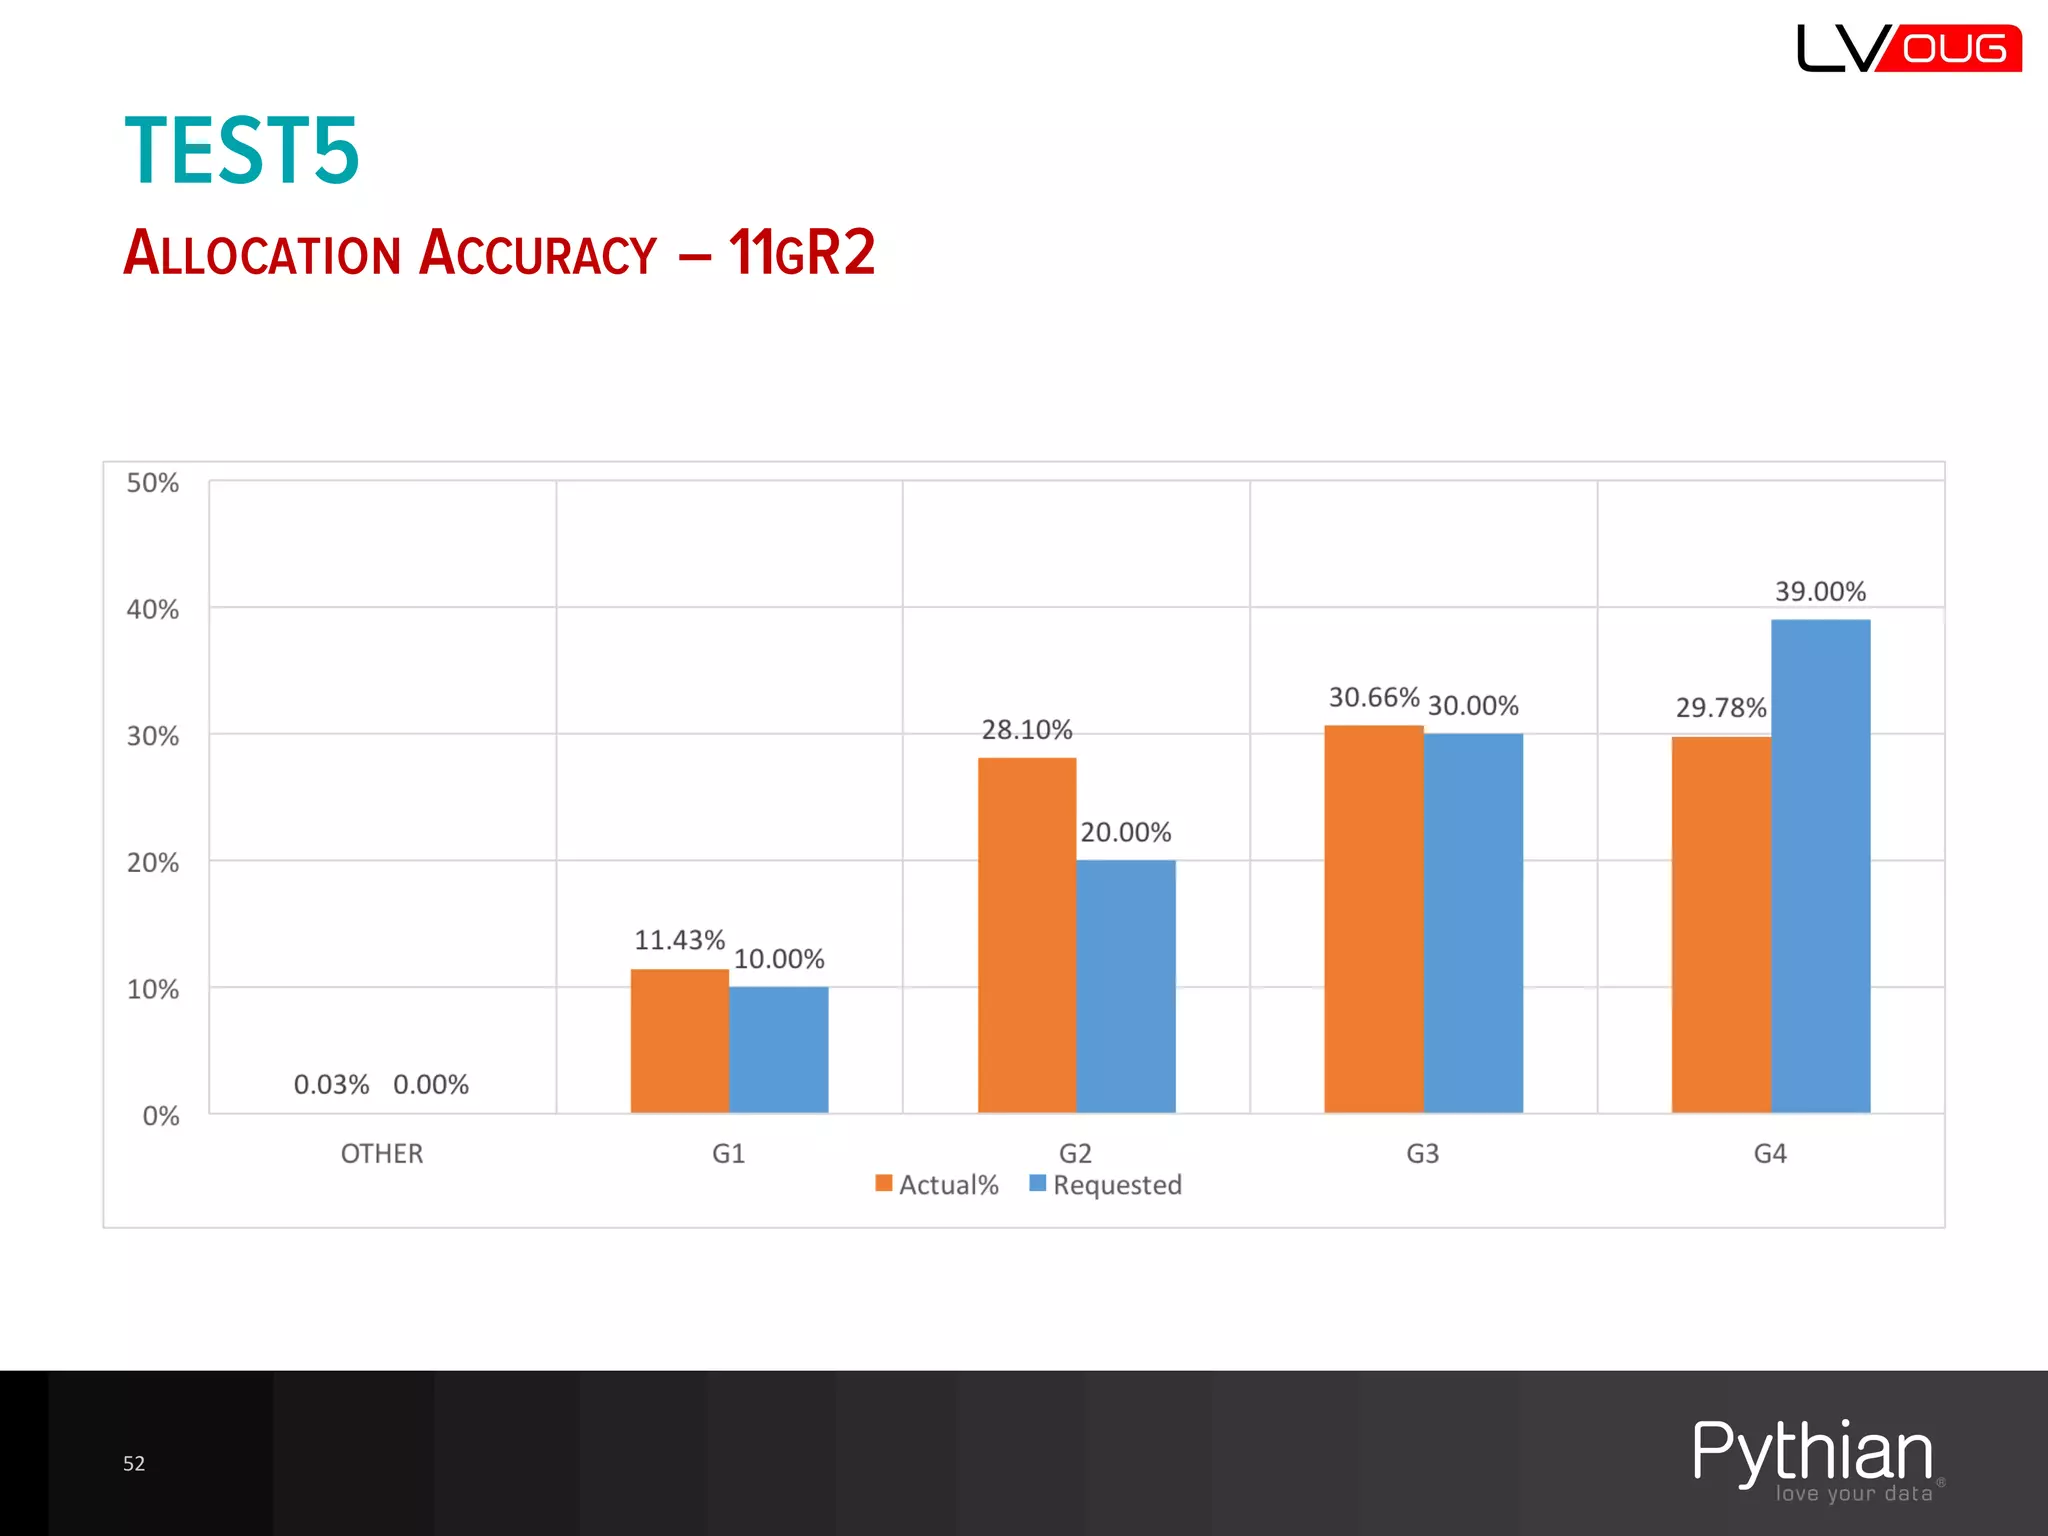
Experimental results on different resource plans highlighting CPU allocation accuracy and performance impacts.
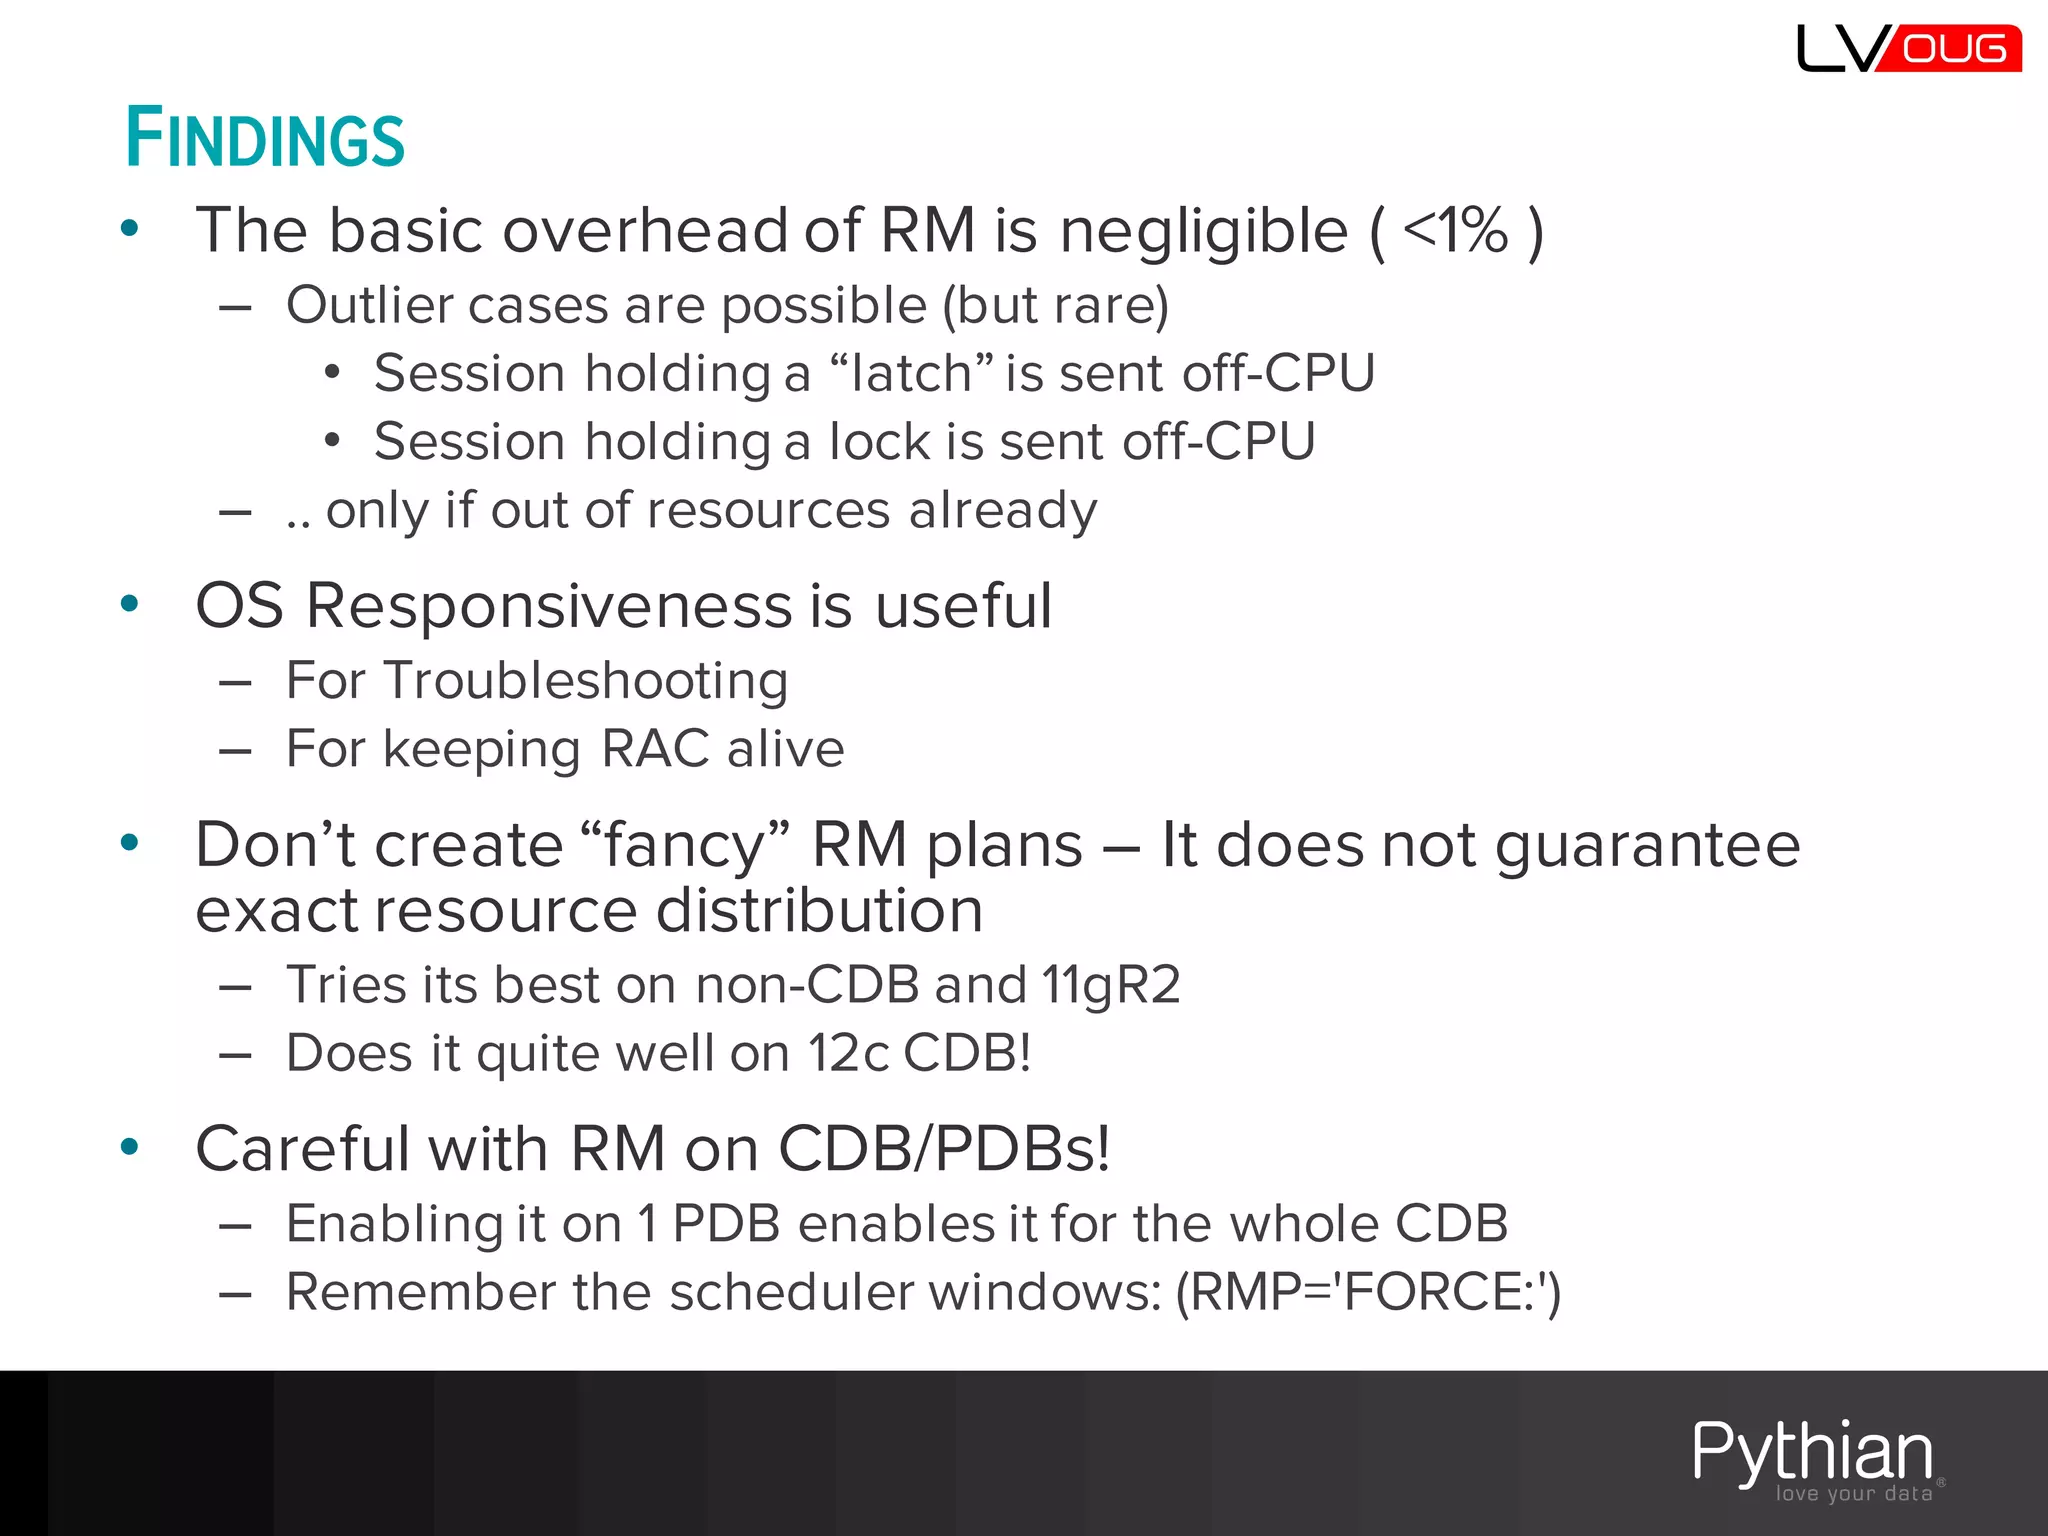
Summarized findings indicating RM overhead is negligible, along with performance insights and recommendations.