Downloaded 10 times

![[LinkedIn, twitter, slideshare, blog, email, mobile, …]
Few words about Yury
Yury Oracle](https://image.slidesharecdn.com/collaborate2015awrdataminingv1-151210150737/75/OTN-tour-2015-AWR-data-mining-4-2048.jpg)

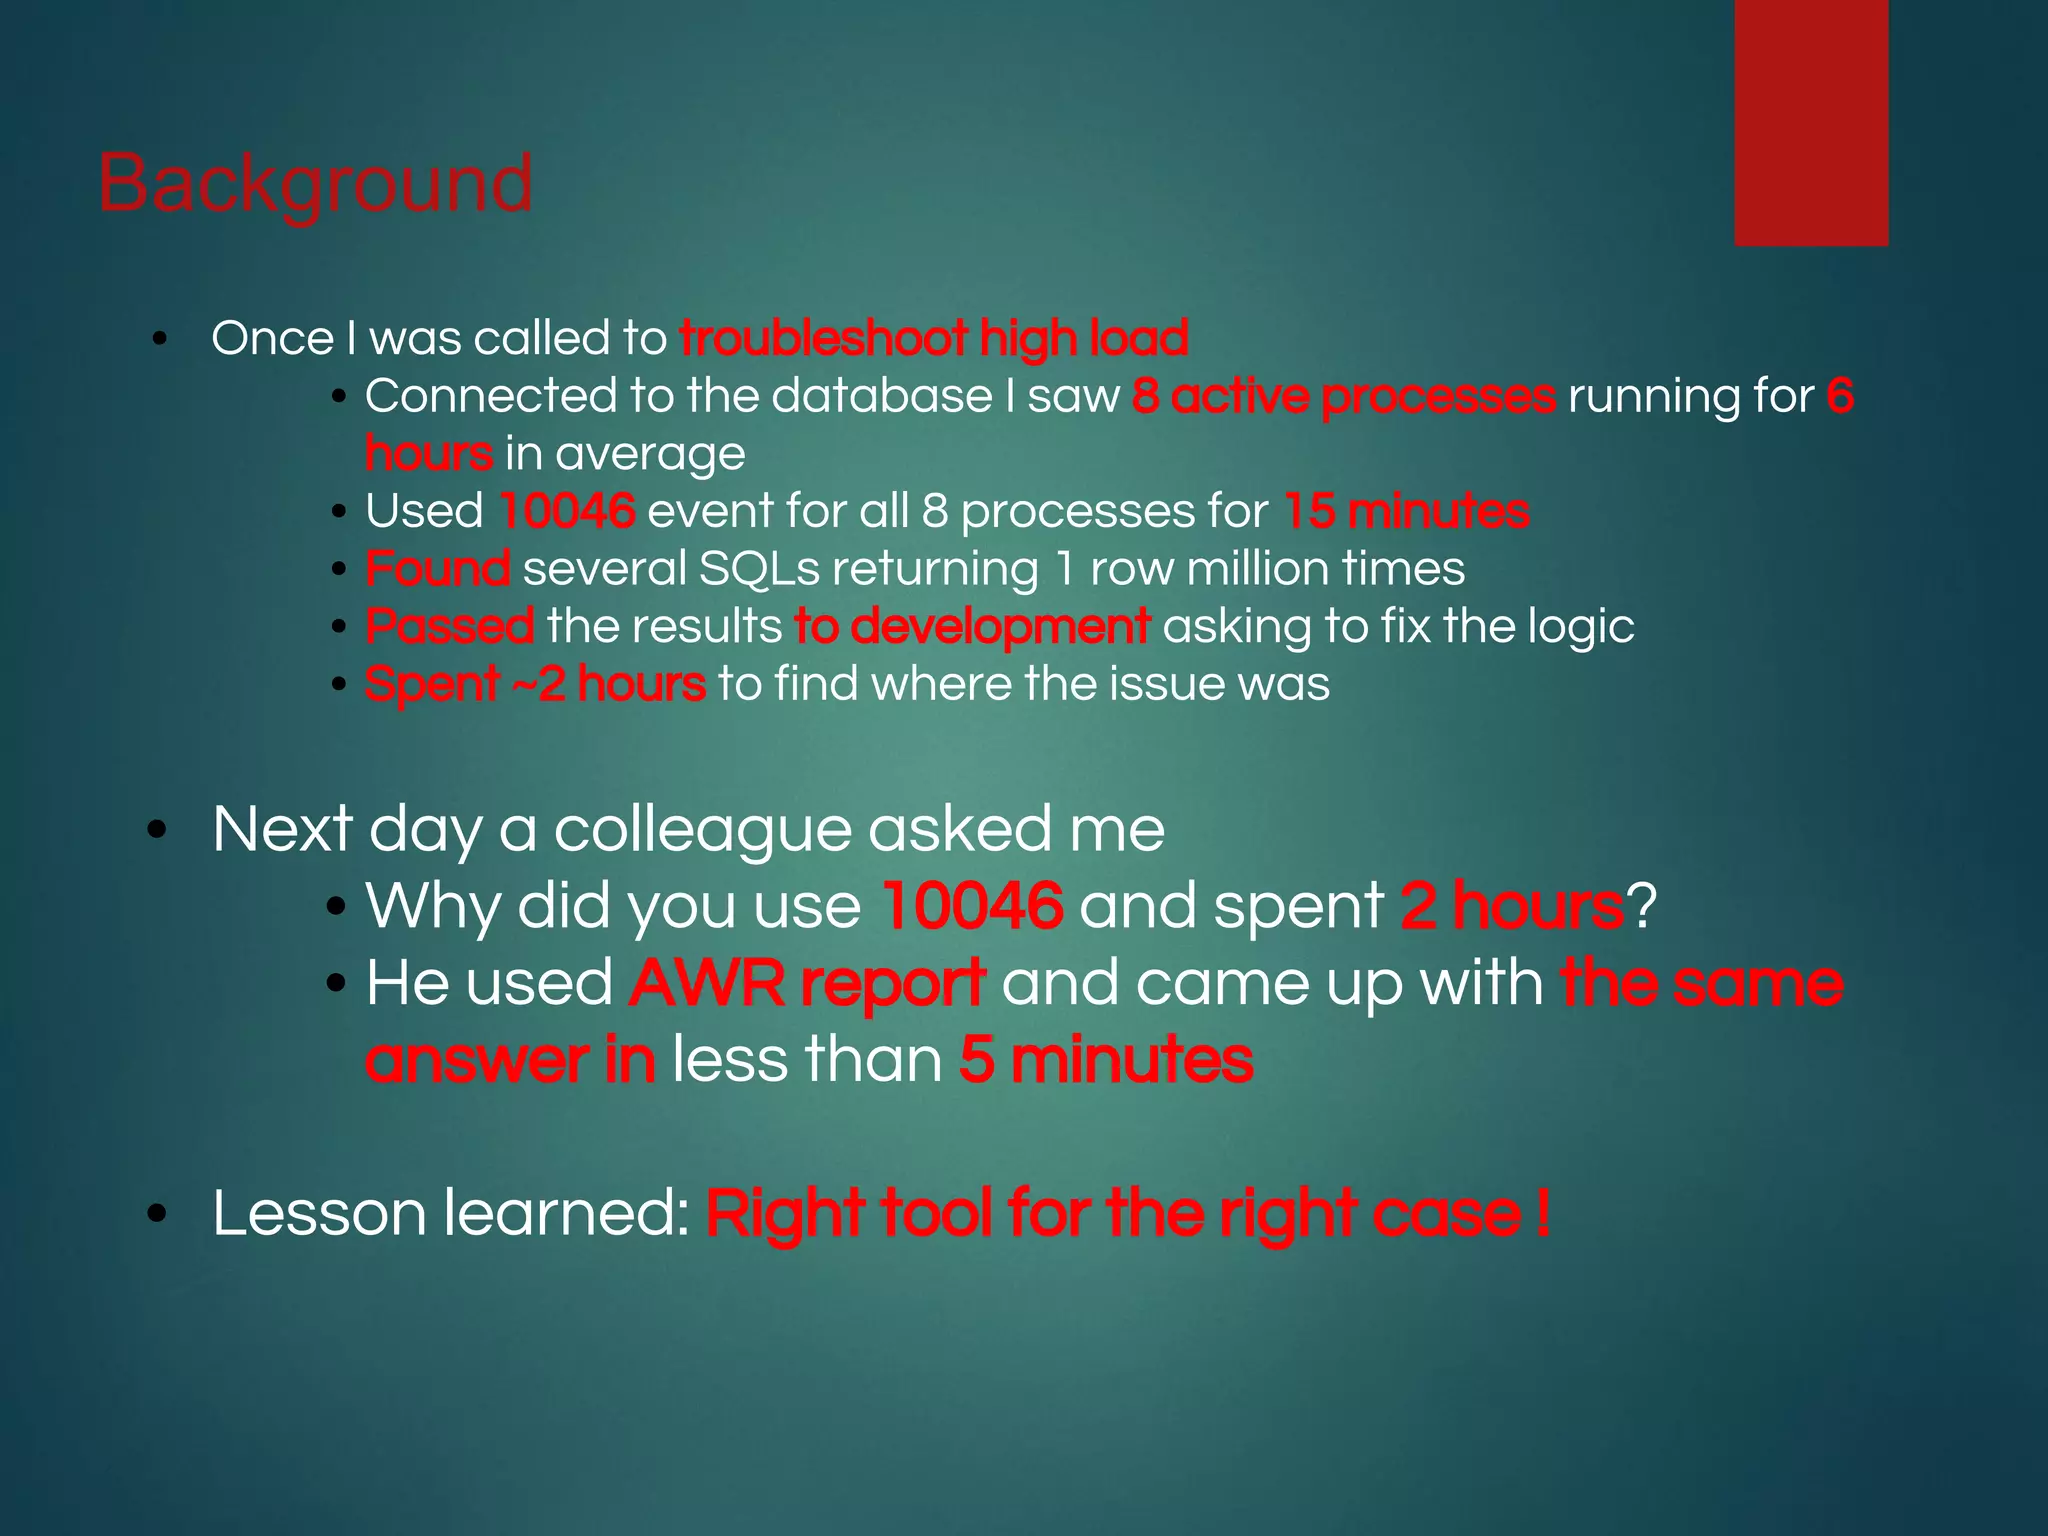
![Background
• AWR is one of many RDBMS performance data sources
• Sometimes it isn’t the best source (aggregation)
• SQL Extended trace (event 10046)
• RAW trace
• tkprof
• TRCAnlzr [ID 224270.1]
• Method-R state of art tools
• PL/SQL Profiler
• LTOM (Session Trace Collector)
• others
• Sometimes it is the best/efficient source!
• Sometimes it is the only one available!](https://image.slidesharecdn.com/collaborate2015awrdataminingv1-151210150737/75/OTN-tour-2015-AWR-data-mining-7-2048.jpg)
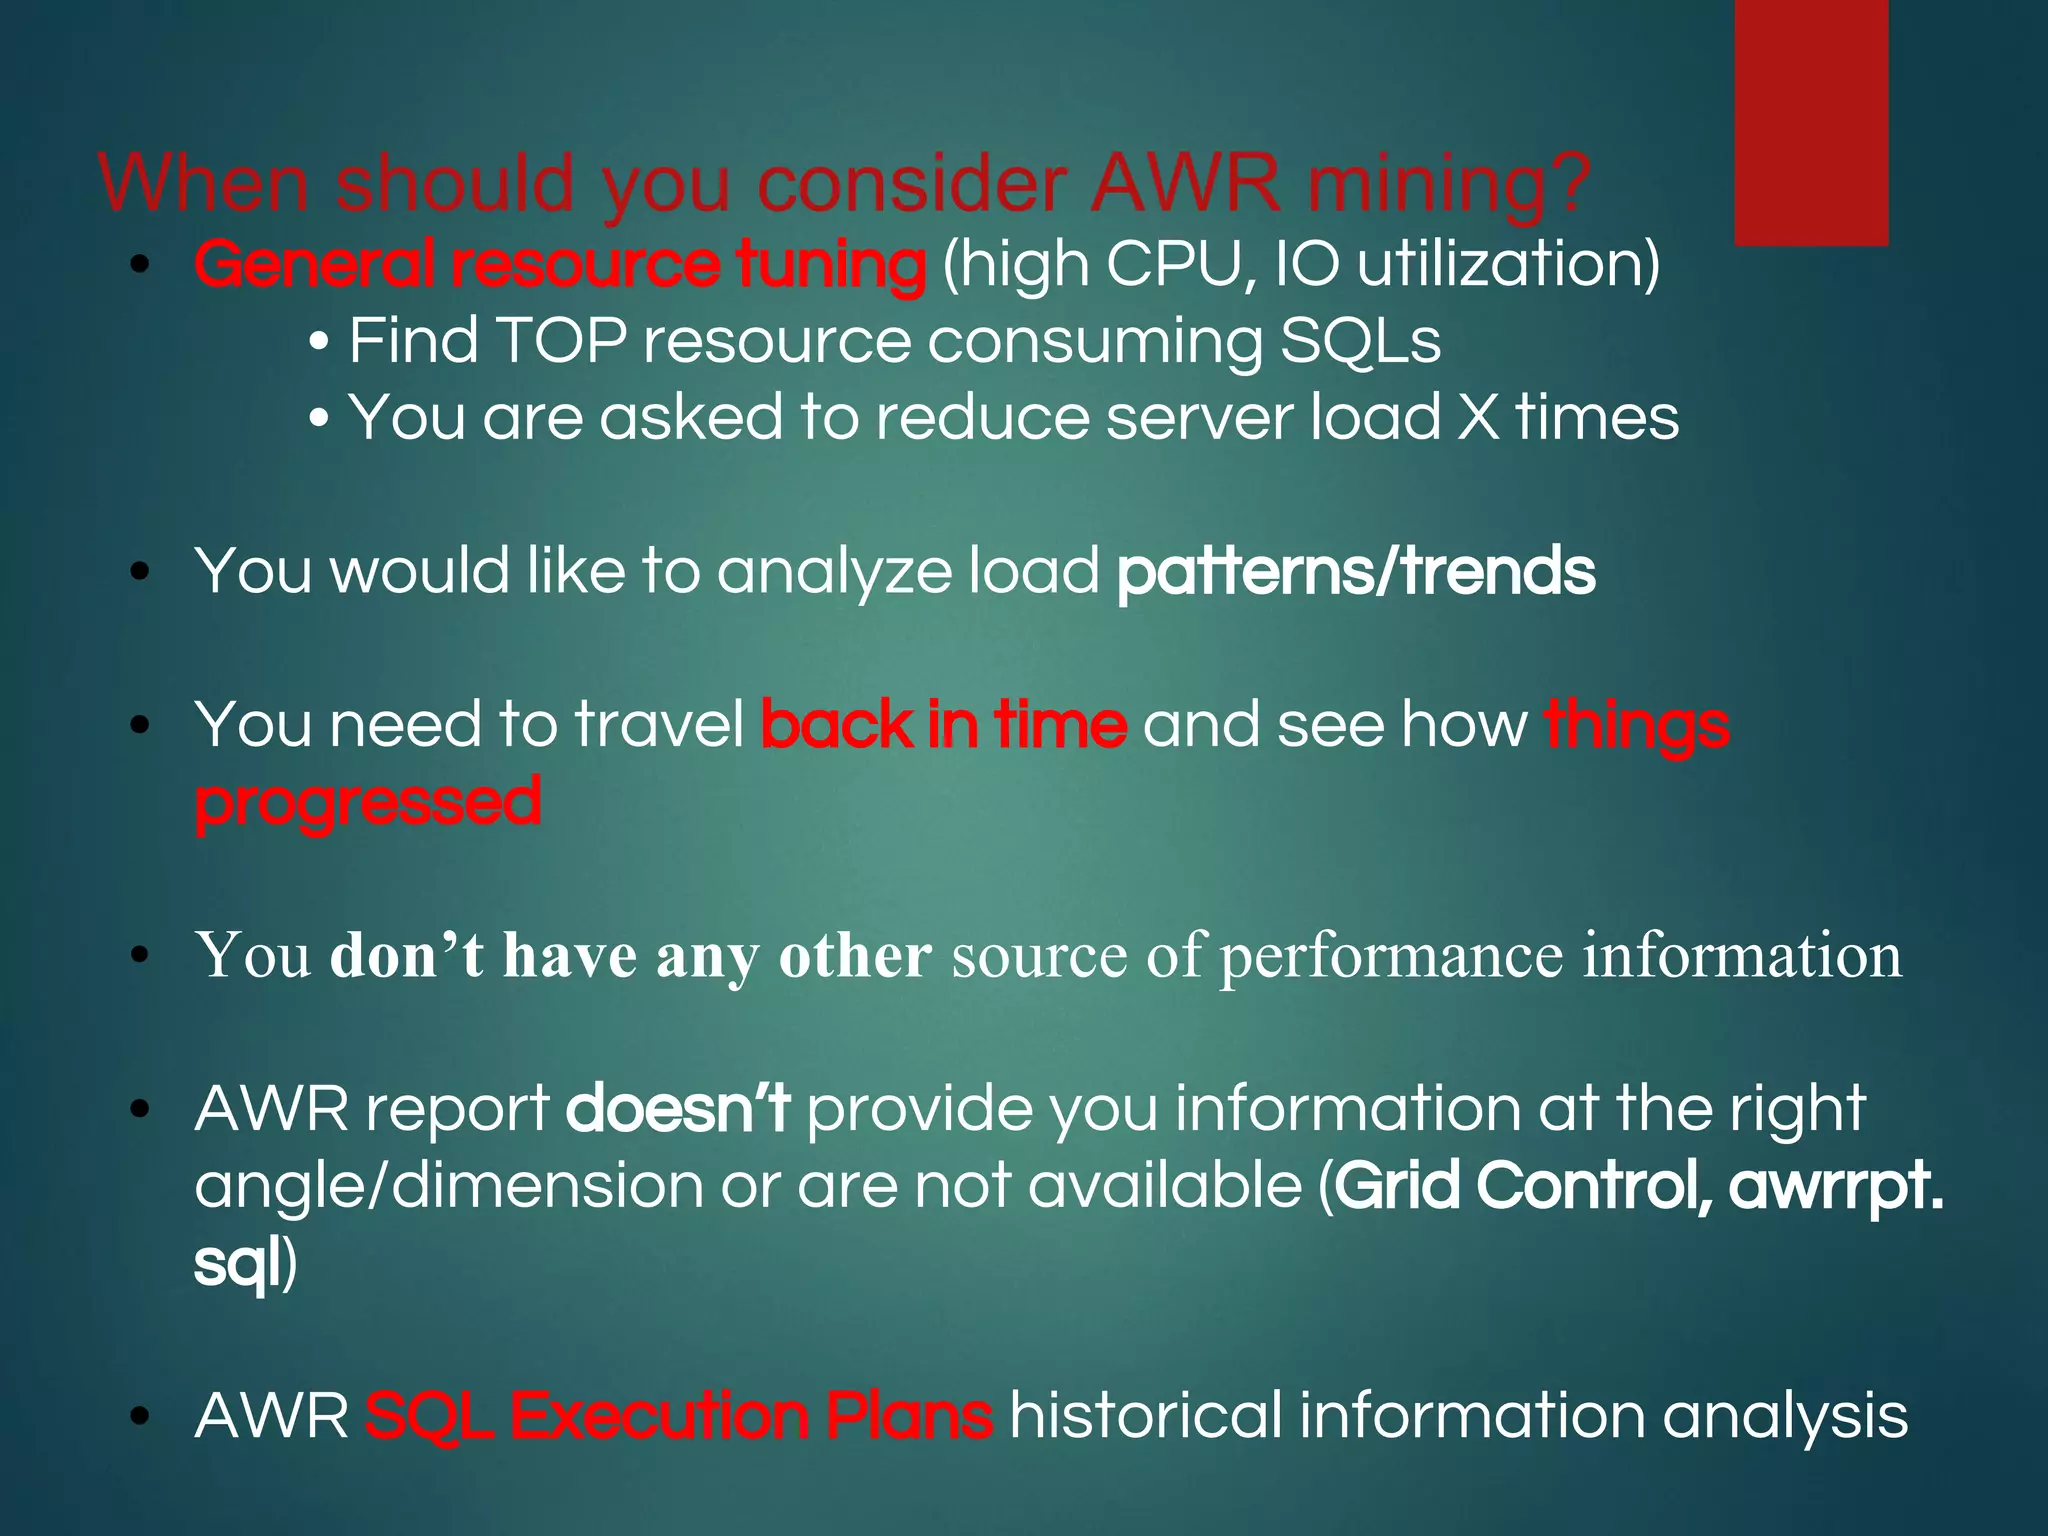
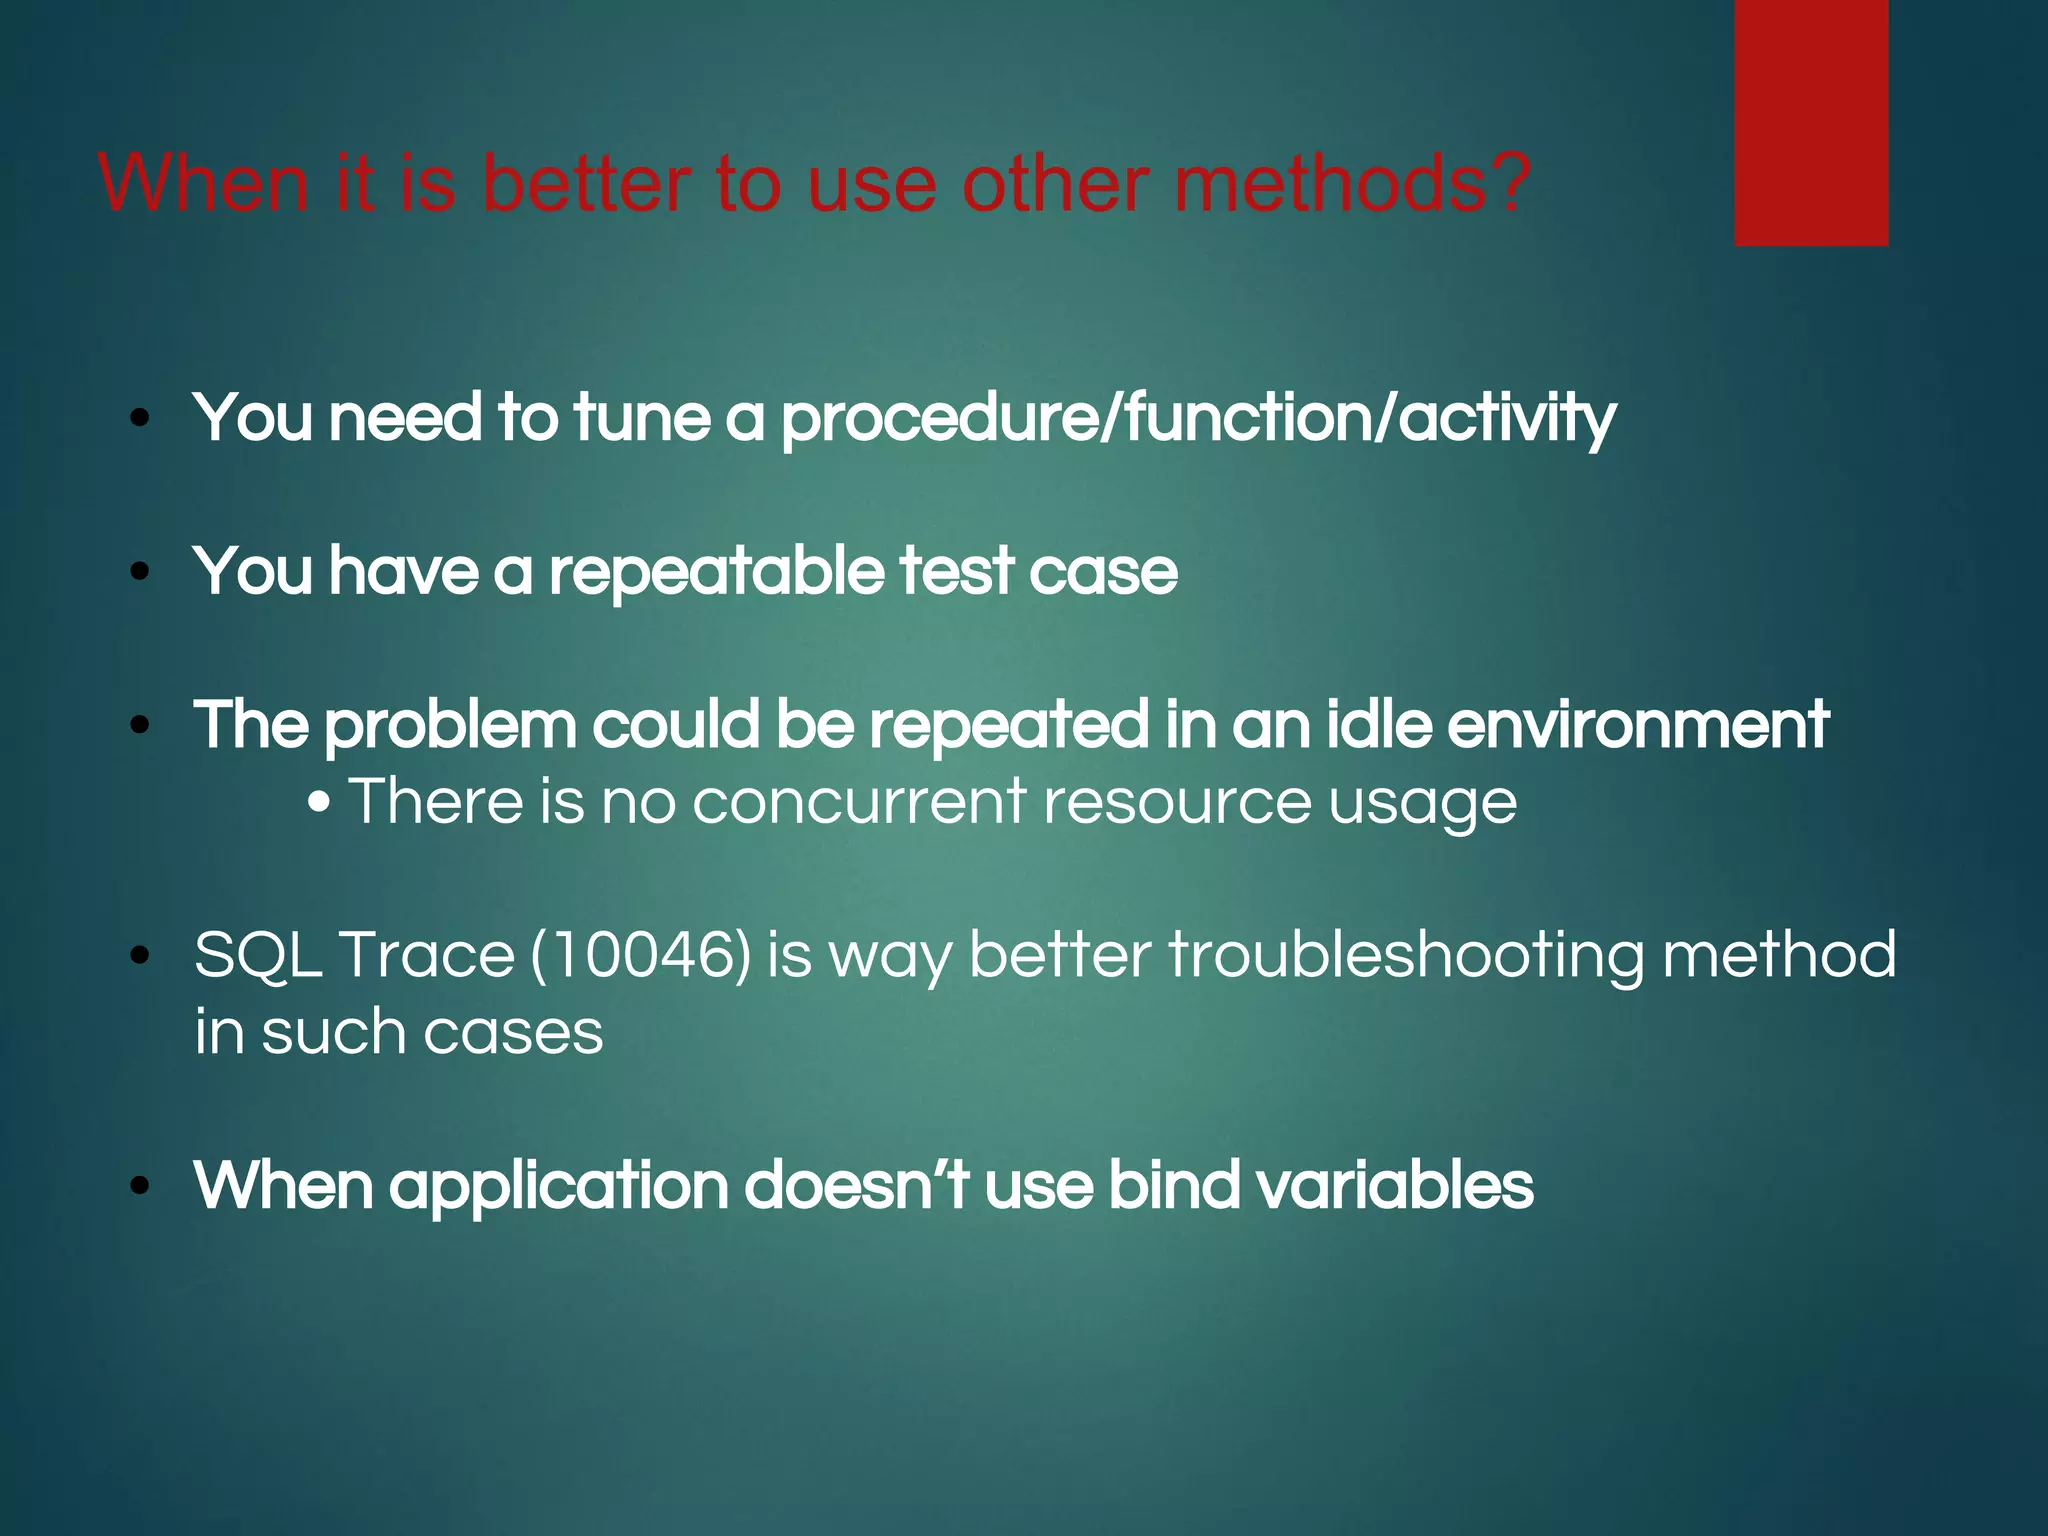
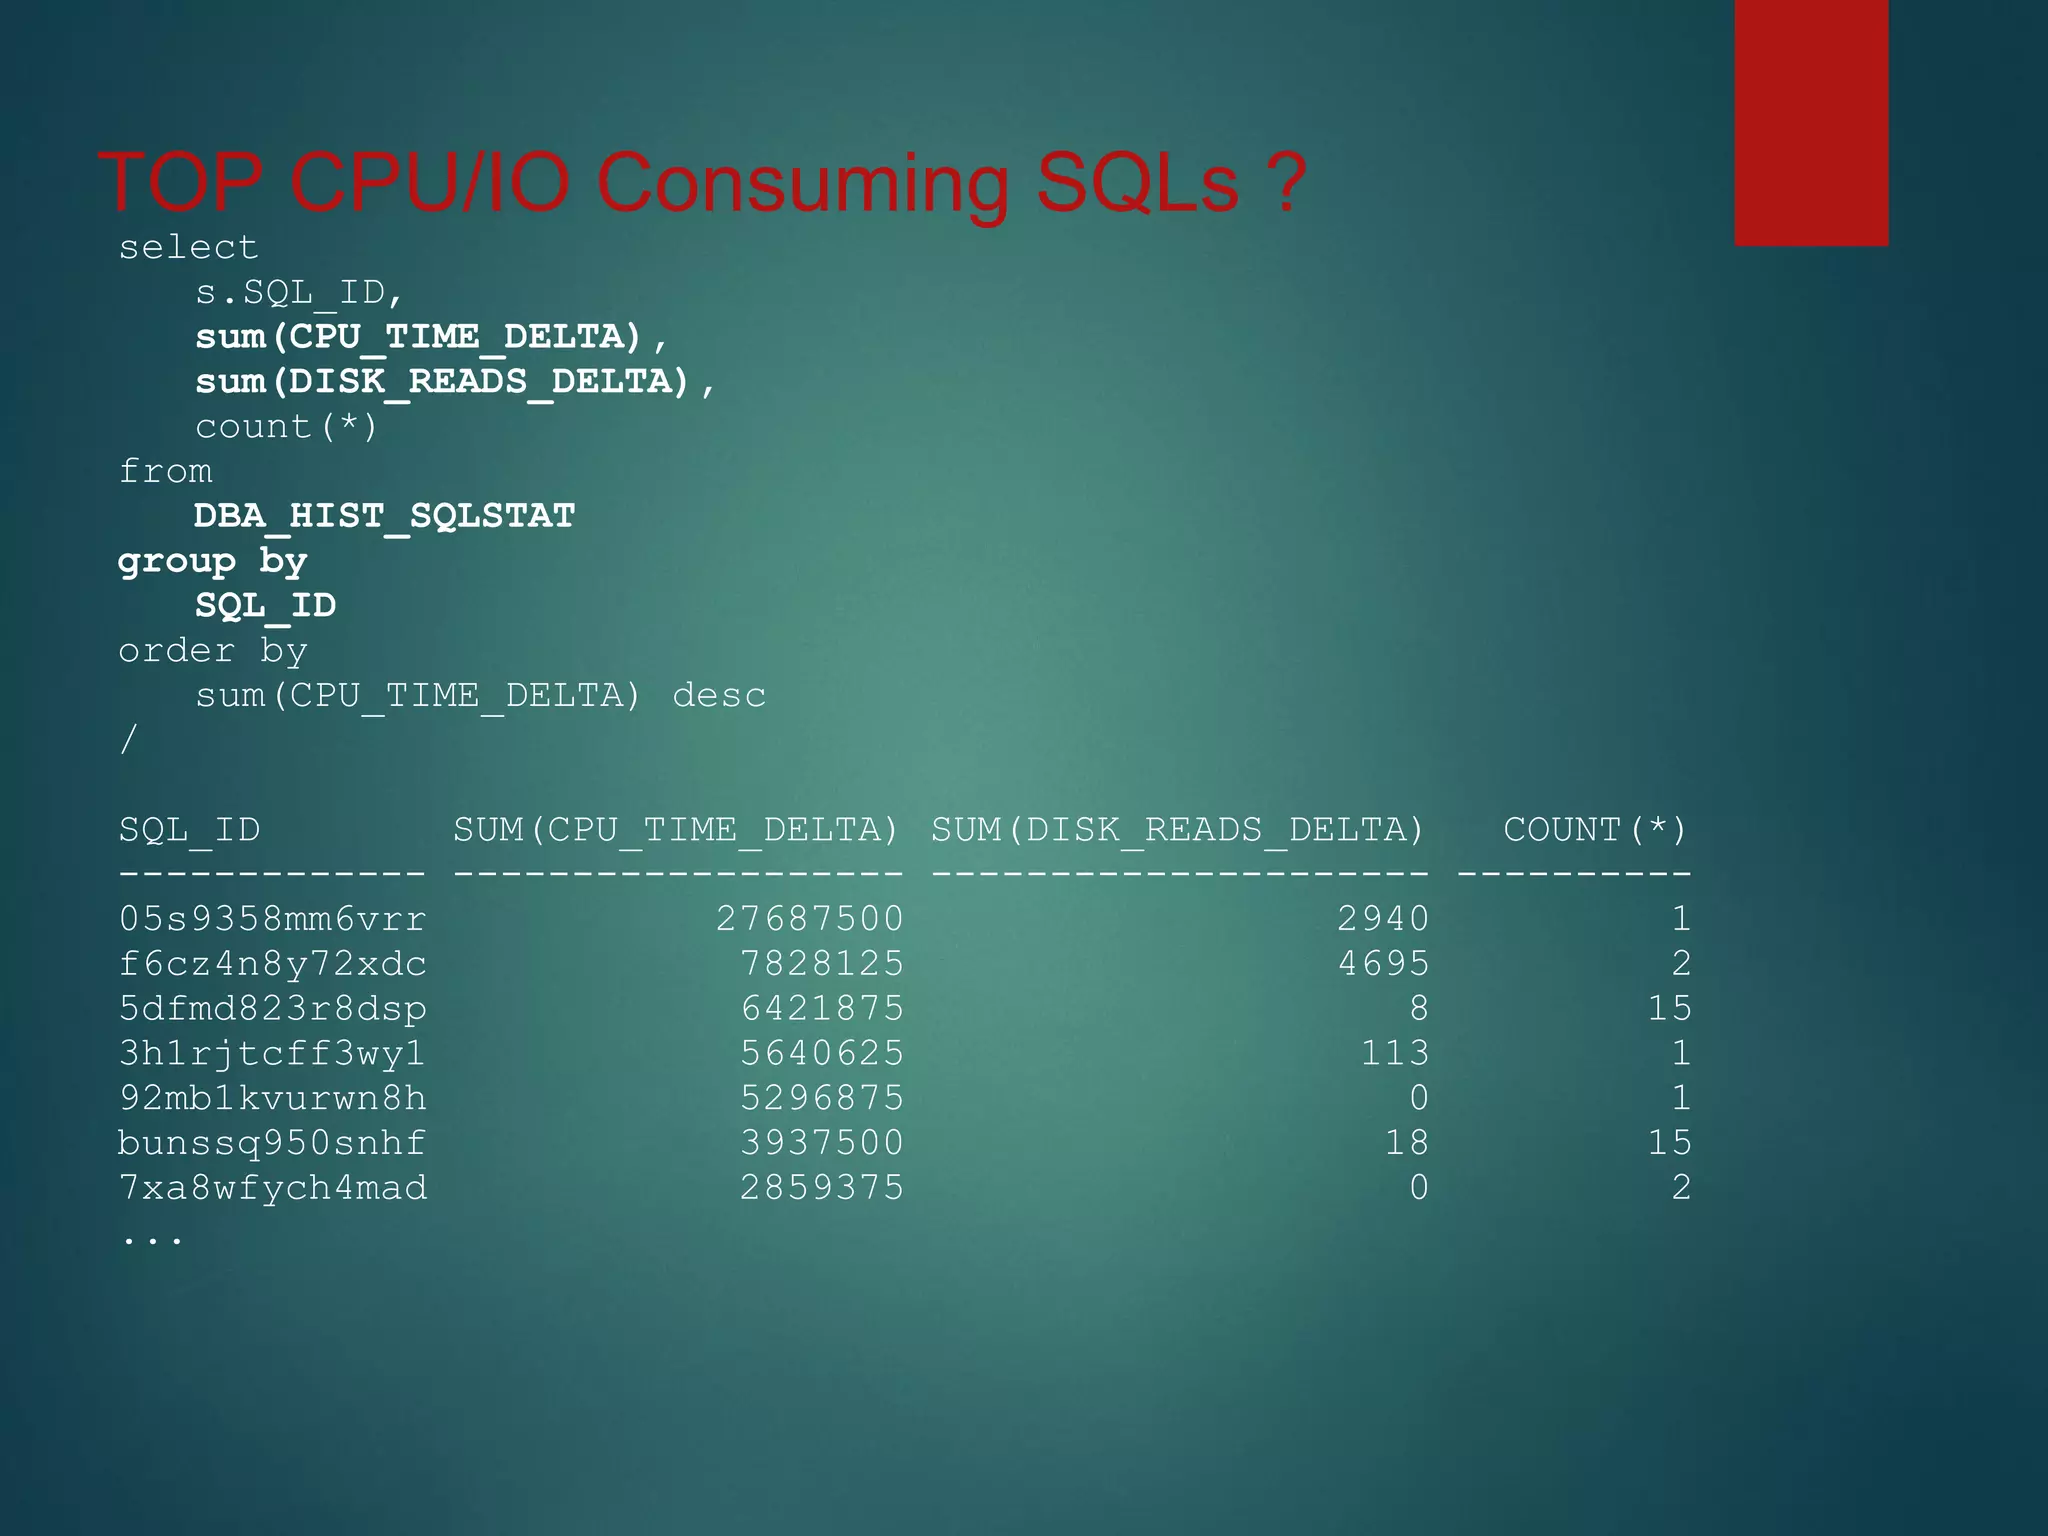
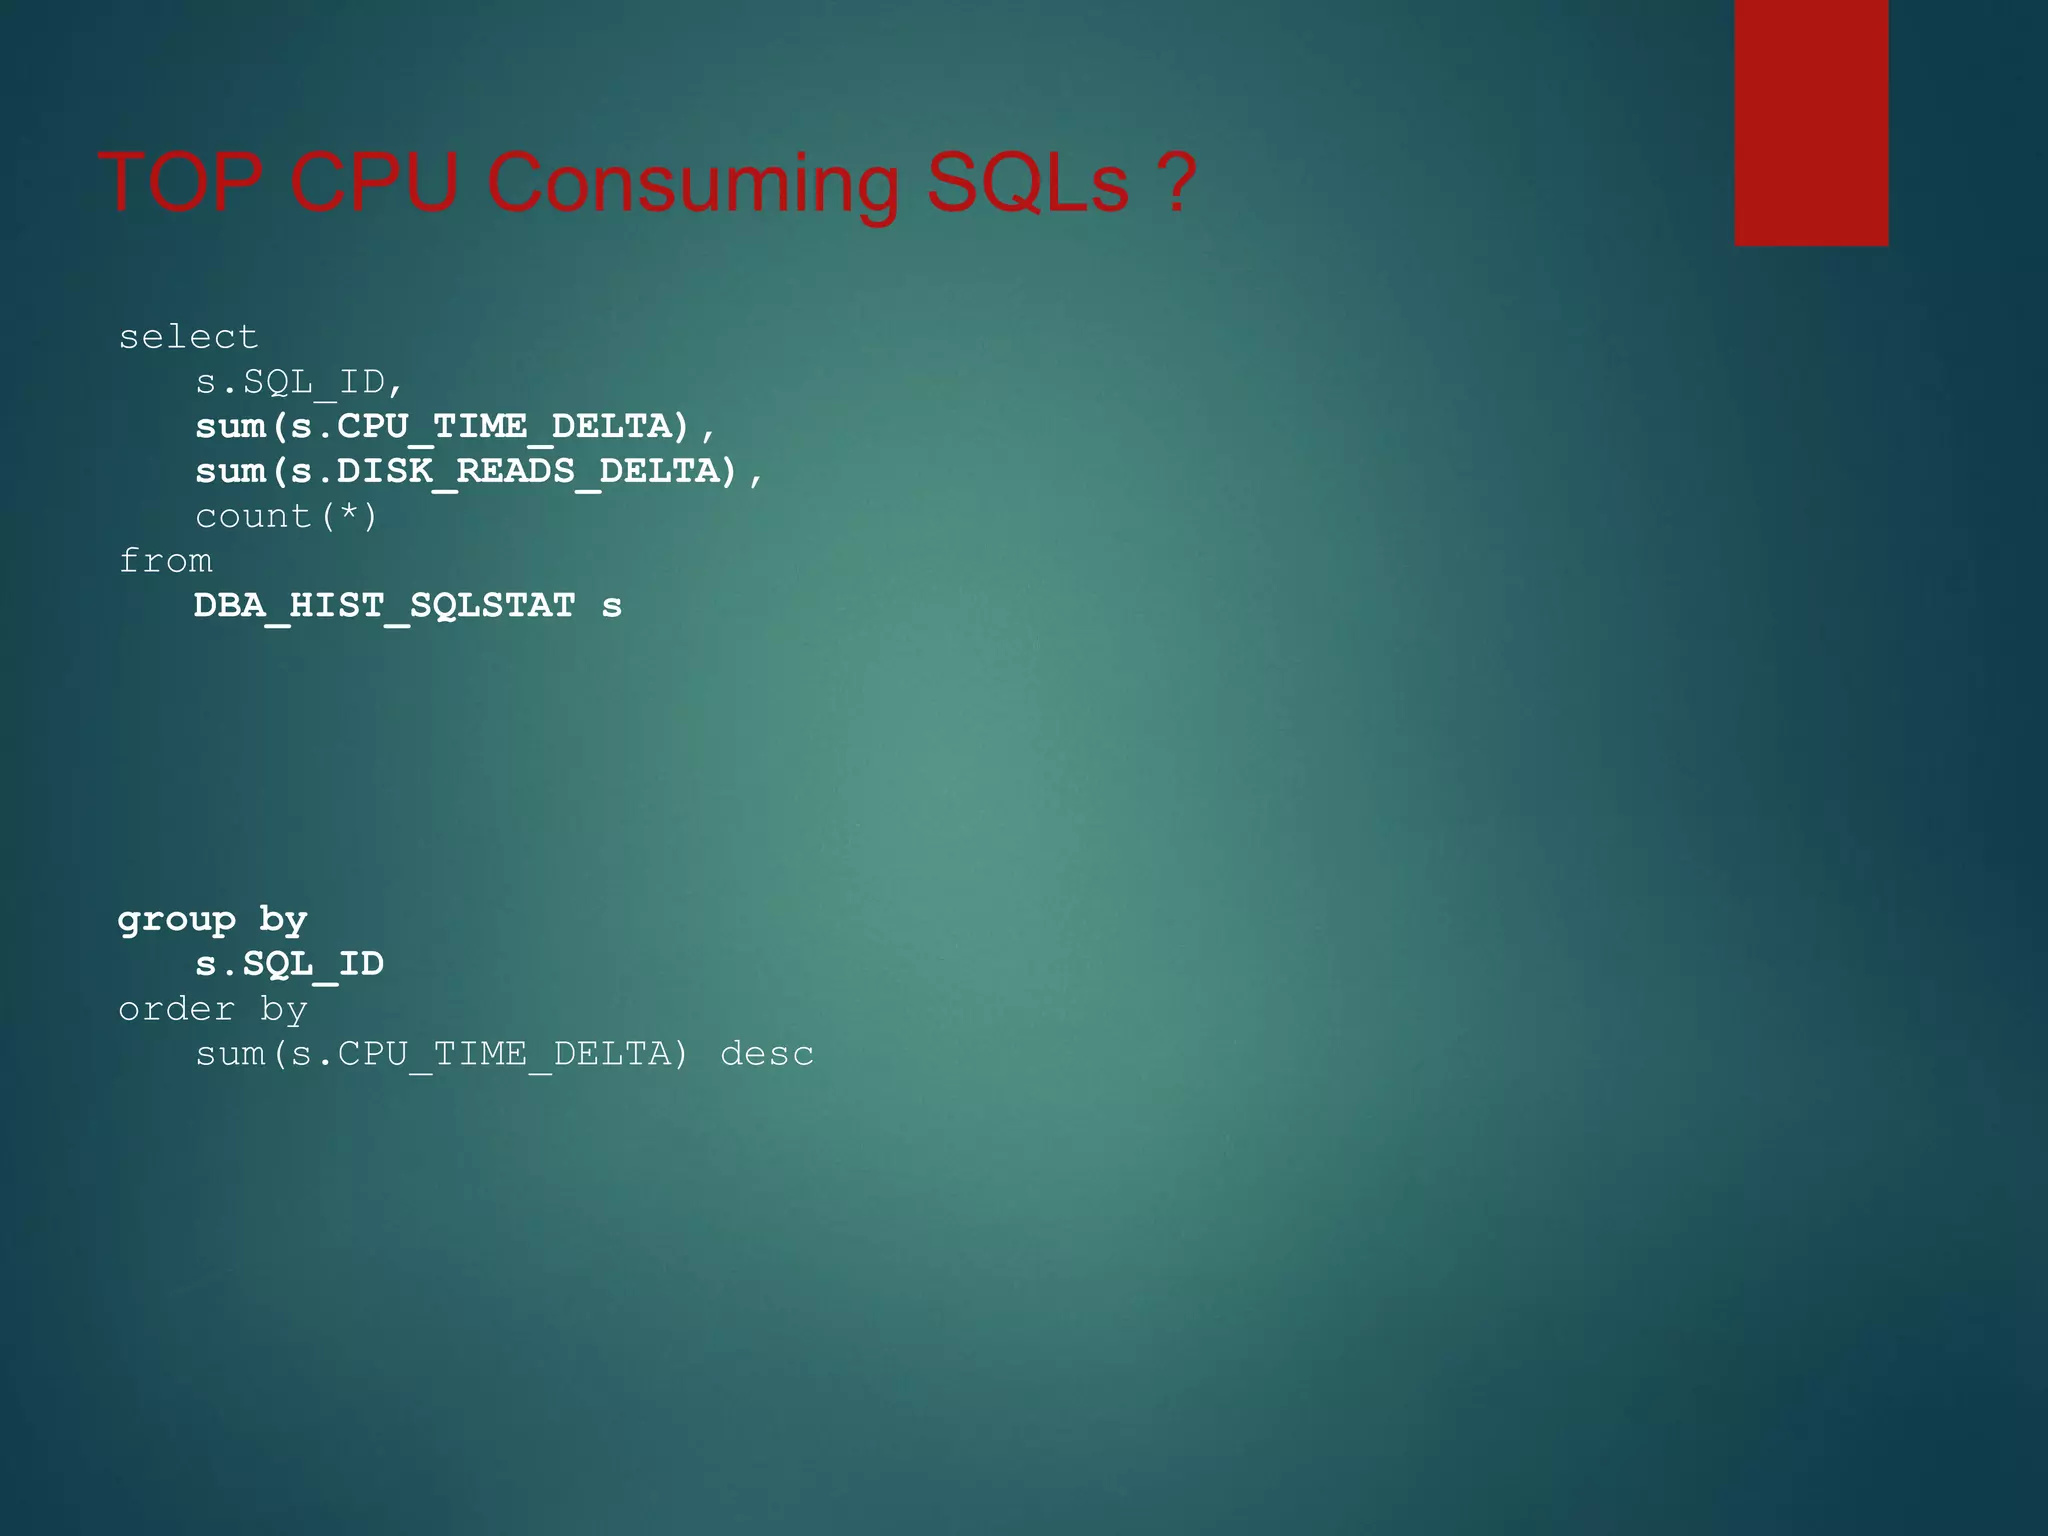
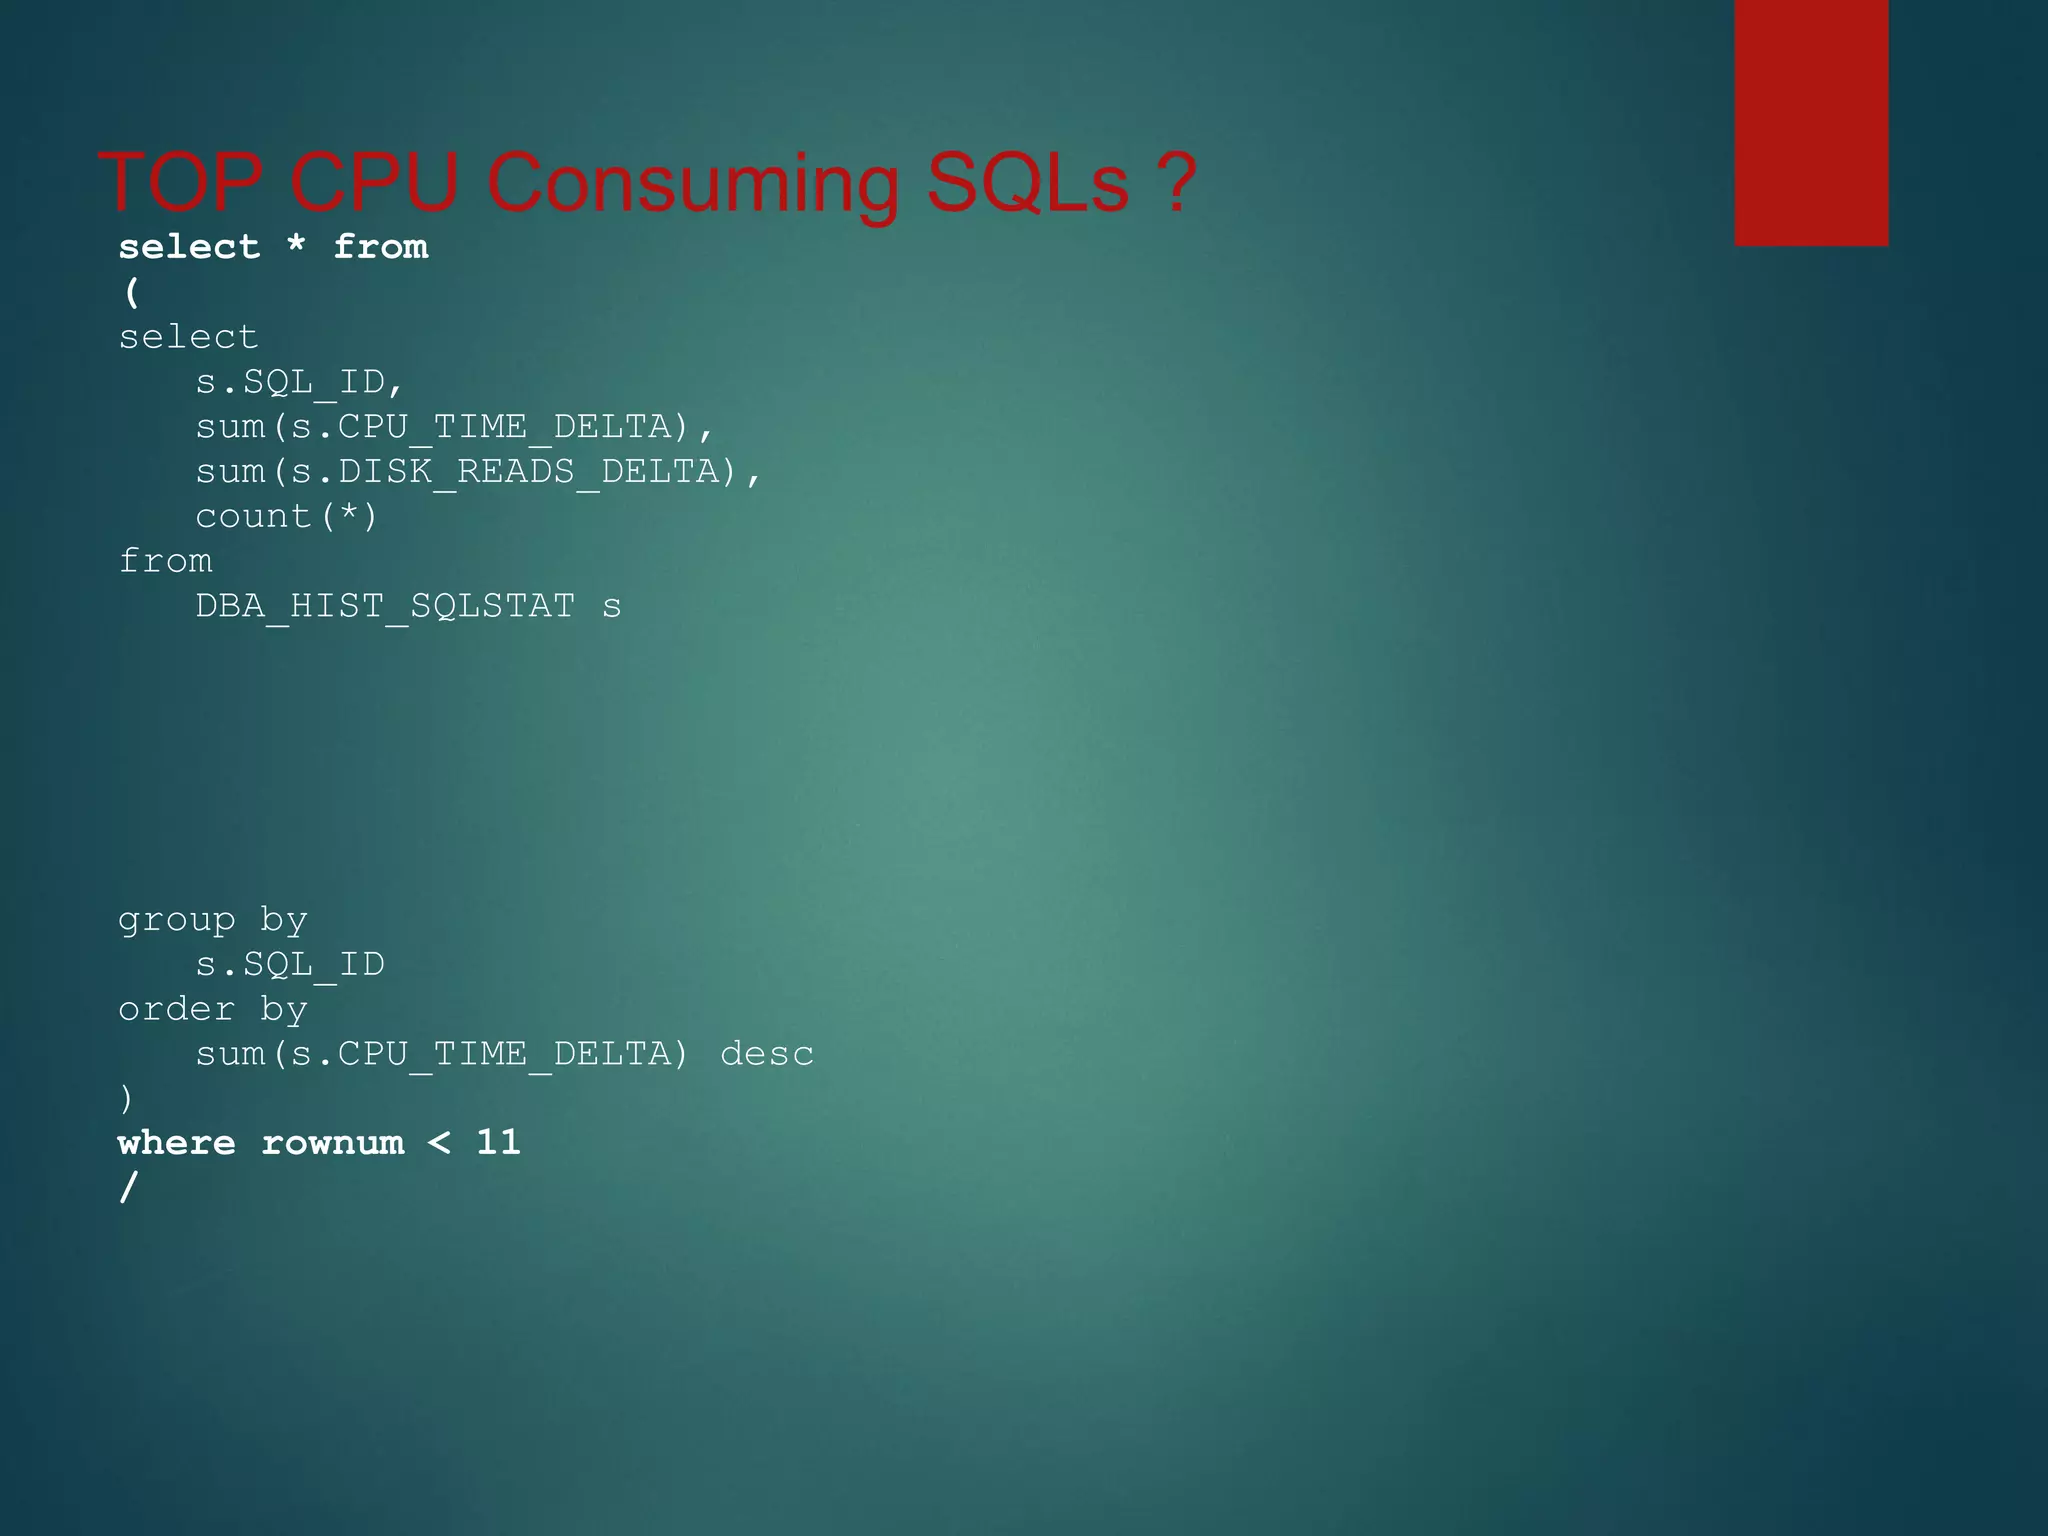
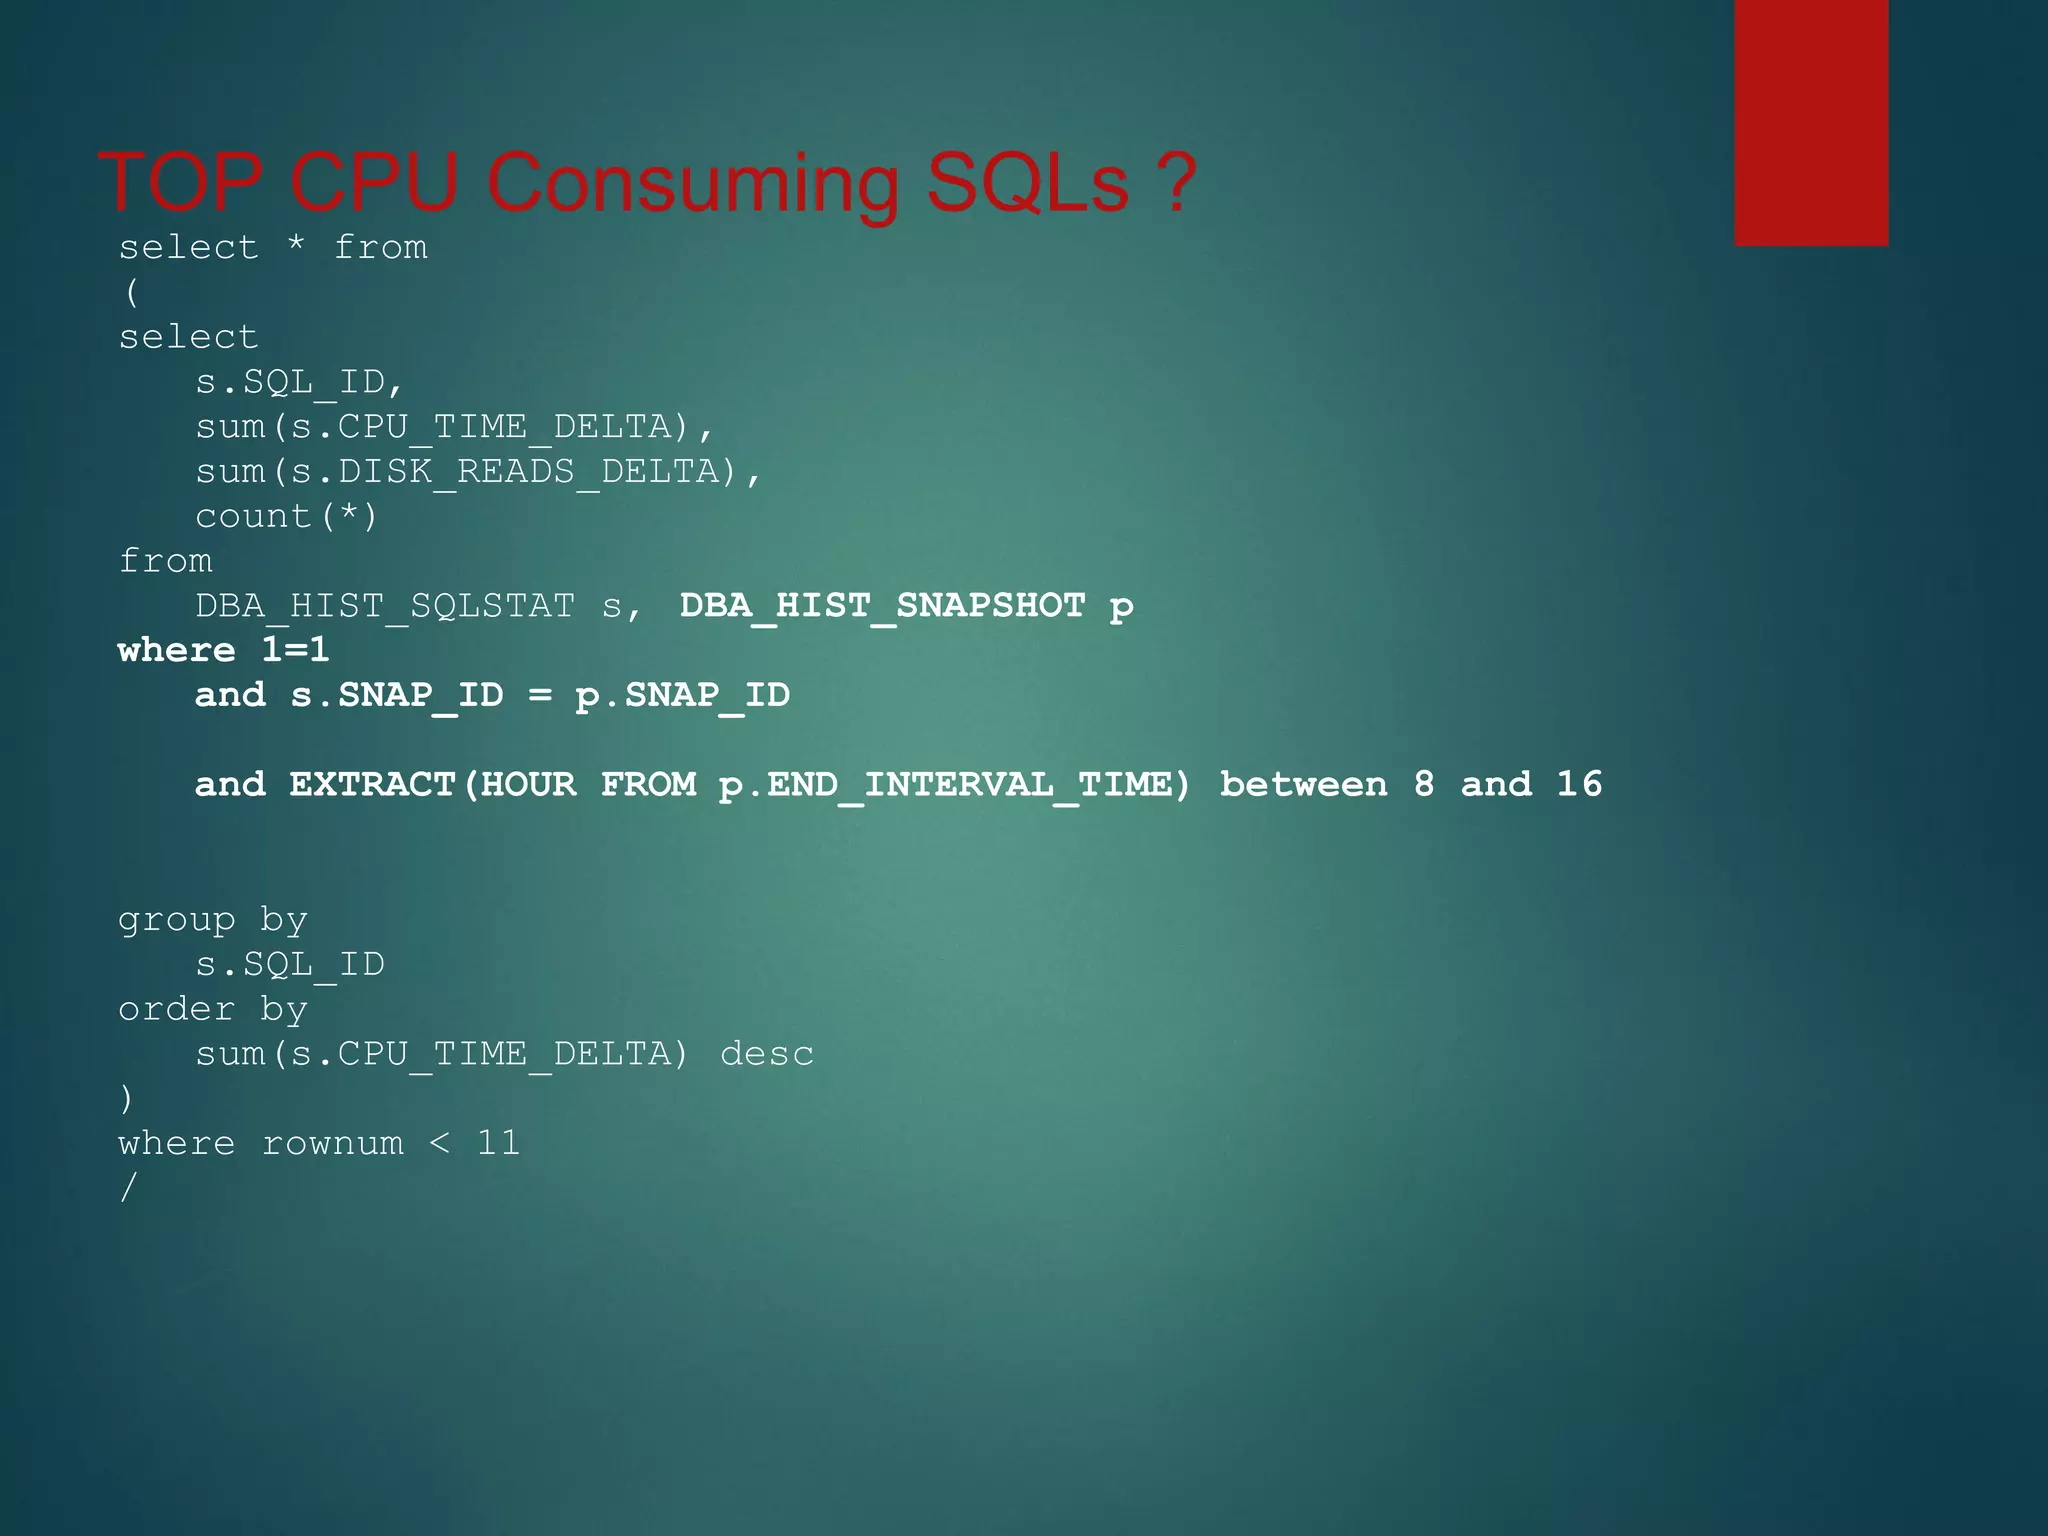
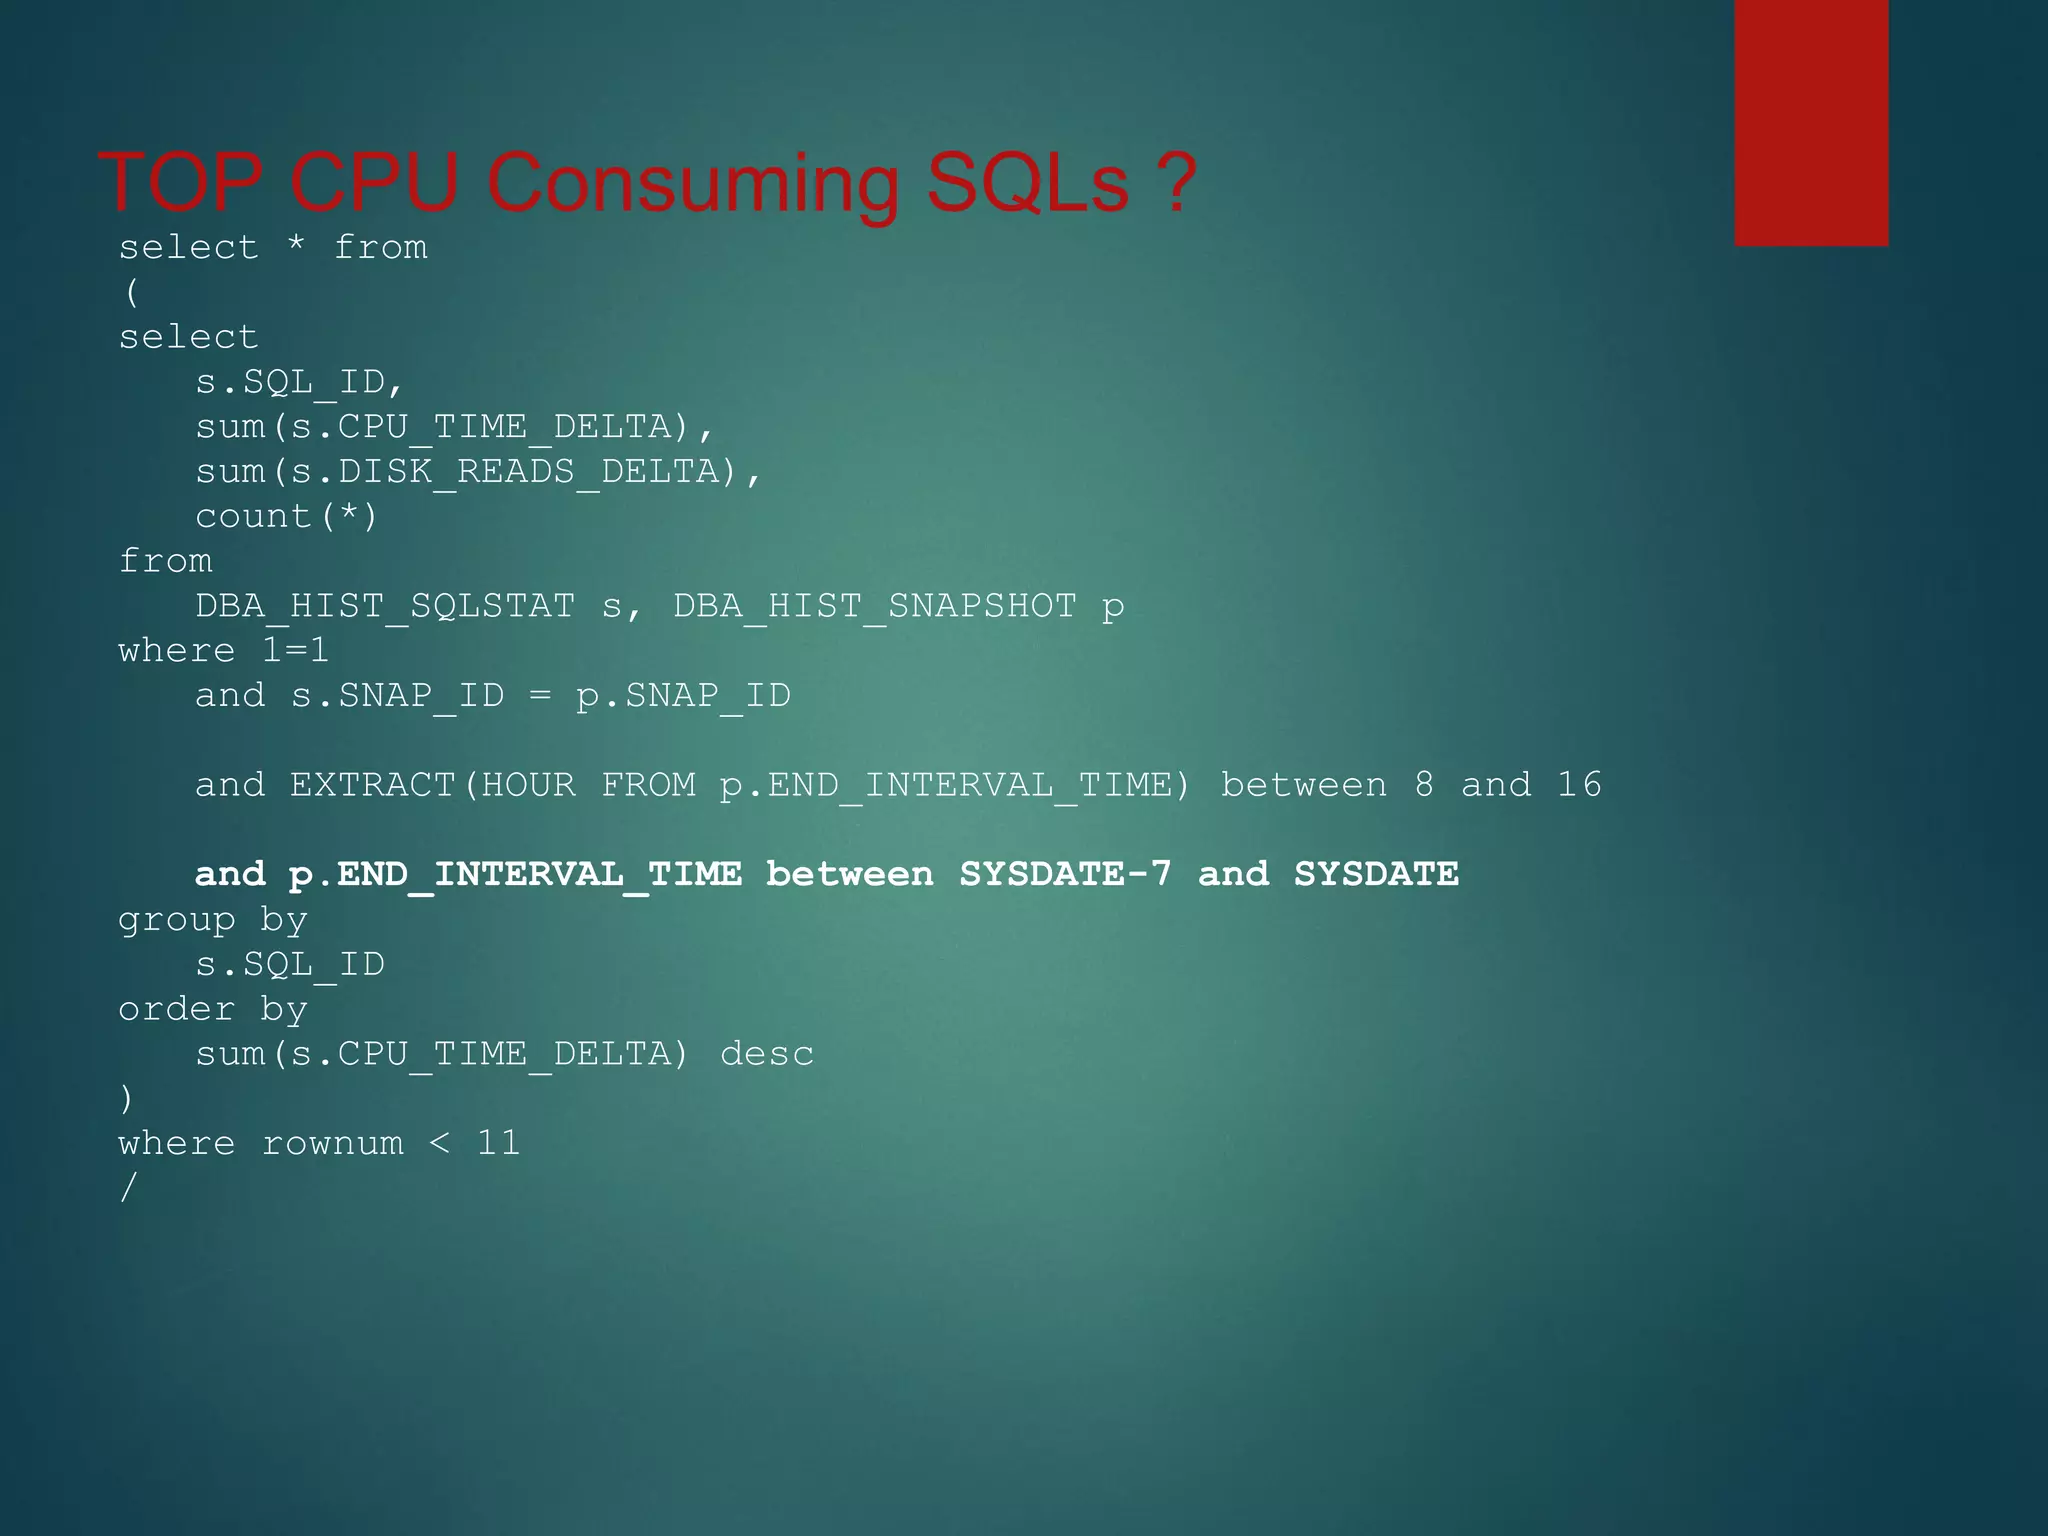


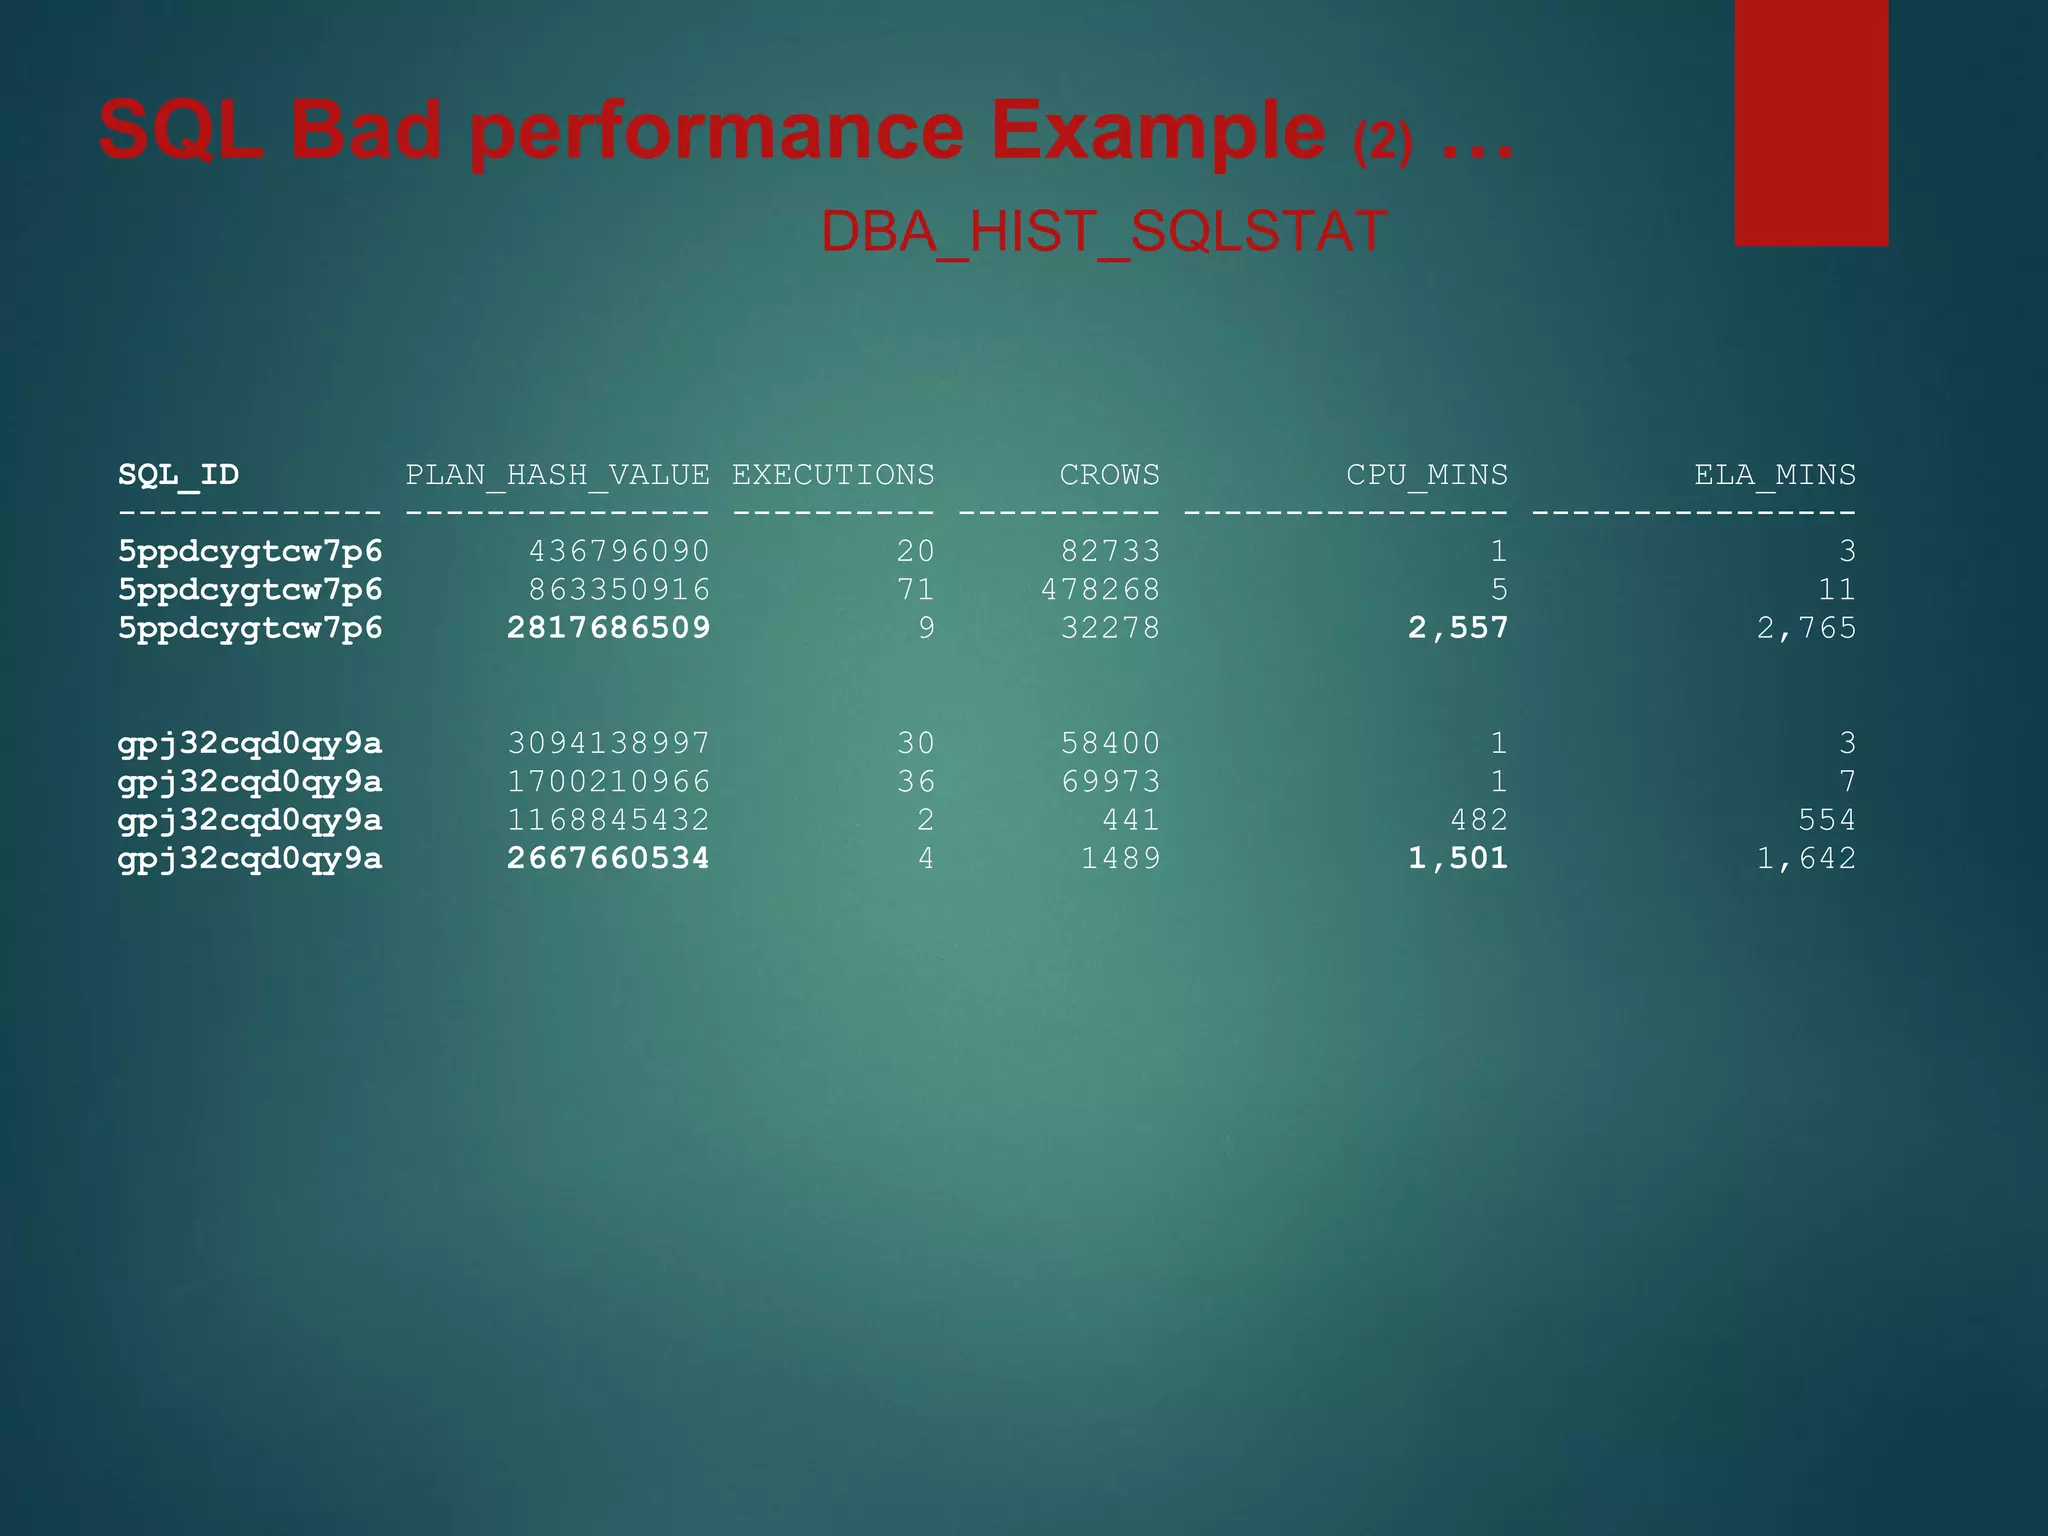
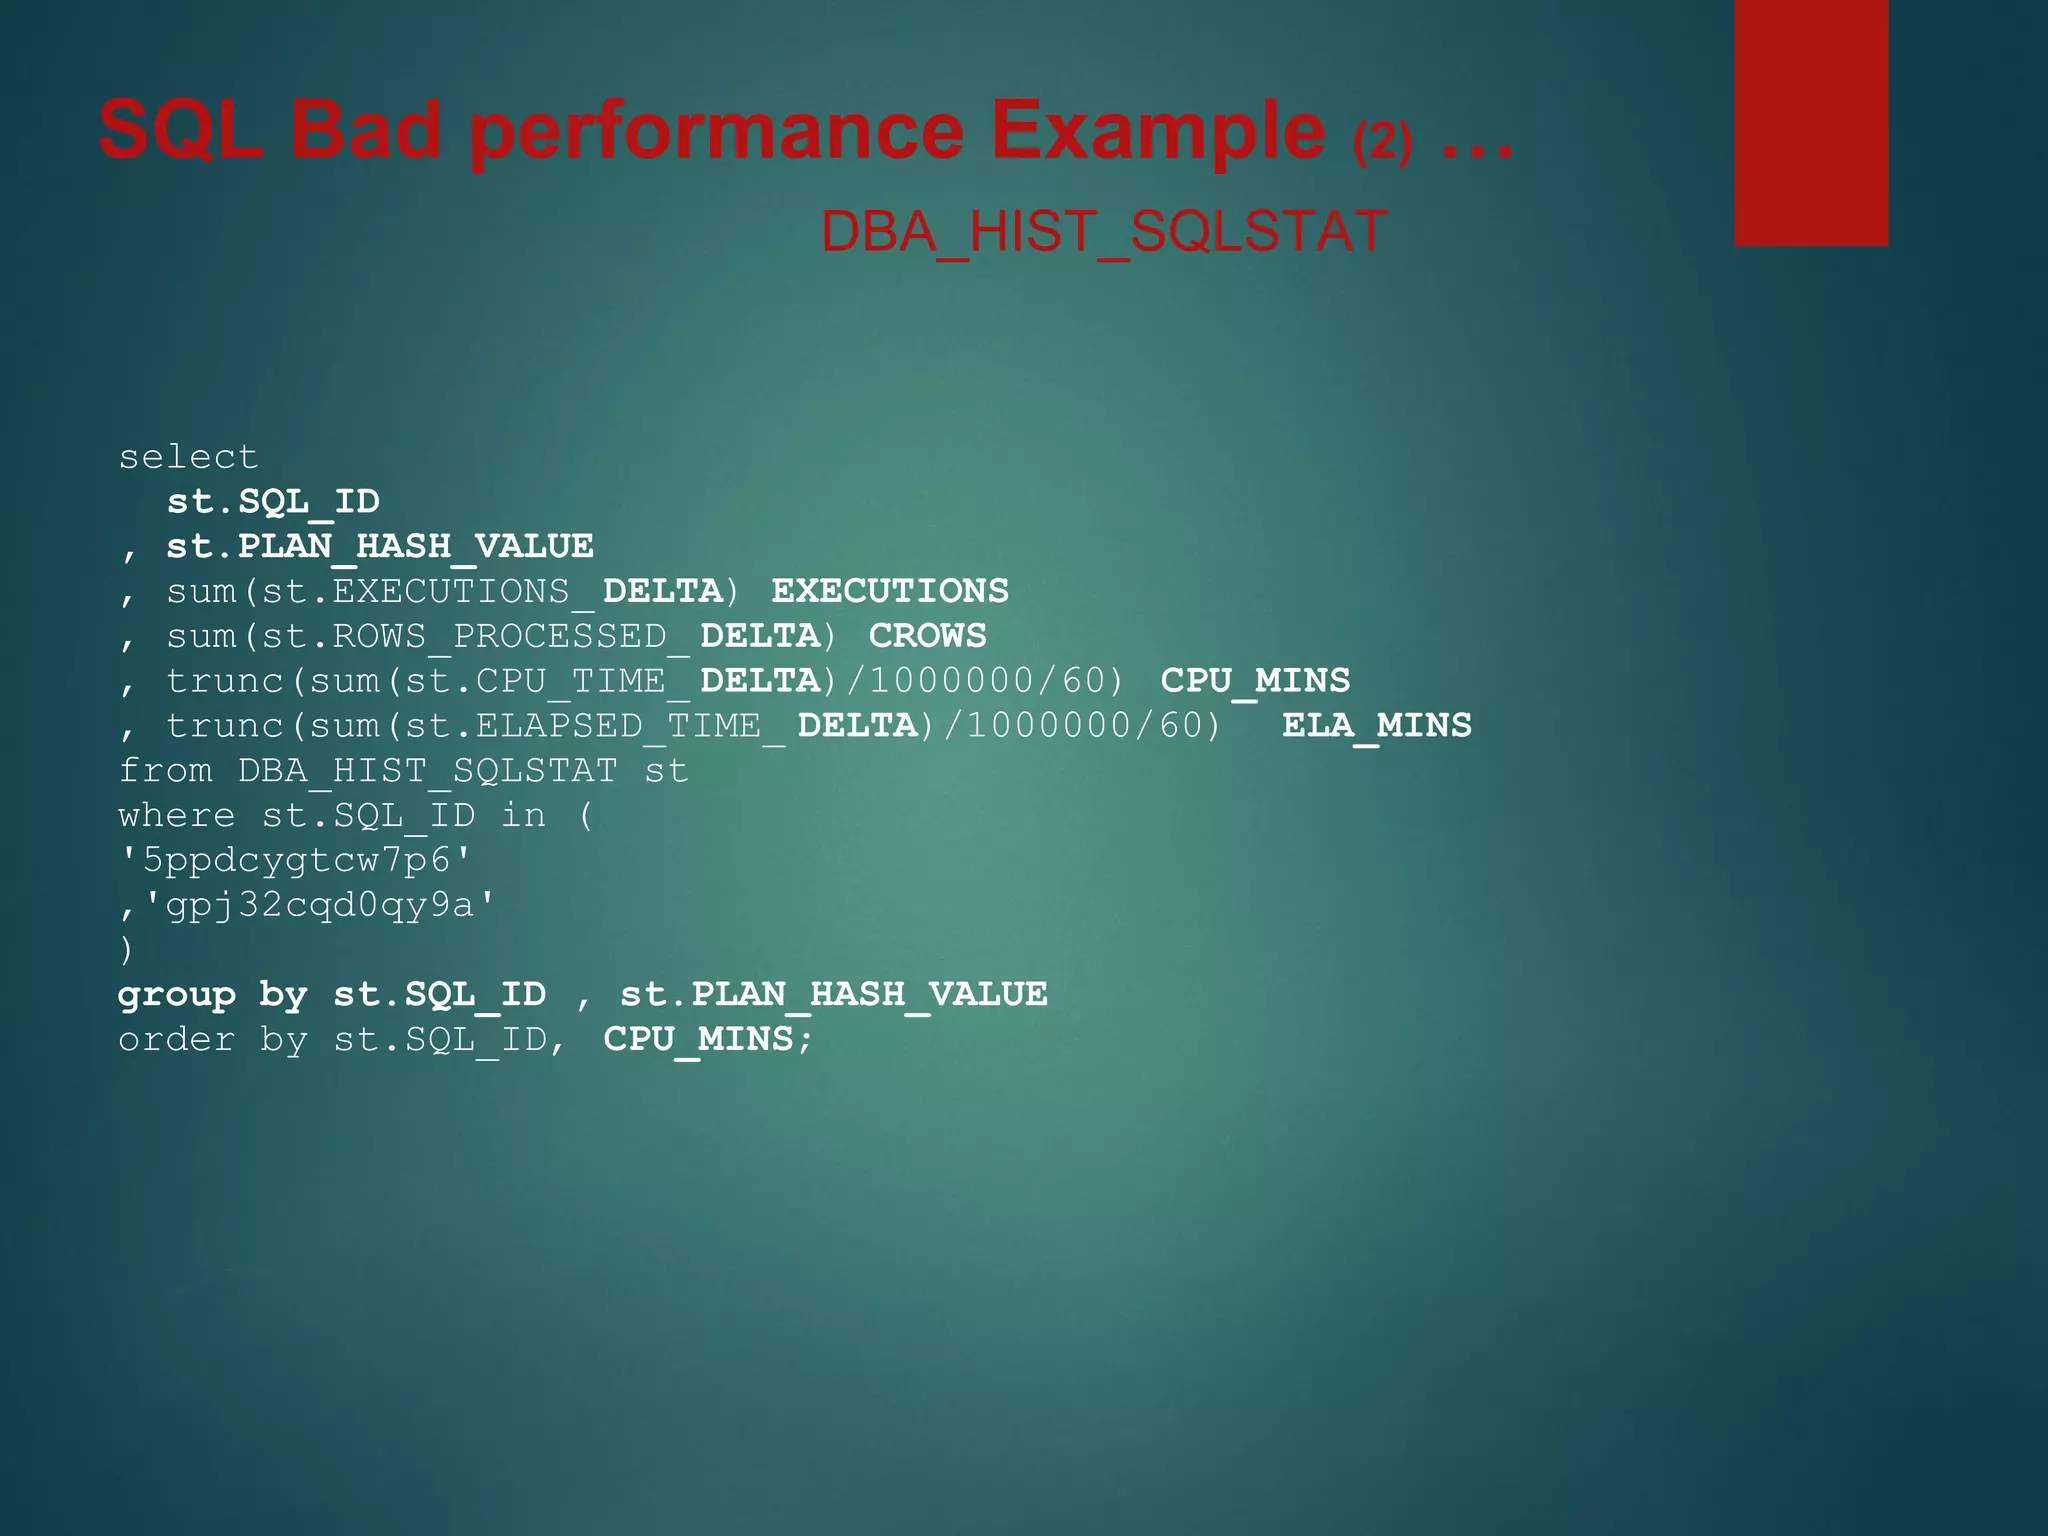


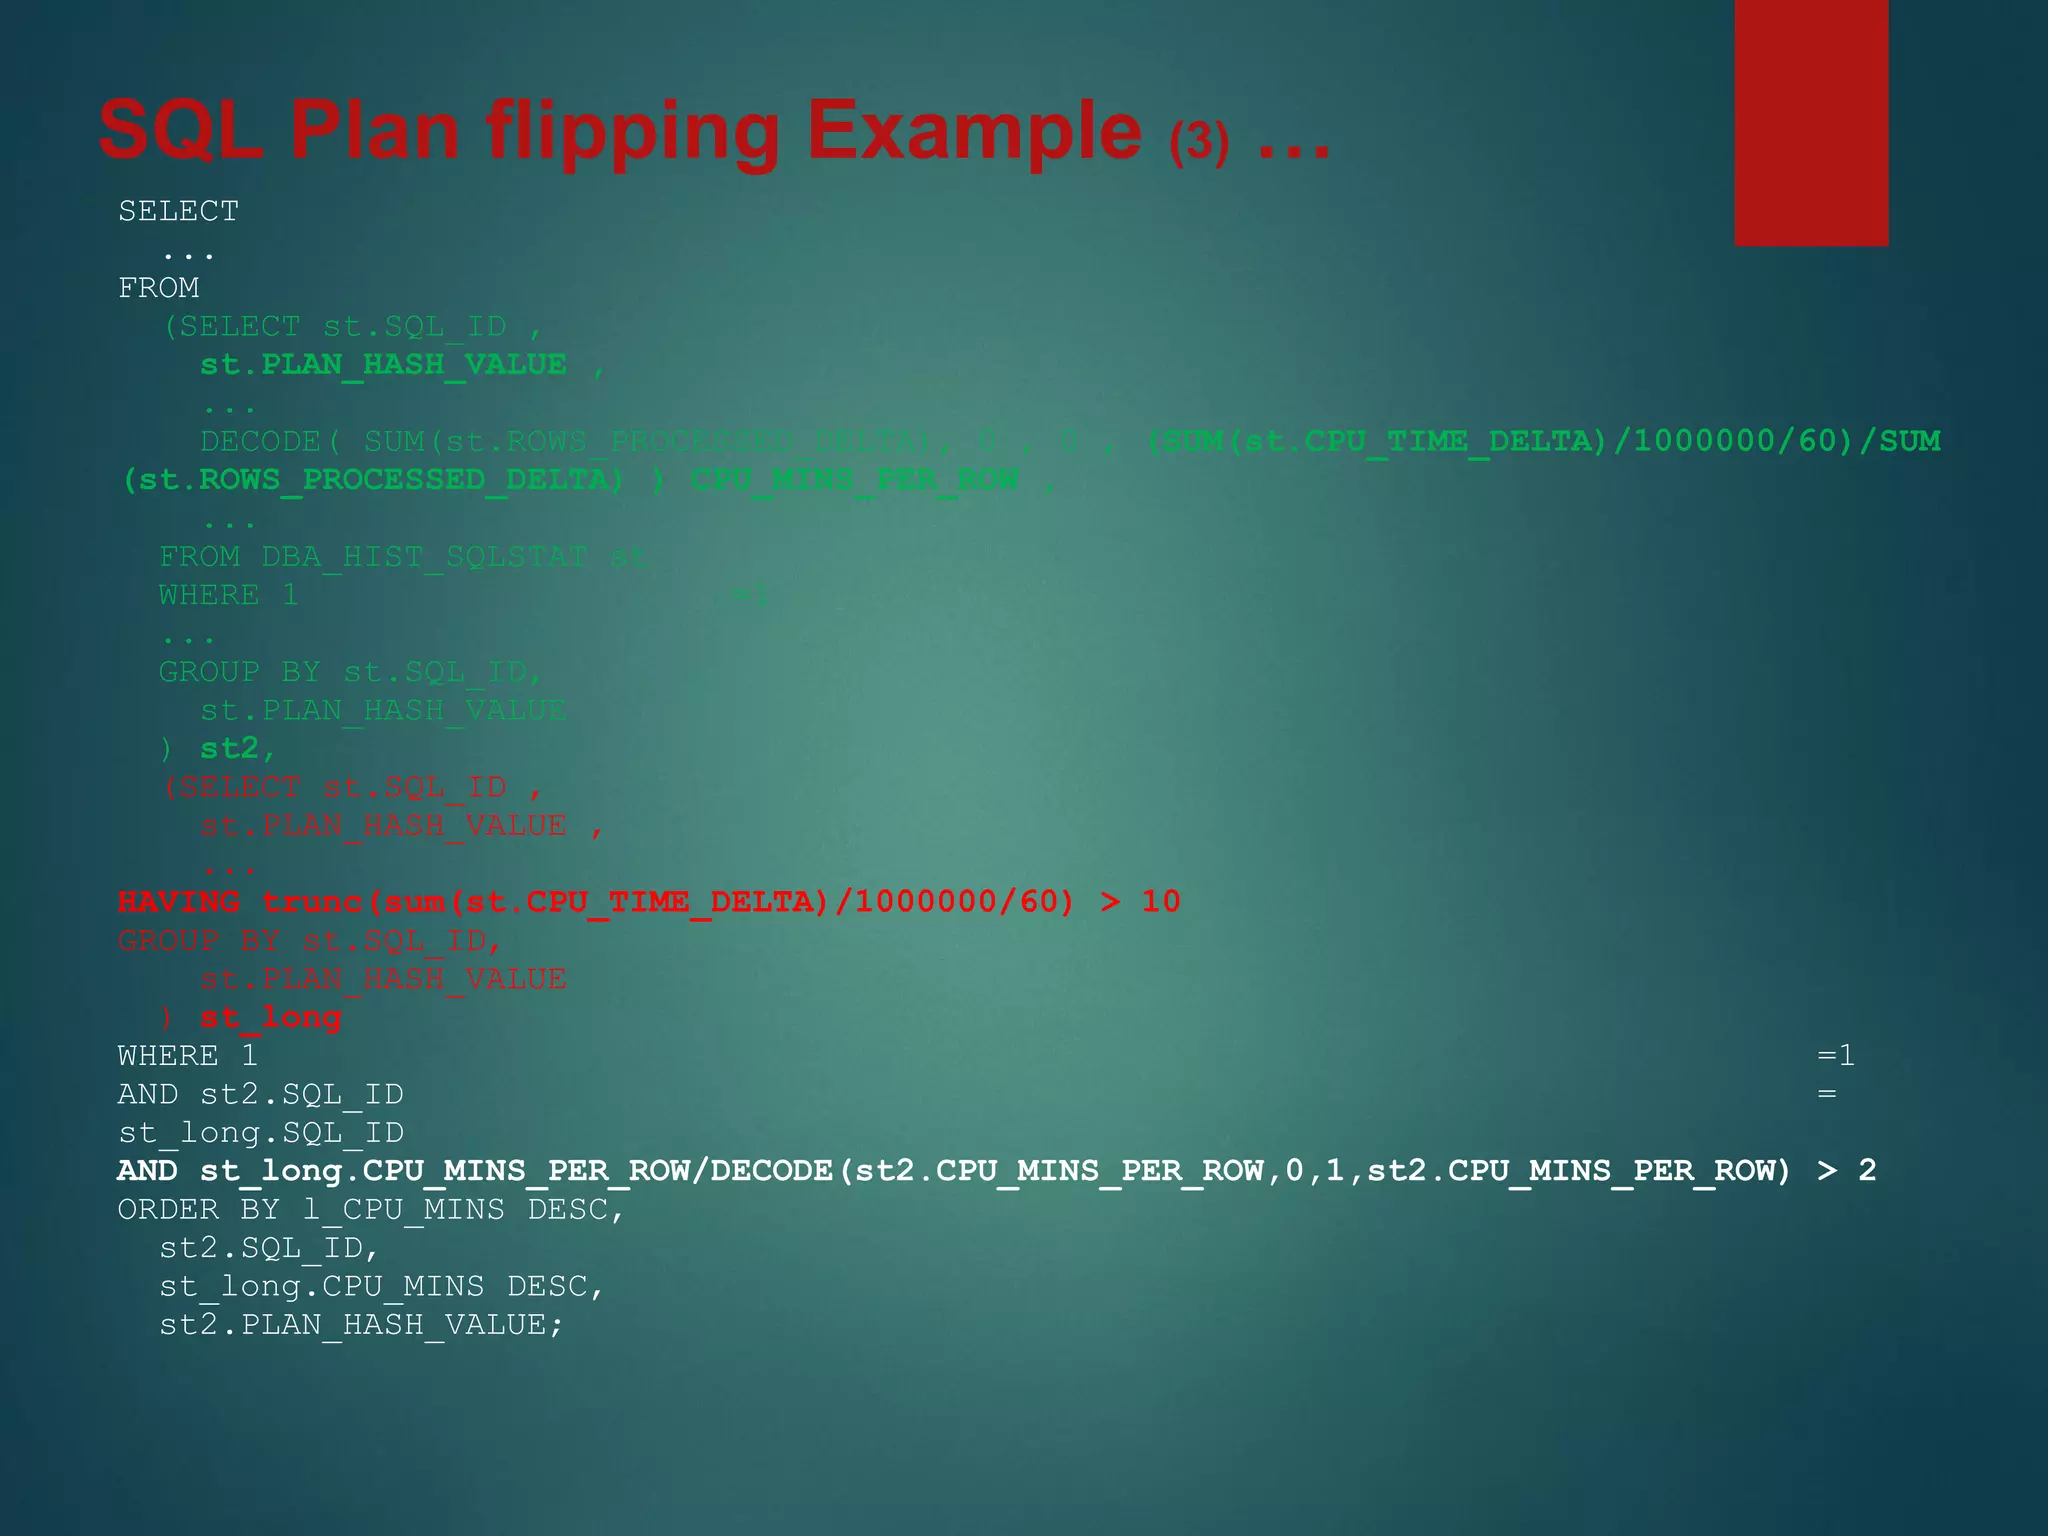
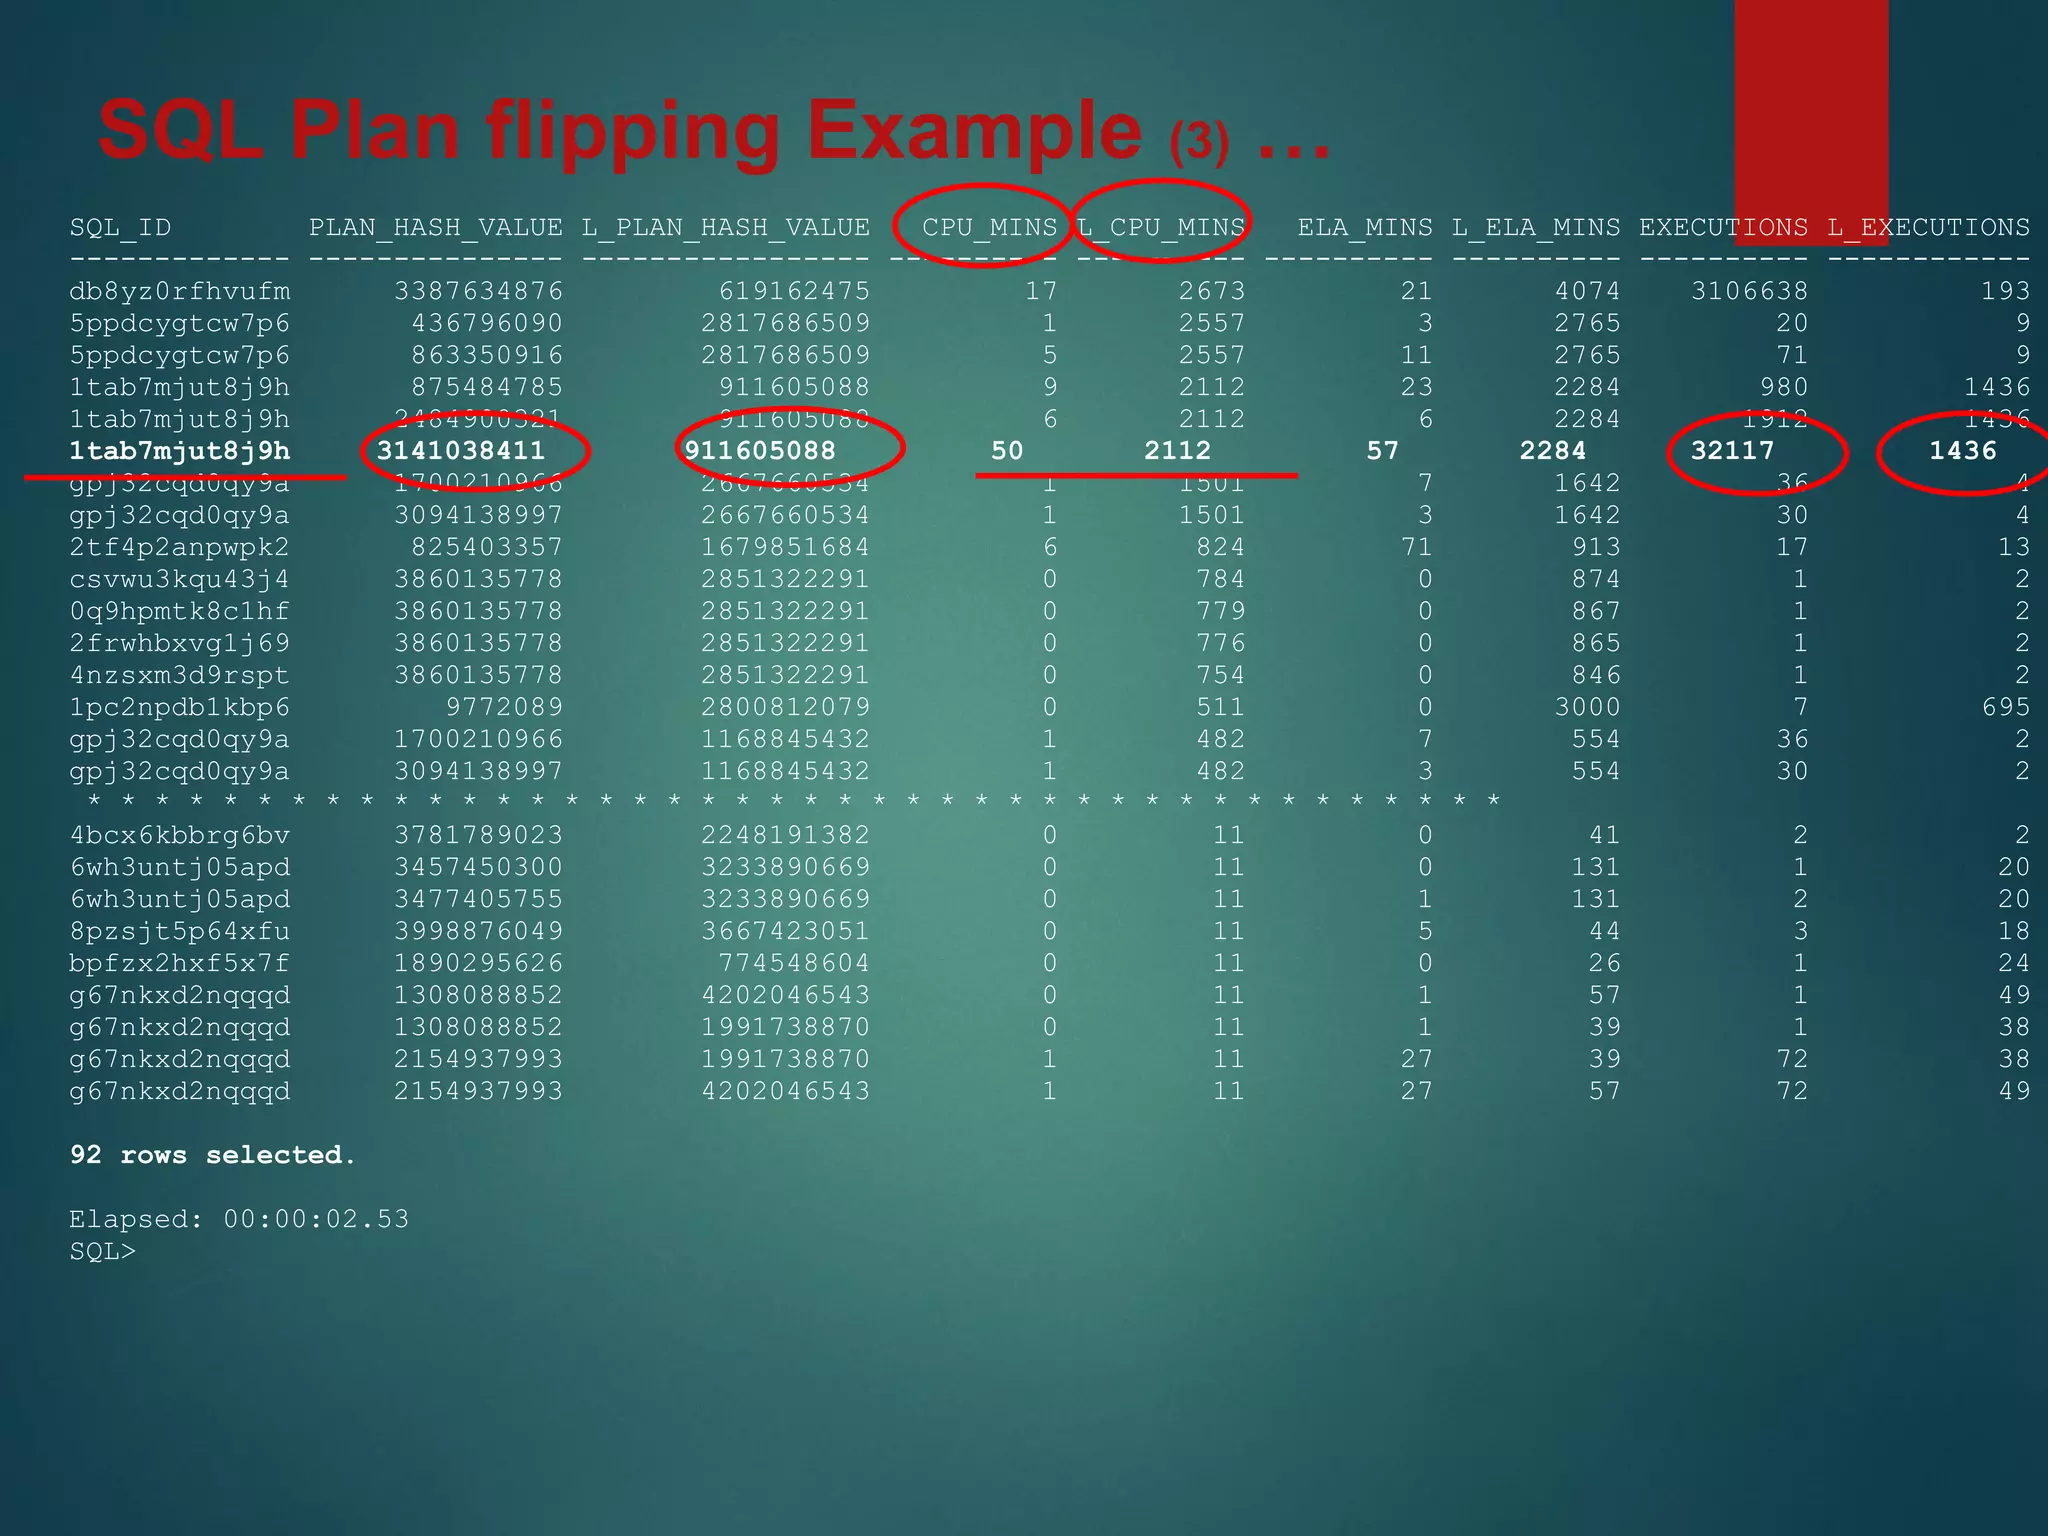


The document discusses the use of Automatic Workload Repository (AWR) data in troubleshooting Oracle database performance issues, highlighting both its advantages and limitations. It provides examples of when AWR is a good choice for performance mining and when alternative methods, like SQL trace, would be more effective. Detailed SQL queries and statistics are presented to illustrate how to identify high resource-consuming SQLs and analyze performance trends.