INTRODUCTION TO DATASCIENCE
A data science is an interdisciplinary field that uses scientific
methods,processes,algorithms,and systems to extract knowledge and insights
from structured and unstructured data.
It combines elements from statistics,computer science,mathematics,and
domain expertise to analyze large sets of data and derive meaningful
conclusions.
A data science project is a practical application of data science skills to solve
real world problems,involving data
collection,cleaning,analysis,visualization,and potentially machine
learning,ultimately leading to actionable insights.
2.
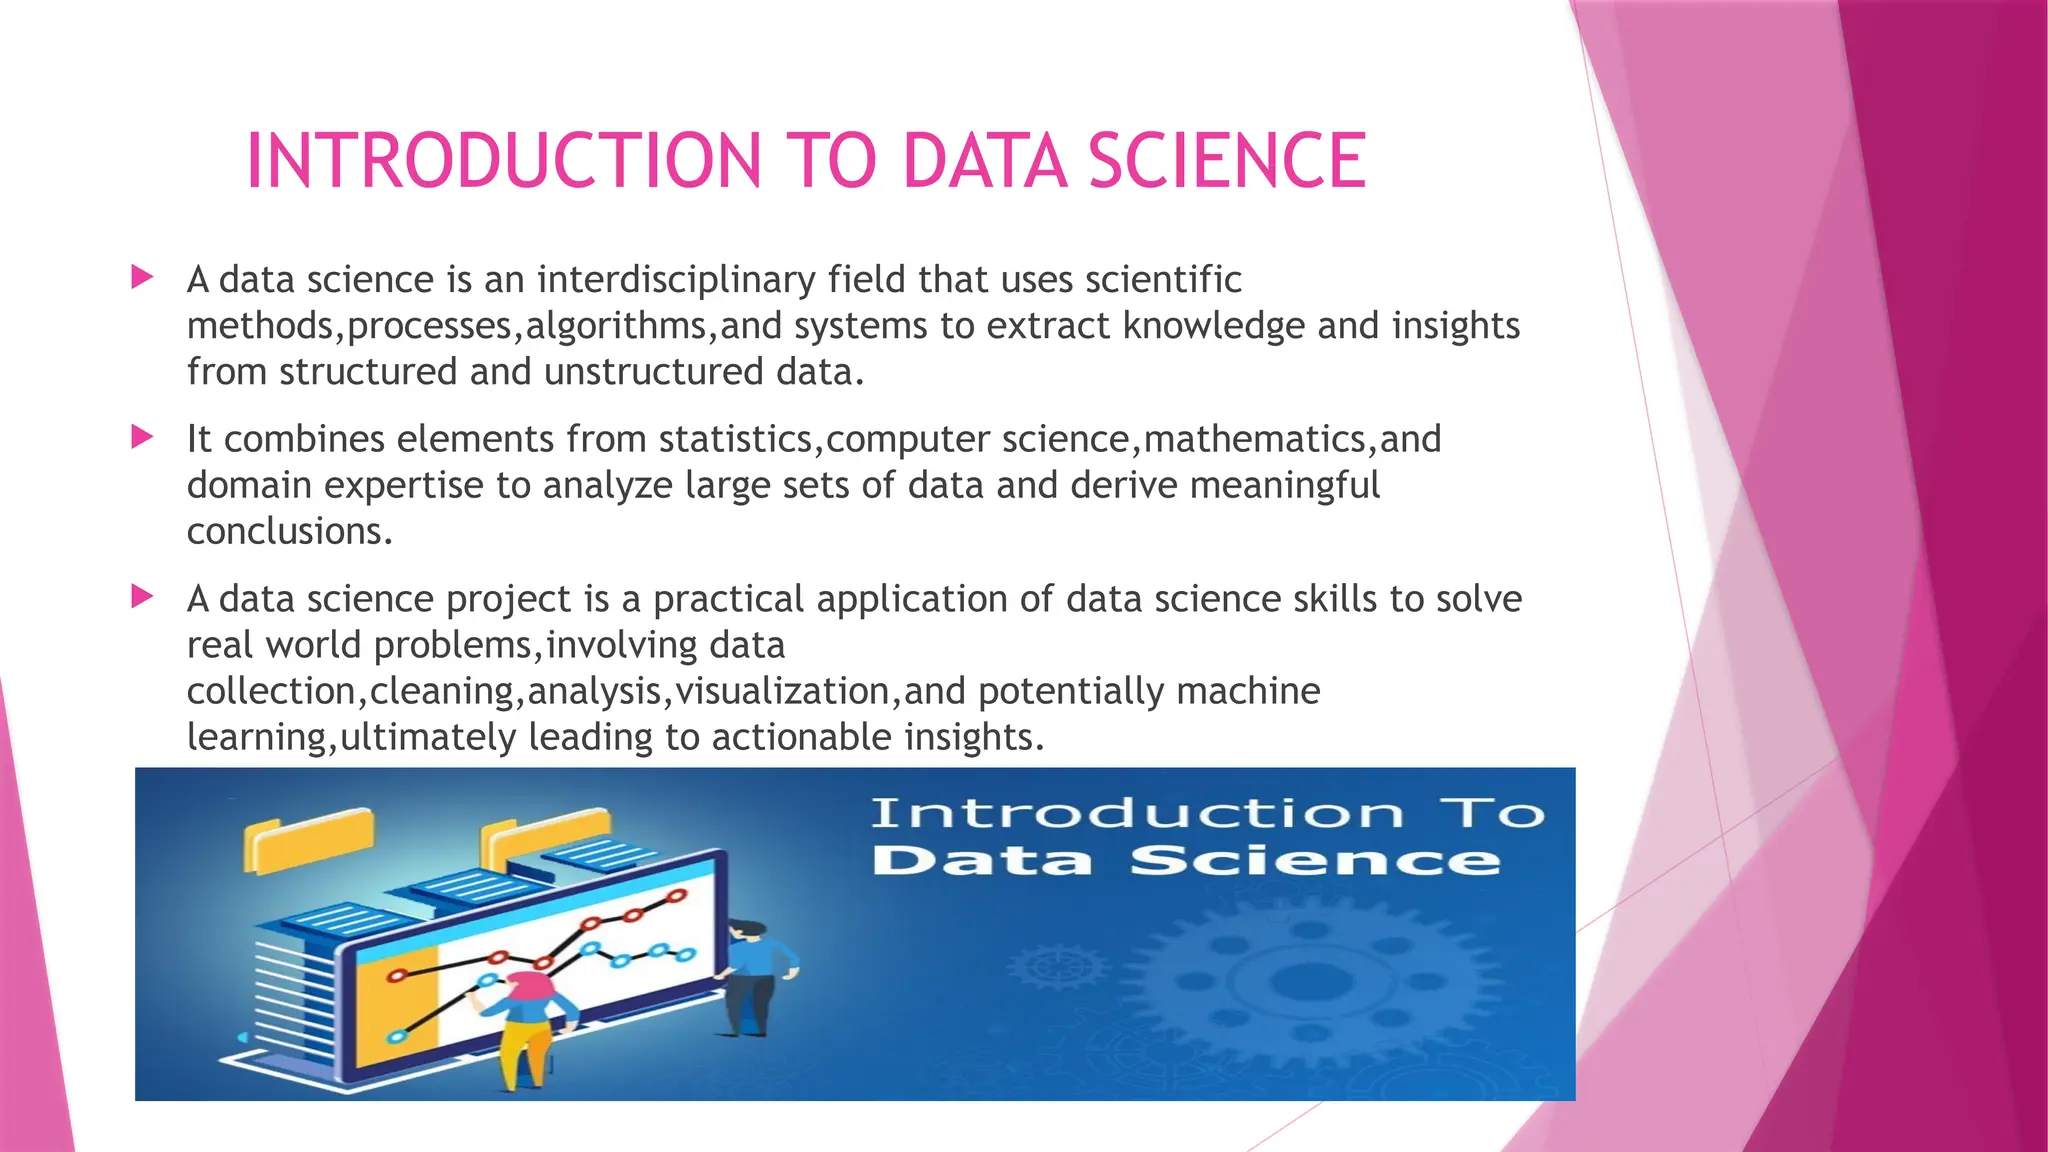
Key Concepts InData Science
Data collection : Gathering data
from various sources,such as
surveys,sensors,websites and socisl
media.
Data cleaning : identifying and
addressing errors,missing values
and inconsistencies int data to
ensure reliability.
Data analysis : Examining data for
patterns,trends,and relationships
using statistical method and
exploratory data analysis(EDA).
Programming : using languages
like python,R,and SQL to
manipulate,analyze,and visualize
data.
Data engineering : managing large
datasets,including
storage,processing,and making data
accessible for analysis.
MLOps : integrating machine learning
models into real-world system for
deployment and maintenance.
Machine learning : using algorithms to
learn from data and make predictions
or decisions without explicit
prograderstand and programming.
Data visualization : presenting data in
a visual
format(e.g.,charts,graphs,maps)to
make it easier to understand and
communicate insights.
3.
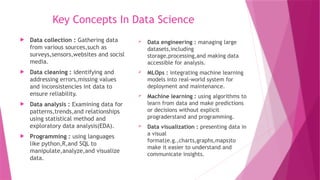
Core components of
datascience
Application
Key tools
Data collection and cleaning: gathering data from
various sources and ensuring quality
Data visualization: presenting data in chart and
graphs to communicate findings clearly
Business and marketing(e.g., customer
insights,targeted ads)
Healthcare(e.g., disease prediction,personalized
care)
Finance(e.g., fraud detection,risk analysis)
Languages: python,R,SQL
Libraries: pandas,numpy,scikit-learn
Visualization: matplotlib,tableaue,power BI
4.
PYTHON FOR DATASCIENCE
What is python?
python is a high-level,general-purpose programming language known for its
readability and versatility. it’s used in various fields like web development,data
science,and software development.
Python for data science?
python is favored in data science due to its readability,simplicity,and
versatile ecosystem of libraries.its easy-to-learn syntax and extensive libraries
for data analysis,visualization,and machine learning allow data scientists to focus
on problem-sloving rather than complex coding.
5.
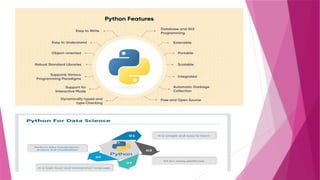
PYTHON KEY CHARACTERISTICS
High-level : python uses a syntax that is closer to human language,making it
easier to understand and write.
General-purpose : it’s not limited to specific area of application and can be
used for a wide varity of tasks.
Interpreted : python code is executed line by line by an interpreter,which
translates it into machine code as needed.
Object-oriented : python supports object-oriented programming,allowing
developers to structure code around object and their interactions.
Dynamic typing : python does not require explicit type declarations for
variables,as their type are determined at runtime.
Large standard library : python comes with a rich set of built-in modules and
functions,providing many pre-written tools for common tasks.
7.
EXPLORE MACHINE LEARNINGUSING PYTHON
Exploring machine learning with python involves understanding the basic of
python programming,learning essential libraries like numpy,pandas,and scikit-
learn,and then applying these tools to various machine learning tasks.
To explore machine learning using python,start by installing python and necessary
libraeies like scikitlearn,pandas,and numpy.
Data exploration and preprocessing:
Load data
Data cleaning
Exploratory data analysis(EDA)
8.
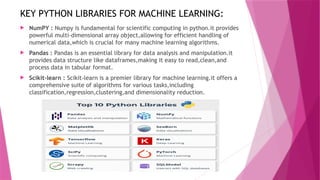
KEY PYTHON LIBRARIESFOR MACHINE LEARNING:
NumPY : Numpy is fundamental for scientific computing in python.it provides
powerful multi-dimensional array object,allowing for efficient handling of
numerical data,which is crucial for many machine learning algorithms.
Pandas : Pandas is an essential library for data analysis and manipulation.it
provides data structure like dataframes,making it easy to read,clean,and
process data in tabular format.
Scikit-learn : Scikit-learn is a premier library for machine learning.it offers a
comprehensive suite of algorithms for various tasks,including
classification,regression,clustering,and dimensionality reduction.
10.
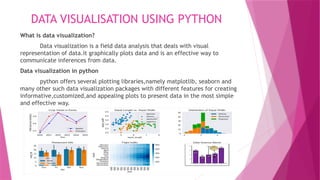
DATA VISUALISATION USINGPYTHON
What is data visualization?
Data visualization is a field data analysis that deals with visual
representation of data.it graphically plots data and is an effective way to
communicate inferences from data.
Data visualization in python
python offers several plotting libraries,namely matplotlib, seaborn and
many other such data visualization packages with different features for creating
informative,customized,and appealing plots to present data in the most simple
and effective way.
Matplotlib and seaborn
Matplotlib:
It is used for basic graph plotting
like line charts,bar graphs,etc.
It mainly works with datasets and
arrays.
Seaborn is considerably more
organized and functional that
matplotlib and treats the entire
datasets as a solitary unit.
Seaborn has more inbuilt themes
and is mainly used for statistical
analysis.
Seaborn:
It is mainly used for statistics
visualization and can perform
complex visualizations with fewer
commands.
It works with entire datasets.
Matplotlib acts productively with
data arrays and frames.
It regards the aces and figure as
object.
13.
EXPLORATORY DATA ANALYSIS
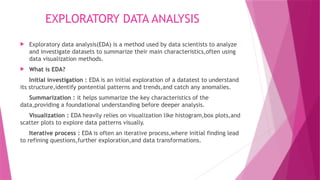
Exploratory data analysis(EDA) is a method used by data scientists to analyze
and investigate datasets to summarize their main characteristics,often using
data visualization methods.
What is EDA?
Initial investigation : EDA is an initial exploration of a datatest to understand
its structure,identify pontential patterns and trends,and catch any anomalies.
Summarization : it helps summarize the key characteristics of the
data,providing a foundational understanding before deeper analysis.
Visualization : EDA heavily relies on visualization like histogram,box plots,and
scatter plots to explore data patterns visually.
Iterative process : EDA is often an iterative process,where initial finding lead
to refining questions,further exploration,and data transformations.
14.
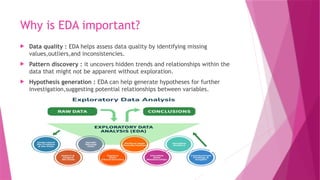
Why is EDAimportant?
Data quality : EDA helps assess data quality by identifying missing
values,outliers,and inconsistencies.
Pattern discovery : it uncovers hidden trends and relationships within the
data that might not be apparent without exploration.
Hypothesis generation : EDA can help generate hypotheses for further
investigation,suggesting potential relationships between variables.
15.
Key aspects ofEDA :
Descriptive statistics : calculation measures like mean,median,standard
deviation,and percentiles to summarize the data.
Data visualization : using graphs and charts to explore data
patterns,relationships,and disttributions.
Data transformation : cleaning,transforming,and preparing the data for
further analysis,including handling missing values and outliers.
Relationship analysis : investigating the relationships between variables using
techniques like correlation analysis and scatter plots.