Data Management Lab: Data mapping exercise example
•
1 like•9,638 views

Spring 2014 Data Management Lab: Session 1 Data mapping exercise example (more details at http://ulib.iupui.edu/digitalscholarship/dataservices/datamgmtlab) What you will learn: 1. Build awareness of research data management issues associated with digital data. 2. Introduce methods to address common data management issues and facilitate data integrity. 3. Introduce institutional resources supporting effective data management methods. 4. Build proficiency in applying these methods. 5. Build strategic skills that enable attendees to solve new data management problems.

Recommended
More Related Content
What's hot
What's hot (20)
Similar to Data Management Lab: Data mapping exercise example
Similar to Data Management Lab: Data mapping exercise example (20)
More from IUPUI
More from IUPUI (20)
Recently uploaded
Recently uploaded (20)
Data Management Lab: Data mapping exercise example
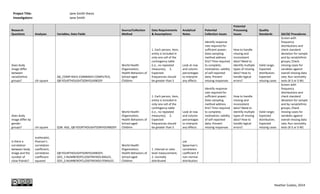
- 1. Project Title: Jane Smith thesis Investigators: Jane Smith Research Questions Analyses Variables, Data Fields Source/Collection Method Data Requirements & Assumptions Analytical Notes Potential Collection Issues Potential Processing Issues Quality Standards QA/QC Procedures Does body image differ between racial/ethnic groups? chi square Q6_COMP:RACE:COMBINED-COMPUTED, Q8:YOURTHOUGHTSONYOURBODY World Health Organization, Health Behaviors of School-aged Children 1. Each person, item, entity is included in only one cell of the contingency table (i.e., no repeated measures); 2. Expected frequencies should be greater than 5 Look at row and column percentages to interpret any effects Identify response rate required for sufficient power; Does sampling method address this? Time required to complete; motivation; validity of self-reported data; Prevent missing responses How to handle missing and inconsistent data? Need to identify multiple types of missing data? How to handle logical errors? Valid range; Expected distribution; Expected missing cases Screen with frequency distributions and check standard deviation for sample and by racial/ethnic groups; Check missing cases for variables against overall missing data rate; Run normality tests (K-S or S-W) Does body image differ by gender groups? chi square Q3B: AGE, Q8:YOURTHOUGHTSONYOURBODY World Health Organization, Health Behaviors of School-aged Children 1. Each person, item, entity is included in only one cell of the contingency table (i.e., no repeated measures); 2. Expected frequencies should be greater than 5 Look at row and column percentages to interpret any effects Identify response rate required for sufficient power; Does sampling method address this? Time required to complete; motivation; validity of self-reported data; Prevent missing responses How to handle missing and inconsistent data? Need to identify multiple types of missing data? How to handle logical errors? Valid range; Expected distribution; Expected missing cases Screen with frequency distributions and check standard deviation for sample and by racial/ethnic groups; Check missing cases for variables against overall missing data rate; Run normality tests (K-S or S-W) Is there a correlation between body image and the number of close friends? scatterplot, Pearson's correlation coefficient, correlation coefficient squared Q8:YOURTHOUGHTSONYOURBODY, Q55_1:NUMBEROFCLOSEFRIENDS:MALES, Q55_2:NUMBEROFCLOSEFRIENDS:FEMALES World Health Organization, Health Behaviors of School-aged Children 1. Interval or ratio level measurement; 2. normally distributed use Spearman's correlation coefficient if non-normal distribution Heather Coates, 2014
- 2. Does reported depression differ between racial/ethnic groups? World Health Organization, Health Behaviors of School-aged Children What is the relationship between depression and the number of close friends? World Health Organization, Health Behaviors of School-aged Children Does the rate of bullying differ between racial/ethnic groups? World Health Organization, Health Behaviors of School-aged Children Heather Coates, 2014