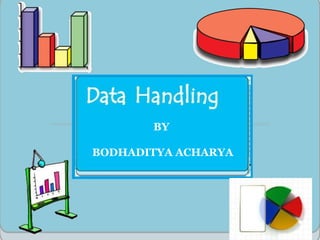
bodhaditya data handling ppt math23.pdf
•
0 likes•35 views
Data handling involves visually representing data using graphs, charts, and diagrams to more easily interpret and understand the information. It includes bar graphs, pictographs, and tally marks. A bar graph uses bars of uniform width to visually depict the frequency of different data points, with the length of each bar corresponding to the value. Pictographs use pictures or symbols to represent data values, where each symbol represents a set quantity. Tally marks are used to count frequencies by placing diagonal lines through groups of four vertical lines.
Report
Share
Report
Share
Download to read offline

Recommended
Data handling Presentation with solved examples
This document discusses different methods of data handling and visualization including bar graphs, pictographs, and tally marks. It provides examples and explanations of key elements of bar graphs including the x-axis, y-axis, bars, and scale. Pictographs are defined as using pictures or symbols to represent and compare data. Tally marks are introduced as a method of counting frequencies according to classification with diagonal lines representing groups of five. Examples of each method are shown.
Bar Graph
The document discusses different types of bar graphs, including vertical, horizontal, stacked, and grouped bar graphs. It provides examples of how to represent data using bar graphs and tips for creating bar graphs. Some key points covered include that bar graphs show data using rectangular bars of varying heights, they can represent categorical or quantitative data, and they are useful for comparing quantities across different categories.
Graphicalrepresntationofdatausingstatisticaltools2019_210902_105156.pdf
The document discusses graphical representation of data using statistical tools. It describes different types of graphs like bar charts, pie charts, scatter plots, and line charts. It explains how to select the appropriate graph based on the type of data and analyze the data. It also discusses limitations of graphs and statistical analysis methods like calculating mean and standard deviation to analyze data in a robust way.
Statistics
This document discusses different types of graphs used to present statistical data. It provides examples and guidelines for bar graphs, pie charts, histograms, line graphs, and pictographs. Bar graphs can show categorical data and frequencies. Pie charts represent qualitative data through wedge-shaped slices. Histograms use bars to depict continuous data grouped into ranges or classes. Line graphs illustrate relationships that change over time. Pictographs use images to demonstrate quantities. Being able to interpret and construct these various graphs is important for analyzing real-world data.
4-types-of-graphs.pptx
The document discusses different types of graphs used to represent organized data, including pie charts, bar graphs, line graphs, histograms, and ogives. It provides examples and explanations of how to construct and interpret each graph type. Key points covered include how pie charts show discrete data as proportional sectors of a circle, how bar graphs use horizontal or vertical bars to represent data quantities, and how line graphs show changes in a measurement over time.
Displaying data using charts and graphs
Bar charts, line graphs, pie charts, scatter plots, and histograms are commonly used types of charts. Each type of chart has distinct characteristics that make it suitable for visualizing certain types of data relationships. Bar charts are useful for comparing discrete categories, line graphs show trends over time, pie charts show proportions, scatter plots reveal correlations between two variables, and histograms display frequency distributions. Proper chart selection and design ensure data is presented clearly and accurately.
Graphing Data
This document discusses different types of graphs used to represent data: pie charts, bar graphs, line graphs, and pictographs. It provides details on the key elements of graphs, including titles, axes, legends, labels, and how to properly plot and organize data. Graphs are useful tools to help understand amounts and how things change over time by visually depicting relationships between variables.
GRAPHS-FOR-QUALITATIVE-DATA.pptx
The document discusses different types of graphs that can be used to present qualitative data, including bar graphs, line graphs, histograms, pie charts, picture graphs, scatter plots, and Pareto charts. It explains the characteristics and appropriate uses of each graph type. The intended learning outcomes are for participants to be able to explain and construct different graphs for qualitative data.
Different Types of Graphs - Copy.pptx
This document outlines different types of graphs used to display data including circle graphs, bar graphs, pictographs, broken line graphs, continuous line graphs, and scatter plots. It provides brief definitions and examples of each graph type, noting that circle graphs show portions of a whole, bar graphs are used for comparisons, pictographs use pictures to represent data, broken line graphs show trends over time, continuous line graphs have meaning between data points, and scatter plots show a set of plotted points.
Data Handling class 7.pptx
This document provides information about data handling techniques including bar graphs, pie charts, and pictographs. It defines key terms like data, range, mean, median, and mode. For data, it explains that data is a collection of information gathered for a specific purpose, like test scores or heights. It describes bar graphs as a visual way to represent data with bars of uniform width. Pie charts show the relationship between a whole and its parts, with the circle divided into sectors proportional to the information. Pictographs use pictures to show comparisons. The document also gives formulas for calculating range, mean, and median and provides examples of finding each value from data sets.
Graphical Presentation of Data - Rangga Masyhuri Nuur LLU 27.pptx
The document discusses various graphical methods for presenting data, including histograms, polygons, pie charts, ogives, and stem-and-leaf plots. Histograms display the frequency distribution of data using bars of varying heights. Polygons connect the midpoints of histogram bars with straight lines. Pie charts represent proportions using circular slices. Ogives show cumulative frequencies with class limits on the x-axis and cumulative counts on the y-axis. Stem-and-leaf plots break values into "stems" and "leaves" for an organized display of the raw data. Examples are provided for constructing each type of graph using sample data sets.
Line graph bar graph
This document provides information about different types of graphs, including line graphs and bar graphs. It defines a line graph as a diagram that connects points on an x-y plane to show the relationship between two variables. Bar graphs use vertical or horizontal bars to show comparisons between categories. The document explains the key parts of line graphs and bar graphs, such as the title, labels, scales, points and bars. It also provides steps to construct a line graph using sample data on daily earnings. For bar graphs, it outlines how to create bars of uniform width and height according to a chosen scale. An example bar graph shows the number of children in different activities.
9 Data Handling.pptx
This document provides an overview of data handling and summarizes different methods for organizing and representing data, including tally marks, pictographs, bar graphs, and frequency distribution tables. It includes examples of creating and interpreting each of these data representation methods. Key topics covered are organizing data using tally marks, interpreting and drawing pictographs and bar graphs, and making frequency distribution tables to organize raw data.
Data Handling
This document discusses the handling of data and the data cycle. It explains that data is collected information about a situation that is then organized and represented systematically. Common representations include pictographs, bar graphs, double bar graphs, and pie charts. Raw data is organized into frequency distribution tables by tally marks or grouped into intervals. Large data sets are often represented visually with histograms that show frequencies of grouped data intervals without gaps between bars. Probability is related to experiments with uncertain outcomes and is calculated based on favorable outcomes over total possible outcomes.
02graphing
Graphs are used to visually display data and allow for easy comparison of variables. The three most common types of graphs are line graphs, bar graphs, and pie charts. To create a graph, you label the axes, plot the independent variable on the x-axis and dependent variable on the y-axis, decide on intervals for each axis, plot the data points, and connect them with a line for line graphs. The SULTAN method is used to ensure graphs are properly scaled, labeled with units and a title, and have the independent variable on the x-axis and dependent on the y-axis. Bar graphs specifically show comparisons and require a key to identify different bars.
Different Types of Graphs.ppt
This document defines and provides examples of different types of graphs and data tables, including circle graphs, bar graphs, pictographs, line graphs, scatter plots, histograms, and frequency polygons. It explains that line graphs have two axes, with the independent variable typically plotted on the x-axis and the dependent variable on the y-axis. Bar graphs can be used to display grouped or interval data, and examples are provided for constructing bar graphs from sets of marks and temperature data.
Different Types of Graphs.ppt
This document discusses different types of graphs used to display data:
- Circle graphs (pie charts) show portions of a whole or group using a circle divided into sectors
- Bar graphs display data using bars of equal width on a grid for comparisons
- Pictographs use pictures/symbols to represent data, with a key explaining each symbol
- Broken line graphs join data points with line segments to show trends over time
- Continuous line graphs have meaning for points on the line between plotted points
- Scatter plots graph sets of points with no implied connections between them
Basics of Educational Statistics (Graphs & its Types)
This document provides information about different types of graphs used in statistical analysis and data visualization. It defines and describes pictograms, bar charts, pie charts, line graphs, histograms, frequency polygons, radar charts, frequency curves, and scatter plots. Advantages and disadvantages of pictograms are discussed. Key information conveyed includes that pictograms use pictures to represent data, bar charts use rectangular bars to plot discrete and categorical data, and pie charts illustrate proportions using circular sectors.
Quantitative techniques in business
1. This document discusses various quantitative techniques used in business, including measures of central tendency (mean, median, mode), cumulative frequency distributions, different types of graphs (pie charts, bar charts, histograms, frequency polygons), and methods for determining trends in time series data.
2. Measures of central tendency include the mean, median, and mode. Different measures are more appropriate depending on the data. The document also defines the arithmetic mean, geometric mean, median, and mode.
3. Graphs covered include pie charts, single/grouped/stacked bar charts, histograms, and frequency polygons. Trend analysis discusses using the method of least squares to fit a straight line trend to time series data.
Data handling
This document discusses different types of graphs used to represent data. It outlines eight main types of graphs: bar graphs, pie charts, tally charts, area graphs, pictographs, waterfall graphs, line graphs, and polar graphs. Each graph type is briefly described, including details about bar graphs having two axes (X and Y), pie charts showing proportional sectors, and waterfall charts representing cumulative positive or negative values. Pictographs use pictures to represent data, while line graphs connect data points with straight lines. The document provides a high-level overview of common graph types used for data visualization.
Different Types of Graphs-1.pptDifferent Types of Graphs-1.ppt
This document provides information about different types of graphs used to display data: circle graphs (pie charts) show portions of a whole, bar graphs allow for comparisons using vertical or horizontal bars of equal width, pictographs use pictures/symbols to represent data with a key, broken line graphs join data points with line segments to show trends over time, continuous line graphs have meaning for all points between data points, and scatter plots display sets of paired data points. Sample questions demonstrate using a bar graph to group student marks into intervals and creating a line graph to compare the average monthly temperatures of two towns over eight months.
Different Types of Graphs and their application
This document provides information about different types of graphs used to display data: circle graphs (pie charts) show portions of a whole, bar graphs allow for comparisons using vertical or horizontal bars of equal width, pictographs use pictures/symbols to represent data with a key, broken line graphs join data points with line segments to show trends over time, continuous line graphs have meaning for all points between plotted data points, and scatter plots graph sets of points without connection. Sample questions demonstrate using a bar graph to group student marks into intervals and creating a line graph to compare the average monthly temperatures of two towns over eight months.
Different types of graphs
This document provides information about different types of graphs used to display data: circle graphs (pie charts) show portions of a whole, bar graphs allow for comparisons using vertical or horizontal bars of equal width, pictographs use pictures/symbols to represent data with a key, broken line graphs join data points with line segments to show trends over time, continuous line graphs have meaning for all points between data points, and scatter plots show sets of plotted points. Sample questions demonstrate using a bar graph to group student marks into intervals and creating a line graph to compare the average monthly temperatures of two towns over eight months.
Different Types of Graphs Grade 10.ppt
This document provides information about different types of graphs used to display data: circle graphs (pie charts) show portions of a whole, bar graphs allow for comparisons using vertical or horizontal bars of equal width, pictographs use pictures/symbols to represent data with a key, broken line graphs join data points over time, continuous line graphs have meaning between plotted points, and scatter plots show sets of plotted points. It includes sample questions about displaying student mark data in a bar graph and comparing average monthly temperatures in two towns using a line graph.
Different types of graphs
This document provides information about different types of graphs used to display data: circle graphs (pie charts) show portions of a whole, bar graphs allow for comparisons using vertical or horizontal bars of equal width, pictographs use pictures/symbols to represent data with a key, broken line graphs join data points with line segments to show trends over time, continuous line graphs have meaning for all points between plotted data points, and scatter plots graph sets of points. Sample questions demonstrate using a bar graph to group student marks into intervals and creating a line graph to compare the average monthly temperatures of two towns over eight months.
kinds of graph for english 10 grammar ..
This document discusses different types of graphs used to display data: circle graphs (pie charts) show portions of a whole, bar graphs allow for comparisons using vertical or horizontal bars of equal width, pictographs use pictures to represent data with a key, broken line graphs join data points to show trends over time, continuous line graphs have meaning between plotted points, and scatter plots display sets of paired data points. Sample questions demonstrate using a bar graph to group student marks into intervals and creating a line graph on the same grid to compare the average monthly temperatures of two towns over eight months.
Different Types of Graphs
This document provides information about different types of graphs used to display data: circle graphs (pie charts) show portions of a whole, bar graphs allow for comparisons using vertical or horizontal bars of equal width, pictographs use pictures/symbols to represent data with a key, broken line graphs join data points with line segments to show trends over time, continuous line graphs have meaning for all points between plotted data points, and scatter plots graph sets of points without connection. Sample questions demonstrate using a bar graph to group student marks into intervals and creating a line graph to compare the average monthly temperatures of two towns over eight months.
Different types of graphs
This document provides information about different types of graphs used to display data: circle graphs (pie charts) show portions of a whole, bar graphs allow for comparisons using vertical or horizontal bars of equal width, pictographs use pictures/symbols to represent data with a key, broken line graphs join data points with line segments to show trends over time, continuous line graphs have meaning for all points between data points, and scatter plots graph sets of points. Sample questions demonstrate using a bar graph to group student marks into intervals and creating a line graph to compare the average monthly temperatures of two towns over eight months.
IEEE CIS Webinar Sustainable futures.pdf
The importance of sustainable and efficient computational practices in artificial intelligence (AI) and deep learning has become increasingly critical. This webinar focuses on the intersection of sustainability and AI, highlighting the significance of energy-efficient deep learning, innovative randomization techniques in neural networks, the potential of reservoir computing, and the cutting-edge realm of neuromorphic computing. This webinar aims to connect theoretical knowledge with practical applications and provide insights into how these innovative approaches can lead to more robust, efficient, and environmentally conscious AI systems.
Webinar Speaker: Prof. Claudio Gallicchio, Assistant Professor, University of Pisa
Claudio Gallicchio is an Assistant Professor at the Department of Computer Science of the University of Pisa, Italy. His research involves merging concepts from Deep Learning, Dynamical Systems, and Randomized Neural Systems, and he has co-authored over 100 scientific publications on the subject. He is the founder of the IEEE CIS Task Force on Reservoir Computing, and the co-founder and chair of the IEEE Task Force on Randomization-based Neural Networks and Learning Systems. He is an associate editor of IEEE Transactions on Neural Networks and Learning Systems (TNNLS).
The Intersection between Competition and Data Privacy – OECD – June 2024 OECD...
The Intersection between Competition and Data Privacy – OECD – June 2024 OECD...OECD Directorate for Financial and Enterprise Affairs
This presentation by OECD, OECD Secretariat, was made during the discussion “The Intersection between Competition and Data Privacy” held at the 143rd meeting of the OECD Competition Committee on 13 June 2024. More papers and presentations on the topic can be found at oe.cd/ibcdp.
This presentation was uploaded with the author’s consent.
More Related Content
Similar to bodhaditya data handling ppt math23.pdf
Different Types of Graphs - Copy.pptx
This document outlines different types of graphs used to display data including circle graphs, bar graphs, pictographs, broken line graphs, continuous line graphs, and scatter plots. It provides brief definitions and examples of each graph type, noting that circle graphs show portions of a whole, bar graphs are used for comparisons, pictographs use pictures to represent data, broken line graphs show trends over time, continuous line graphs have meaning between data points, and scatter plots show a set of plotted points.
Data Handling class 7.pptx
This document provides information about data handling techniques including bar graphs, pie charts, and pictographs. It defines key terms like data, range, mean, median, and mode. For data, it explains that data is a collection of information gathered for a specific purpose, like test scores or heights. It describes bar graphs as a visual way to represent data with bars of uniform width. Pie charts show the relationship between a whole and its parts, with the circle divided into sectors proportional to the information. Pictographs use pictures to show comparisons. The document also gives formulas for calculating range, mean, and median and provides examples of finding each value from data sets.
Graphical Presentation of Data - Rangga Masyhuri Nuur LLU 27.pptx
The document discusses various graphical methods for presenting data, including histograms, polygons, pie charts, ogives, and stem-and-leaf plots. Histograms display the frequency distribution of data using bars of varying heights. Polygons connect the midpoints of histogram bars with straight lines. Pie charts represent proportions using circular slices. Ogives show cumulative frequencies with class limits on the x-axis and cumulative counts on the y-axis. Stem-and-leaf plots break values into "stems" and "leaves" for an organized display of the raw data. Examples are provided for constructing each type of graph using sample data sets.
Line graph bar graph
This document provides information about different types of graphs, including line graphs and bar graphs. It defines a line graph as a diagram that connects points on an x-y plane to show the relationship between two variables. Bar graphs use vertical or horizontal bars to show comparisons between categories. The document explains the key parts of line graphs and bar graphs, such as the title, labels, scales, points and bars. It also provides steps to construct a line graph using sample data on daily earnings. For bar graphs, it outlines how to create bars of uniform width and height according to a chosen scale. An example bar graph shows the number of children in different activities.
9 Data Handling.pptx
This document provides an overview of data handling and summarizes different methods for organizing and representing data, including tally marks, pictographs, bar graphs, and frequency distribution tables. It includes examples of creating and interpreting each of these data representation methods. Key topics covered are organizing data using tally marks, interpreting and drawing pictographs and bar graphs, and making frequency distribution tables to organize raw data.
Data Handling
This document discusses the handling of data and the data cycle. It explains that data is collected information about a situation that is then organized and represented systematically. Common representations include pictographs, bar graphs, double bar graphs, and pie charts. Raw data is organized into frequency distribution tables by tally marks or grouped into intervals. Large data sets are often represented visually with histograms that show frequencies of grouped data intervals without gaps between bars. Probability is related to experiments with uncertain outcomes and is calculated based on favorable outcomes over total possible outcomes.
02graphing
Graphs are used to visually display data and allow for easy comparison of variables. The three most common types of graphs are line graphs, bar graphs, and pie charts. To create a graph, you label the axes, plot the independent variable on the x-axis and dependent variable on the y-axis, decide on intervals for each axis, plot the data points, and connect them with a line for line graphs. The SULTAN method is used to ensure graphs are properly scaled, labeled with units and a title, and have the independent variable on the x-axis and dependent on the y-axis. Bar graphs specifically show comparisons and require a key to identify different bars.
Different Types of Graphs.ppt
This document defines and provides examples of different types of graphs and data tables, including circle graphs, bar graphs, pictographs, line graphs, scatter plots, histograms, and frequency polygons. It explains that line graphs have two axes, with the independent variable typically plotted on the x-axis and the dependent variable on the y-axis. Bar graphs can be used to display grouped or interval data, and examples are provided for constructing bar graphs from sets of marks and temperature data.
Different Types of Graphs.ppt
This document discusses different types of graphs used to display data:
- Circle graphs (pie charts) show portions of a whole or group using a circle divided into sectors
- Bar graphs display data using bars of equal width on a grid for comparisons
- Pictographs use pictures/symbols to represent data, with a key explaining each symbol
- Broken line graphs join data points with line segments to show trends over time
- Continuous line graphs have meaning for points on the line between plotted points
- Scatter plots graph sets of points with no implied connections between them
Basics of Educational Statistics (Graphs & its Types)
This document provides information about different types of graphs used in statistical analysis and data visualization. It defines and describes pictograms, bar charts, pie charts, line graphs, histograms, frequency polygons, radar charts, frequency curves, and scatter plots. Advantages and disadvantages of pictograms are discussed. Key information conveyed includes that pictograms use pictures to represent data, bar charts use rectangular bars to plot discrete and categorical data, and pie charts illustrate proportions using circular sectors.
Quantitative techniques in business
1. This document discusses various quantitative techniques used in business, including measures of central tendency (mean, median, mode), cumulative frequency distributions, different types of graphs (pie charts, bar charts, histograms, frequency polygons), and methods for determining trends in time series data.
2. Measures of central tendency include the mean, median, and mode. Different measures are more appropriate depending on the data. The document also defines the arithmetic mean, geometric mean, median, and mode.
3. Graphs covered include pie charts, single/grouped/stacked bar charts, histograms, and frequency polygons. Trend analysis discusses using the method of least squares to fit a straight line trend to time series data.
Data handling
This document discusses different types of graphs used to represent data. It outlines eight main types of graphs: bar graphs, pie charts, tally charts, area graphs, pictographs, waterfall graphs, line graphs, and polar graphs. Each graph type is briefly described, including details about bar graphs having two axes (X and Y), pie charts showing proportional sectors, and waterfall charts representing cumulative positive or negative values. Pictographs use pictures to represent data, while line graphs connect data points with straight lines. The document provides a high-level overview of common graph types used for data visualization.
Different Types of Graphs-1.pptDifferent Types of Graphs-1.ppt
This document provides information about different types of graphs used to display data: circle graphs (pie charts) show portions of a whole, bar graphs allow for comparisons using vertical or horizontal bars of equal width, pictographs use pictures/symbols to represent data with a key, broken line graphs join data points with line segments to show trends over time, continuous line graphs have meaning for all points between data points, and scatter plots display sets of paired data points. Sample questions demonstrate using a bar graph to group student marks into intervals and creating a line graph to compare the average monthly temperatures of two towns over eight months.
Different Types of Graphs and their application
This document provides information about different types of graphs used to display data: circle graphs (pie charts) show portions of a whole, bar graphs allow for comparisons using vertical or horizontal bars of equal width, pictographs use pictures/symbols to represent data with a key, broken line graphs join data points with line segments to show trends over time, continuous line graphs have meaning for all points between plotted data points, and scatter plots graph sets of points without connection. Sample questions demonstrate using a bar graph to group student marks into intervals and creating a line graph to compare the average monthly temperatures of two towns over eight months.
Different types of graphs
This document provides information about different types of graphs used to display data: circle graphs (pie charts) show portions of a whole, bar graphs allow for comparisons using vertical or horizontal bars of equal width, pictographs use pictures/symbols to represent data with a key, broken line graphs join data points with line segments to show trends over time, continuous line graphs have meaning for all points between data points, and scatter plots show sets of plotted points. Sample questions demonstrate using a bar graph to group student marks into intervals and creating a line graph to compare the average monthly temperatures of two towns over eight months.
Different Types of Graphs Grade 10.ppt
This document provides information about different types of graphs used to display data: circle graphs (pie charts) show portions of a whole, bar graphs allow for comparisons using vertical or horizontal bars of equal width, pictographs use pictures/symbols to represent data with a key, broken line graphs join data points over time, continuous line graphs have meaning between plotted points, and scatter plots show sets of plotted points. It includes sample questions about displaying student mark data in a bar graph and comparing average monthly temperatures in two towns using a line graph.
Different types of graphs
This document provides information about different types of graphs used to display data: circle graphs (pie charts) show portions of a whole, bar graphs allow for comparisons using vertical or horizontal bars of equal width, pictographs use pictures/symbols to represent data with a key, broken line graphs join data points with line segments to show trends over time, continuous line graphs have meaning for all points between plotted data points, and scatter plots graph sets of points. Sample questions demonstrate using a bar graph to group student marks into intervals and creating a line graph to compare the average monthly temperatures of two towns over eight months.
kinds of graph for english 10 grammar ..
This document discusses different types of graphs used to display data: circle graphs (pie charts) show portions of a whole, bar graphs allow for comparisons using vertical or horizontal bars of equal width, pictographs use pictures to represent data with a key, broken line graphs join data points to show trends over time, continuous line graphs have meaning between plotted points, and scatter plots display sets of paired data points. Sample questions demonstrate using a bar graph to group student marks into intervals and creating a line graph on the same grid to compare the average monthly temperatures of two towns over eight months.
Different Types of Graphs
This document provides information about different types of graphs used to display data: circle graphs (pie charts) show portions of a whole, bar graphs allow for comparisons using vertical or horizontal bars of equal width, pictographs use pictures/symbols to represent data with a key, broken line graphs join data points with line segments to show trends over time, continuous line graphs have meaning for all points between plotted data points, and scatter plots graph sets of points without connection. Sample questions demonstrate using a bar graph to group student marks into intervals and creating a line graph to compare the average monthly temperatures of two towns over eight months.
Different types of graphs
This document provides information about different types of graphs used to display data: circle graphs (pie charts) show portions of a whole, bar graphs allow for comparisons using vertical or horizontal bars of equal width, pictographs use pictures/symbols to represent data with a key, broken line graphs join data points with line segments to show trends over time, continuous line graphs have meaning for all points between data points, and scatter plots graph sets of points. Sample questions demonstrate using a bar graph to group student marks into intervals and creating a line graph to compare the average monthly temperatures of two towns over eight months.
Similar to bodhaditya data handling ppt math23.pdf (20)
Graphical Presentation of Data - Rangga Masyhuri Nuur LLU 27.pptx
Graphical Presentation of Data - Rangga Masyhuri Nuur LLU 27.pptx
Basics of Educational Statistics (Graphs & its Types)
Basics of Educational Statistics (Graphs & its Types)
Different Types of Graphs-1.pptDifferent Types of Graphs-1.ppt
Different Types of Graphs-1.pptDifferent Types of Graphs-1.ppt
Recently uploaded
IEEE CIS Webinar Sustainable futures.pdf
The importance of sustainable and efficient computational practices in artificial intelligence (AI) and deep learning has become increasingly critical. This webinar focuses on the intersection of sustainability and AI, highlighting the significance of energy-efficient deep learning, innovative randomization techniques in neural networks, the potential of reservoir computing, and the cutting-edge realm of neuromorphic computing. This webinar aims to connect theoretical knowledge with practical applications and provide insights into how these innovative approaches can lead to more robust, efficient, and environmentally conscious AI systems.
Webinar Speaker: Prof. Claudio Gallicchio, Assistant Professor, University of Pisa
Claudio Gallicchio is an Assistant Professor at the Department of Computer Science of the University of Pisa, Italy. His research involves merging concepts from Deep Learning, Dynamical Systems, and Randomized Neural Systems, and he has co-authored over 100 scientific publications on the subject. He is the founder of the IEEE CIS Task Force on Reservoir Computing, and the co-founder and chair of the IEEE Task Force on Randomization-based Neural Networks and Learning Systems. He is an associate editor of IEEE Transactions on Neural Networks and Learning Systems (TNNLS).
The Intersection between Competition and Data Privacy – OECD – June 2024 OECD...
The Intersection between Competition and Data Privacy – OECD – June 2024 OECD...OECD Directorate for Financial and Enterprise Affairs
This presentation by OECD, OECD Secretariat, was made during the discussion “The Intersection between Competition and Data Privacy” held at the 143rd meeting of the OECD Competition Committee on 13 June 2024. More papers and presentations on the topic can be found at oe.cd/ibcdp.
This presentation was uploaded with the author’s consent.
一比一原版(unc毕业证书)美国北卡罗来纳大学教堂山分校毕业证如何办理
原版一模一样【微信:741003700 】【(unc毕业证书)美国北卡罗来纳大学教堂山分校毕业证成绩单】【微信:741003700 】学位证,留信认证(真实可查,永久存档)原件一模一样纸张工艺/offer、雅思、外壳等材料/诚信可靠,可直接看成品样本,帮您解决无法毕业带来的各种难题!外壳,原版制作,诚信可靠,可直接看成品样本。行业标杆!精益求精,诚心合作,真诚制作!多年品质 ,按需精细制作,24小时接单,全套进口原装设备。十五年致力于帮助留学生解决难题,包您满意。
本公司拥有海外各大学样板无数,能完美还原。
1:1完美还原海外各大学毕业材料上的工艺:水印,阴影底纹,钢印LOGO烫金烫银,LOGO烫金烫银复合重叠。文字图案浮雕、激光镭射、紫外荧光、温感、复印防伪等防伪工艺。材料咨询办理、认证咨询办理请加学历顾问Q/微741003700
【主营项目】
一.毕业证【q微741003700】成绩单、使馆认证、教育部认证、雅思托福成绩单、学生卡等!
二.真实使馆公证(即留学回国人员证明,不成功不收费)
三.真实教育部学历学位认证(教育部存档!教育部留服网站永久可查)
四.办理各国各大学文凭(一对一专业服务,可全程监控跟踪进度)
如果您处于以下几种情况:
◇在校期间,因各种原因未能顺利毕业……拿不到官方毕业证【q/微741003700】
◇面对父母的压力,希望尽快拿到;
◇不清楚认证流程以及材料该如何准备;
◇回国时间很长,忘记办理;
◇回国马上就要找工作,办给用人单位看;
◇企事业单位必须要求办理的
◇需要报考公务员、购买免税车、落转户口
◇申请留学生创业基金
留信网认证的作用:
1:该专业认证可证明留学生真实身份
2:同时对留学生所学专业登记给予评定
3:国家专业人才认证中心颁发入库证书
4:这个认证书并且可以归档倒地方
5:凡事获得留信网入网的信息将会逐步更新到个人身份内,将在公安局网内查询个人身份证信息后,同步读取人才网入库信息
6:个人职称评审加20分
7:个人信誉贷款加10分
8:在国家人才网主办的国家网络招聘大会中纳入资料,供国家高端企业选择人才
办理(unc毕业证书)美国北卡罗来纳大学教堂山分校毕业证【微信:741003700 】外观非常简单,由纸质材料制成,上面印有校徽、校名、毕业生姓名、专业等信息。
办理(unc毕业证书)美国北卡罗来纳大学教堂山分校毕业证【微信:741003700 】格式相对统一,各专业都有相应的模板。通常包括以下部分:
校徽:象征着学校的荣誉和传承。
校名:学校英文全称
授予学位:本部分将注明获得的具体学位名称。
毕业生姓名:这是最重要的信息之一,标志着该证书是由特定人员获得的。
颁发日期:这是毕业正式生效的时间,也代表着毕业生学业的结束。
其他信息:根据不同的专业和学位,可能会有一些特定的信息或章节。
办理(unc毕业证书)美国北卡罗来纳大学教堂山分校毕业证【微信:741003700 】价值很高,需要妥善保管。一般来说,应放置在安全、干燥、防潮的地方,避免长时间暴露在阳光下。如需使用,最好使用复印件而不是原件,以免丢失。
综上所述,办理(unc毕业证书)美国北卡罗来纳大学教堂山分校毕业证【微信:741003700 】是证明身份和学历的高价值文件。外观简单庄重,格式统一,包括重要的个人信息和发布日期。对持有人来说,妥善保管是非常重要的。
The Intersection between Competition and Data Privacy – KEMP – June 2024 OECD...
The Intersection between Competition and Data Privacy – KEMP – June 2024 OECD...OECD Directorate for Financial and Enterprise Affairs
This presentation by Katharine Kemp, Associate Professor at the Faculty of Law & Justice at UNSW Sydney, was made during the discussion “The Intersection between Competition and Data Privacy” held at the 143rd meeting of the OECD Competition Committee on 13 June 2024. More papers and presentations on the topic can be found at oe.cd/ibcdp.
This presentation was uploaded with the author’s consent.
怎么办理(lincoln学位证书)英国林肯大学毕业证文凭学位证书原版一模一样
原版定制【微信:bwp0011】《(lincoln学位证书)英国林肯大学毕业证文凭学位证书》【微信:bwp0011】成绩单 、雅思、外壳、留信学历认证永久存档查询,采用学校原版纸张、特殊工艺完全按照原版一比一制作(包括:隐形水印,阴影底纹,钢印LOGO烫金烫银,LOGO烫金烫银复合重叠,文字图案浮雕,激光镭射,紫外荧光,温感,复印防伪)行业标杆!精益求精,诚心合作,真诚制作!多年品质 ,按需精细制作,24小时接单,全套进口原装设备,十五年致力于帮助留学生解决难题,业务范围有加拿大、英国、澳洲、韩国、美国、新加坡,新西兰等学历材料,包您满意。
【业务选择办理准则】
一、工作未确定,回国需先给父母、亲戚朋友看下文凭的情况,办理一份就读学校的毕业证【微信bwp0011】文凭即可
二、回国进私企、外企、自己做生意的情况,这些单位是不查询毕业证真伪的,而且国内没有渠道去查询国外文凭的真假,也不需要提供真实教育部认证。鉴于此,办理一份毕业证【微信bwp0011】即可
三、进国企,银行,事业单位,考公务员等等,这些单位是必需要提供真实教育部认证的,办理教育部认证所需资料众多且烦琐,所有材料您都必须提供原件,我们凭借丰富的经验,快捷的绿色通道帮您快速整合材料,让您少走弯路。
留信网认证的作用:
1:该专业认证可证明留学生真实身份
2:同时对留学生所学专业登记给予评定
3:国家专业人才认证中心颁发入库证书
4:这个认证书并且可以归档倒地方
5:凡事获得留信网入网的信息将会逐步更新到个人身份内,将在公安局网内查询个人身份证信息后,同步读取人才网入库信息
6:个人职称评审加20分
7:个人信誉贷款加10分
8:在国家人才网主办的国家网络招聘大会中纳入资料,供国家高端企业选择人才
【关于价格问题(保证一手价格)】
我们所定的价格是非常合理的,而且我们现在做得单子大多数都是代理和回头客户介绍的所以一般现在有新的单子 我给客户的都是第一手的代理价格,因为我想坦诚对待大家 不想跟大家在价格方面浪费时间
对于老客户或者被老客户介绍过来的朋友,我们都会适当给一些优惠。
ServiceNow CIS-ITSM Exam Dumps & Questions [2024]
• For a full set of 530+ questions. Go to
https://skillcertpro.com/product/servicenow-cis-itsm-exam-questions/
• SkillCertPro offers detailed explanations to each question which helps to understand the concepts better.
• It is recommended to score above 85% in SkillCertPro exams before attempting a real exam.
• SkillCertPro updates exam questions every 2 weeks.
• You will get life time access and life time free updates
• SkillCertPro assures 100% pass guarantee in first attempt.
ACTIVE IMPLANTABLE MEDICAL DEVICE IN EUROPE
This presentation will help you to know about the classification ,approval process and article related to active implantable medical device
Gamify it until you make it Improving Agile Development and Operations with ...
So many challenges, so little time. While we’re busy developing software and keeping it operational, we also need to sharpen the saw, but how? Gamification can be a way to look at how you’re doing and find out where to improve. It’s a great way to have everyone involved and get the best out of people.
In this presentation, Ben Linders will show how playing games with the DevOps coaching cards can help to explore your current development and deployment (DevOps) practices and decide as a team what to improve or experiment with.
The games that we play are based on an engagement model. Instead of imposing change, the games enable people to pull in ideas for change and apply those in a way that best suits their collective needs.
By playing games, you can learn from each other. Teams can use games, exercises, and coaching cards to discuss values, principles, and practices, and share their experiences and learnings.
Different game formats can be used to share experiences on DevOps principles and practices and explore how they can be applied effectively. This presentation provides an overview of playing formats and will inspire you to come up with your own formats.
The Intersection between Competition and Data Privacy – CAPEL – June 2024 OEC...
The Intersection between Competition and Data Privacy – CAPEL – June 2024 OEC...OECD Directorate for Financial and Enterprise Affairs
This presentation by Tim Capel, Director of the UK Information Commissioner’s Office Legal Service, was made during the discussion “The Intersection between Competition and Data Privacy” held at the 143rd meeting of the OECD Competition Committee on 13 June 2024. More papers and presentations on the topic can be found at oe.cd/ibcdp.
This presentation was uploaded with the author’s consent.
BRIC_2024_2024-06-06-11:30-haunschild_archival_version.pdf
These are the slides of my presentation at BRIC 2024 about global science overlay maps using OpenAlex.
Proposal: The Ark Project and The BEEP Inc
1.) Introduction
Our Movement is not new; it is the same as it was for Freedom, Justice, and Equality since we were labeled as slaves. However, this movement at its core must entail economics.
2.) Historical Context
This is the same movement because none of the previous movements, such as boycotts, were ever completed. For some, maybe, but for the most part, it’s just a place to keep your stable until you’re ready to assimilate them into your system. The rest of the crabs are left in the world’s worst parts, begging for scraps.
3.) Economic Empowerment
Our Movement aims to show that it is indeed possible for the less fortunate to establish their economic system. Everyone else – Caucasian, Asian, Mexican, Israeli, Jews, etc. – has their systems, and they all set up and usurp money from the less fortunate. So, the less fortunate buy from every one of them, yet none of them buy from the less fortunate. Moreover, the less fortunate really don’t have anything to sell.
4.) Collaboration with Organizations
Our Movement will demonstrate how organizations such as the National Association for the Advancement of Colored People, National Urban League, Black Lives Matter, and others can assist in creating a much more indestructible Black Wall Street.
5.) Vision for the Future
Our Movement will not settle for less than those who came before us and stopped before the rights were equal. The economy, jobs, healthcare, education, housing, incarceration – everything is unfair, and what isn’t is rigged for the less fortunate to fail, as evidenced in society.
6.) Call to Action
Our movement has started and implemented everything needed for the advancement of the economic system. There are positions for only those who understand the importance of this movement, as failure to address it will continue the degradation of the people deemed less fortunate.
No, this isn’t Noah’s Ark, nor am I a Prophet. I’m just a man who wrote a couple of books, created a magnificent website: http://www.thearkproject.llc, and who truly hopes to try and initiate a truly sustainable economic system for deprived people. We may not all have the same beliefs, but if our methods are tried, tested, and proven, we can come together and help others. My website: http://www.thearkproject.llc is very informative and considerably controversial. Please check it out, and if you are afraid, leave immediately; it’s no place for cowards. The last Prophet said: “Whoever among you sees an evil action, then let him change it with his hand [by taking action]; if he cannot, then with his tongue [by speaking out]; and if he cannot, then, with his heart – and that is the weakest of faith.” [Sahih Muslim] If we all, or even some of us, did this, there would be significant change. We are able to witness it on small and grand scales, for example, from climate control to business partnerships. I encourage, invite, and challenge you all to support me by visiting my website.
Disaster Management project for holidays homework and other uses
It talks about disaster management in a helful way.
Using-Presentation-Software-to-the-Fullf.pptx
Slides on 7 Commonly Used Presentation Softwares; thier usage and features.
2 December UAE National Day - United Arab Emirates
UAE National Day, celebrated on December 2nd, commemorates the unification of the seven emirates and reflects national pride and unity.
The Intersection between Competition and Data Privacy – COLANGELO – June 2024...
The Intersection between Competition and Data Privacy – COLANGELO – June 2024...OECD Directorate for Financial and Enterprise Affairs
This presentation by Professor Giuseppe Colangelo, Jean Monnet Professor of European Innovation Policy, was made during the discussion “The Intersection between Competition and Data Privacy” held at the 143rd meeting of the OECD Competition Committee on 13 June 2024. More papers and presentations on the topic can be found at oe.cd/ibcdp.
This presentation was uploaded with the author’s consent.
Why Psychological Safety Matters for Software Teams - ACE 2024 - Ben Linders.pdf
Psychological safety in teams is important; team members must feel safe and able to communicate and collaborate effectively to deliver value. It’s also necessary to build long-lasting teams since things will happen and relationships will be strained.
But, how safe is a team? How can we determine if there are any factors that make the team unsafe or have an impact on the team’s culture?
In this mini-workshop, we’ll play games for psychological safety and team culture utilizing a deck of coaching cards, The Psychological Safety Cards. We will learn how to use gamification to gain a better understanding of what’s going on in teams. Individuals share what they have learned from working in teams, what has impacted the team’s safety and culture, and what has led to positive change.
Different game formats will be played in groups in parallel. Examples are an ice-breaker to get people talking about psychological safety, a constellation where people take positions about aspects of psychological safety in their team or organization, and collaborative card games where people work together to create an environment that fosters psychological safety.
Recently uploaded (19)
The Intersection between Competition and Data Privacy – OECD – June 2024 OECD...
The Intersection between Competition and Data Privacy – OECD – June 2024 OECD...
Legislation And Regulations For Import, Manufacture,.pptx
Legislation And Regulations For Import, Manufacture,.pptx
The Intersection between Competition and Data Privacy – KEMP – June 2024 OECD...
The Intersection between Competition and Data Privacy – KEMP – June 2024 OECD...
Gamify it until you make it Improving Agile Development and Operations with ...
Gamify it until you make it Improving Agile Development and Operations with ...
The Intersection between Competition and Data Privacy – CAPEL – June 2024 OEC...
The Intersection between Competition and Data Privacy – CAPEL – June 2024 OEC...
BRIC_2024_2024-06-06-11:30-haunschild_archival_version.pdf
BRIC_2024_2024-06-06-11:30-haunschild_archival_version.pdf
Prsentation for VIVA Welike project 1semester.pptx
Prsentation for VIVA Welike project 1semester.pptx
Disaster Management project for holidays homework and other uses
Disaster Management project for holidays homework and other uses
2 December UAE National Day - United Arab Emirates
2 December UAE National Day - United Arab Emirates
The Intersection between Competition and Data Privacy – COLANGELO – June 2024...
The Intersection between Competition and Data Privacy – COLANGELO – June 2024...
Why Psychological Safety Matters for Software Teams - ACE 2024 - Ben Linders.pdf
Why Psychological Safety Matters for Software Teams - ACE 2024 - Ben Linders.pdf
bodhaditya data handling ppt math23.pdf
- 2. Data handling is the way in which Data can be represented graphically to give a clear idea of whatit represents. It is easier to interpret and organize data using pictorial representation. Data handling includes bar graph, pictograph and tally marks.
- 3. It is the way of representing data visually. Bars areof uniform width and can be drawn horizontally or vertically with equal spacing between them. The length of each bar represents the given number frequency.
- 5. 1. Y-axis: The line on a graph that runs vertically (up-down)through zero. It is used as a reference line so you can measure fromit. 2. X-axis: The line on a graph that runs horizontally (left-right) through zero. It is used as a reference line so you canmeasure from it. 3. Bars: They can be horizontal or vertical. Bars of a bar graph are used to show how large each valueis. 4. Scale: A scale on a graph is what we use to measure the distance between the givencoordinates.
- 6. Sweets Sold on aMonday 16 14 12 10 8 6 4 2 0 Toffee Crisp Snickers Bounty Kitkat Mars Twix Sweets Number What is the most popularsweet bought on Mondays? Mars It is easy to answer this question from a graph. There is only one set of data onthis graph.
- 7. The representation of an information through pictures is called a pictograph. Pictographs use relative sizes or repetitions of the same icon, picture, or symbol to show comparison. Also called pictogram, pictorial chart, pictorial graph, or picturegraph.
- 9. A method of counting frequencies, according to some classification, in a set of data. For ease of counting, every fifth observation is represented by a diagonal line crossing the previous four to make a five-barred gate. Tally charts are often used with grouped observations
- 10. Solved questions- Reading Group Number of books Read Frequency Badgers 16 Tigers 14 Peacocks 23 Elephants 4 Pigs 2 Spiders 13
- 11. Key: picture =10people How many children walk to school? 65 (6 x 10)+5=
- 12. Ekta is asked to collect data for sizeof shoes of students in her Class VI. Her finding are recorded in the manner shown below : Ekta prepared a table using tally marks. 6 8 (i) the size of shoes worn by the maximumnumber of students. 6 (ii) the size of shoes worn by the minimum numberof students. 8
- 13. Read the adjoining bar graph showing the number of students in a particular class of aschool. a) What is the scale of thisgraph? b) How many new students are added everyyear? c) Is the number of students in the year 2003twice that in the year2000? =1 0 1unit length students 1unit length =10students 10 10students 30 60 yes