The document outlines steps for a data handling activity where students:
1) Plan how to complete tasks related to collecting and analyzing car count data.
2) Collect car count data based on color near their home for 30 minutes.
3) Record the data using two methods such as a stem-and-leaf diagram or frequency table.
4) Compare data in groups and share findings.
5) Display the collected data using charts and graphs and interpret the results.
In this document
Powered by AI
Introduction to the theme of Data Handling, setting the groundwork for further exploration.
Step 1: Planning the data handling project with focus on various topics and time constraints.
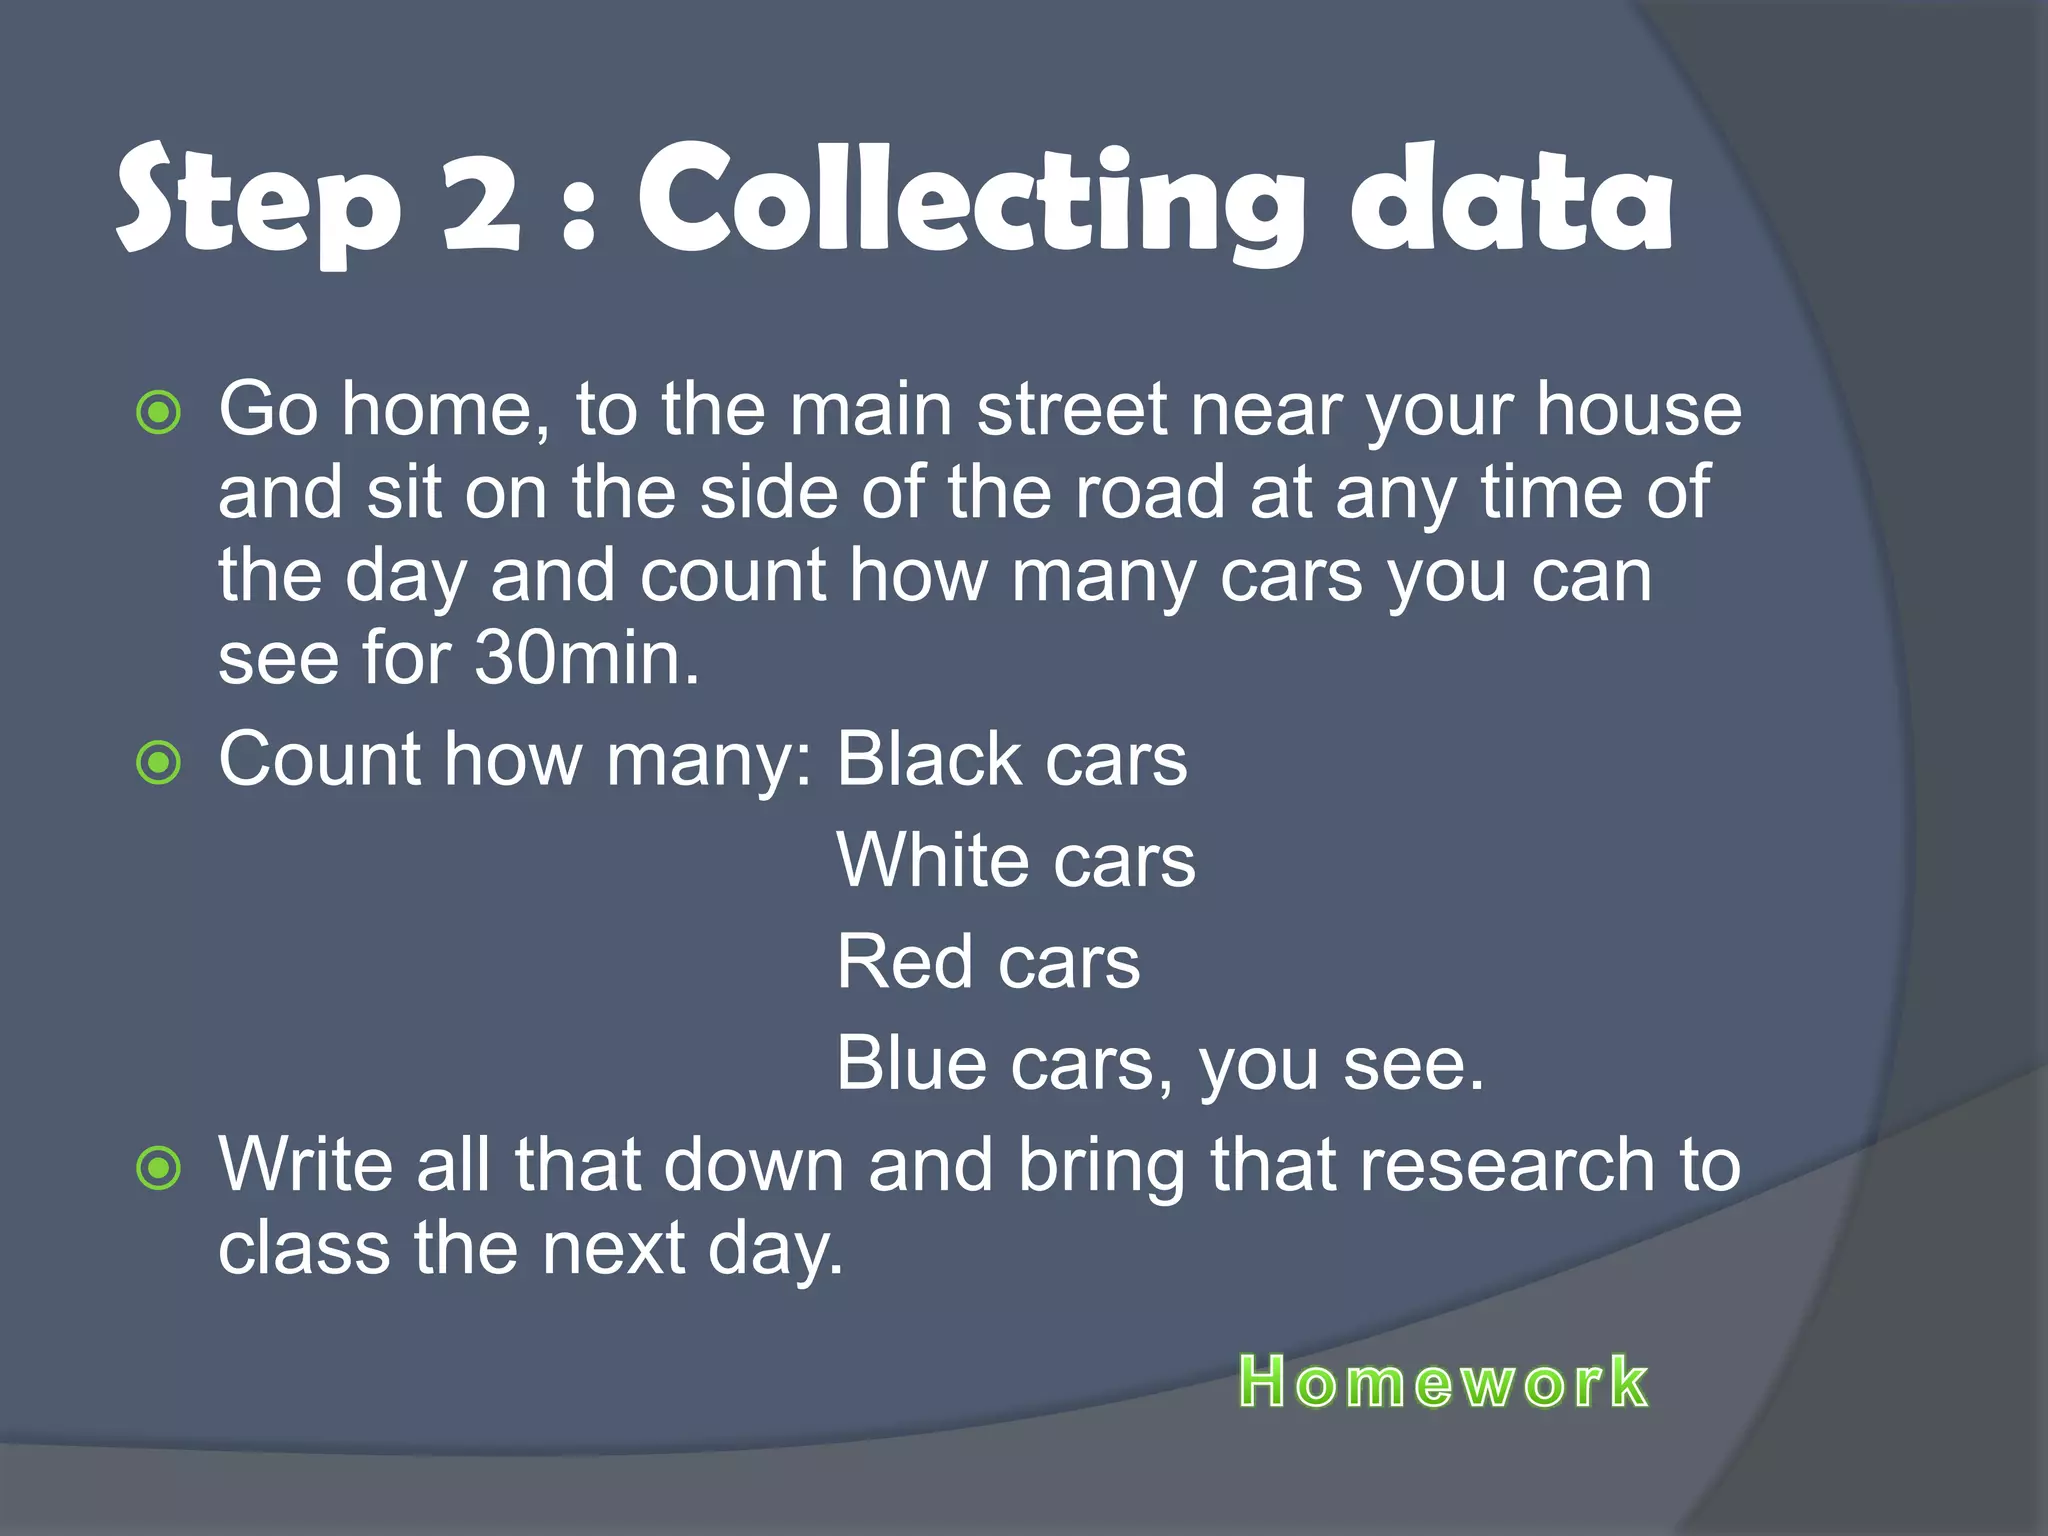
Step 2: Students collect data by counting car colors on a street for 30 minutes, to be recorded.
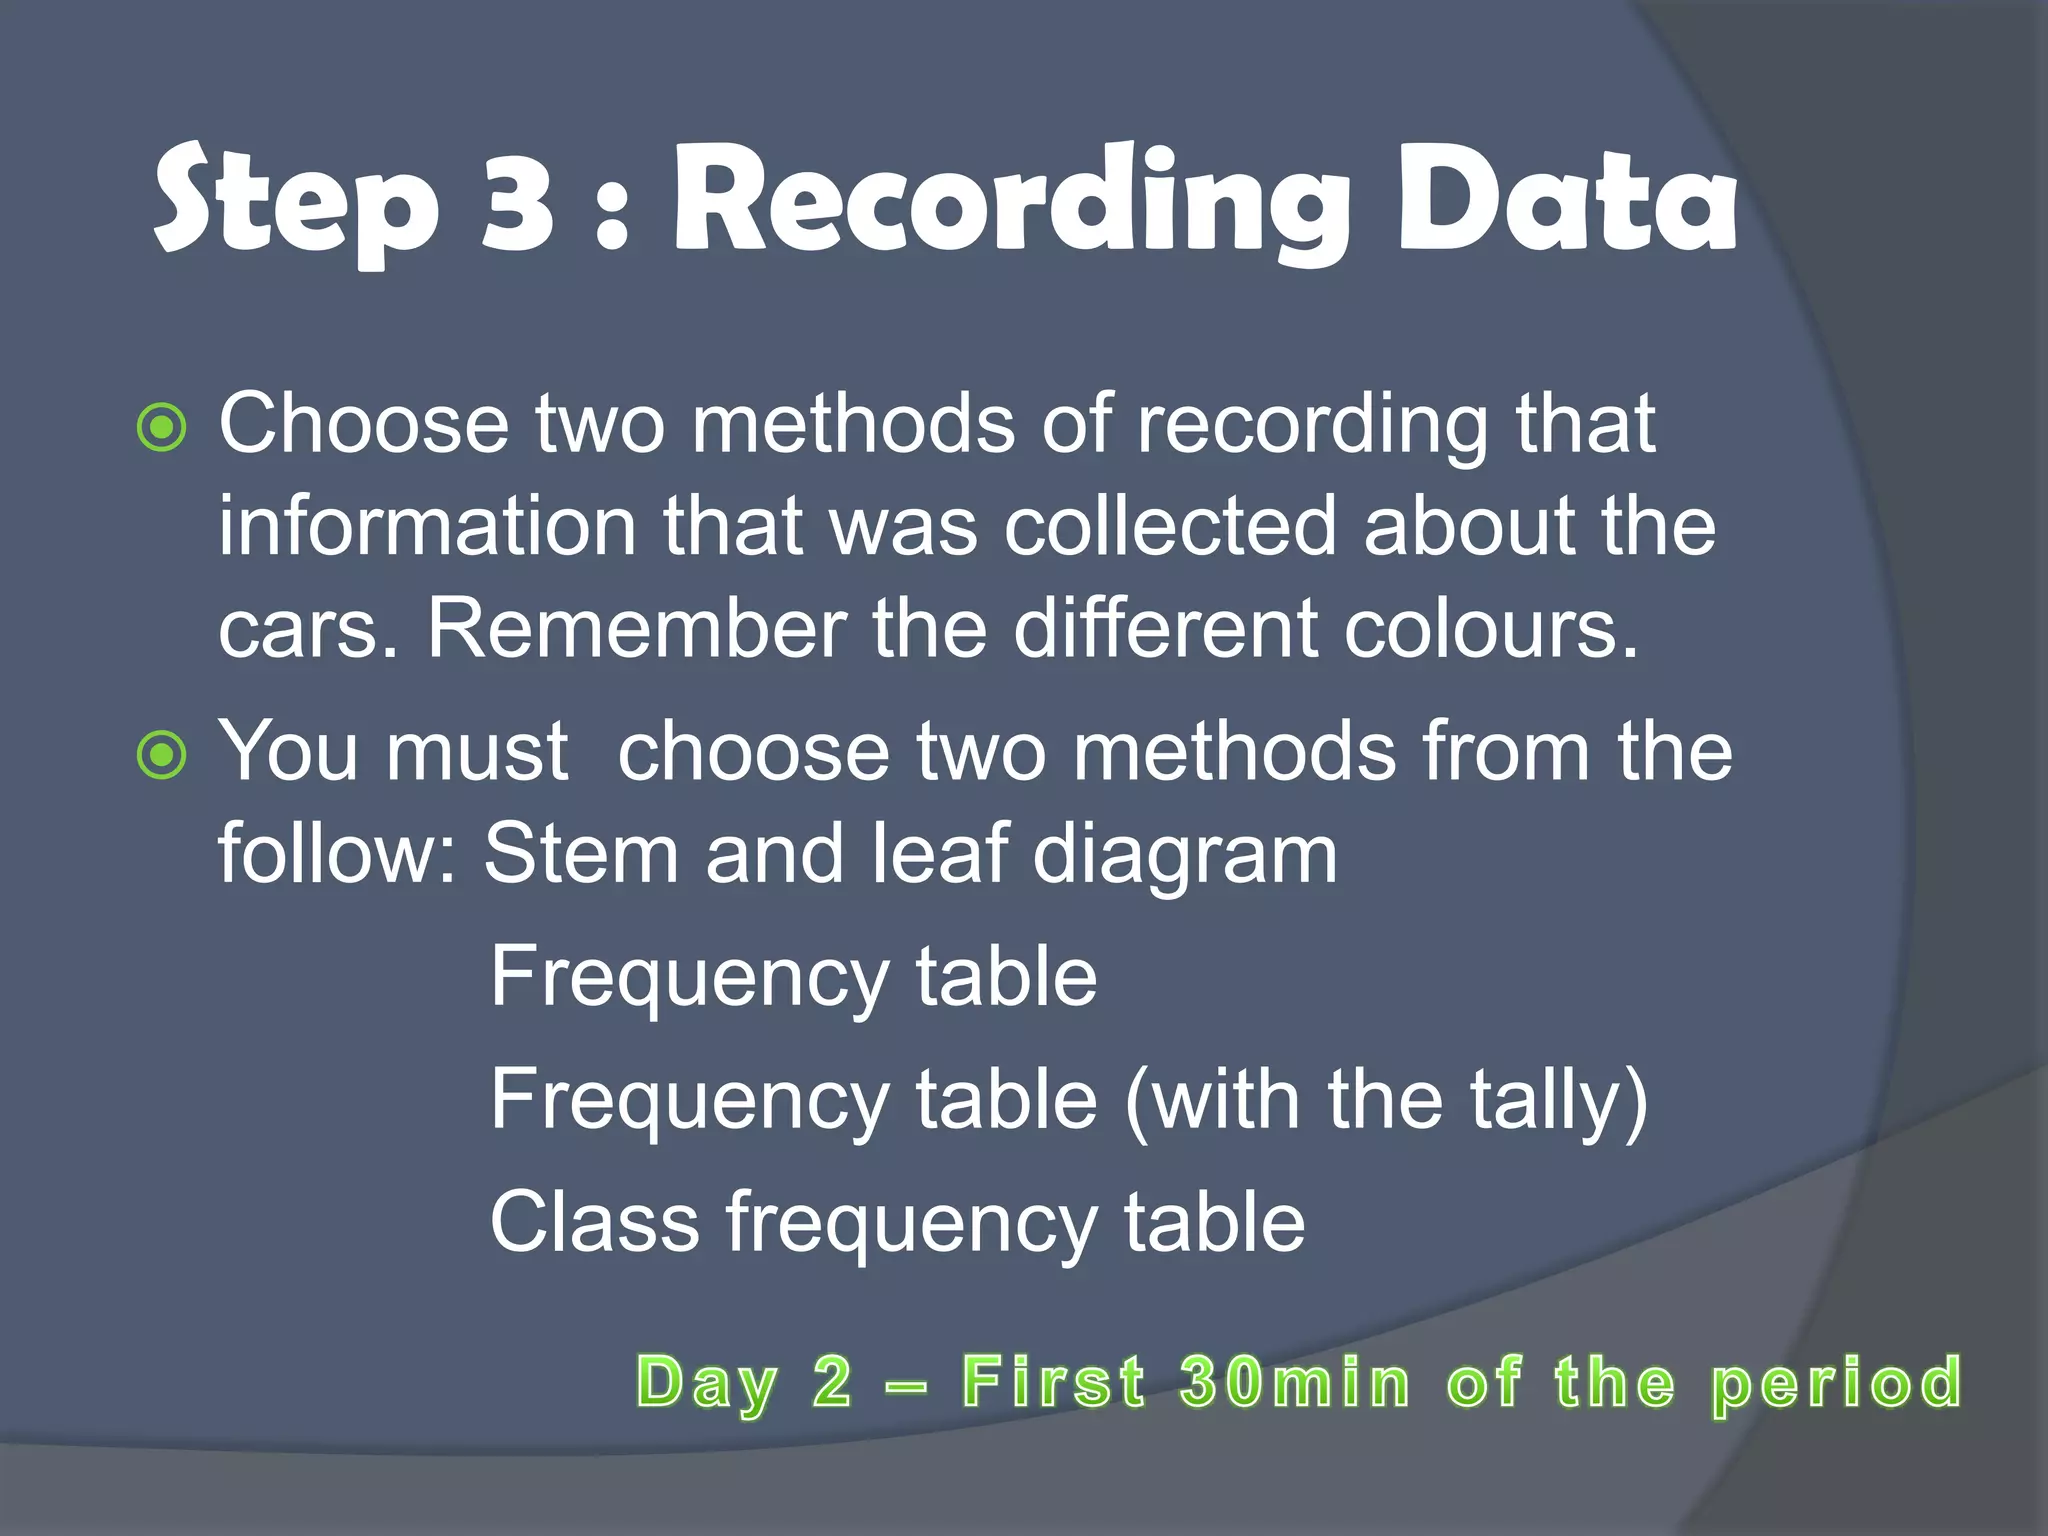
Step 3: Students choose two methods to record car data, with options like stem and leaf diagrams.
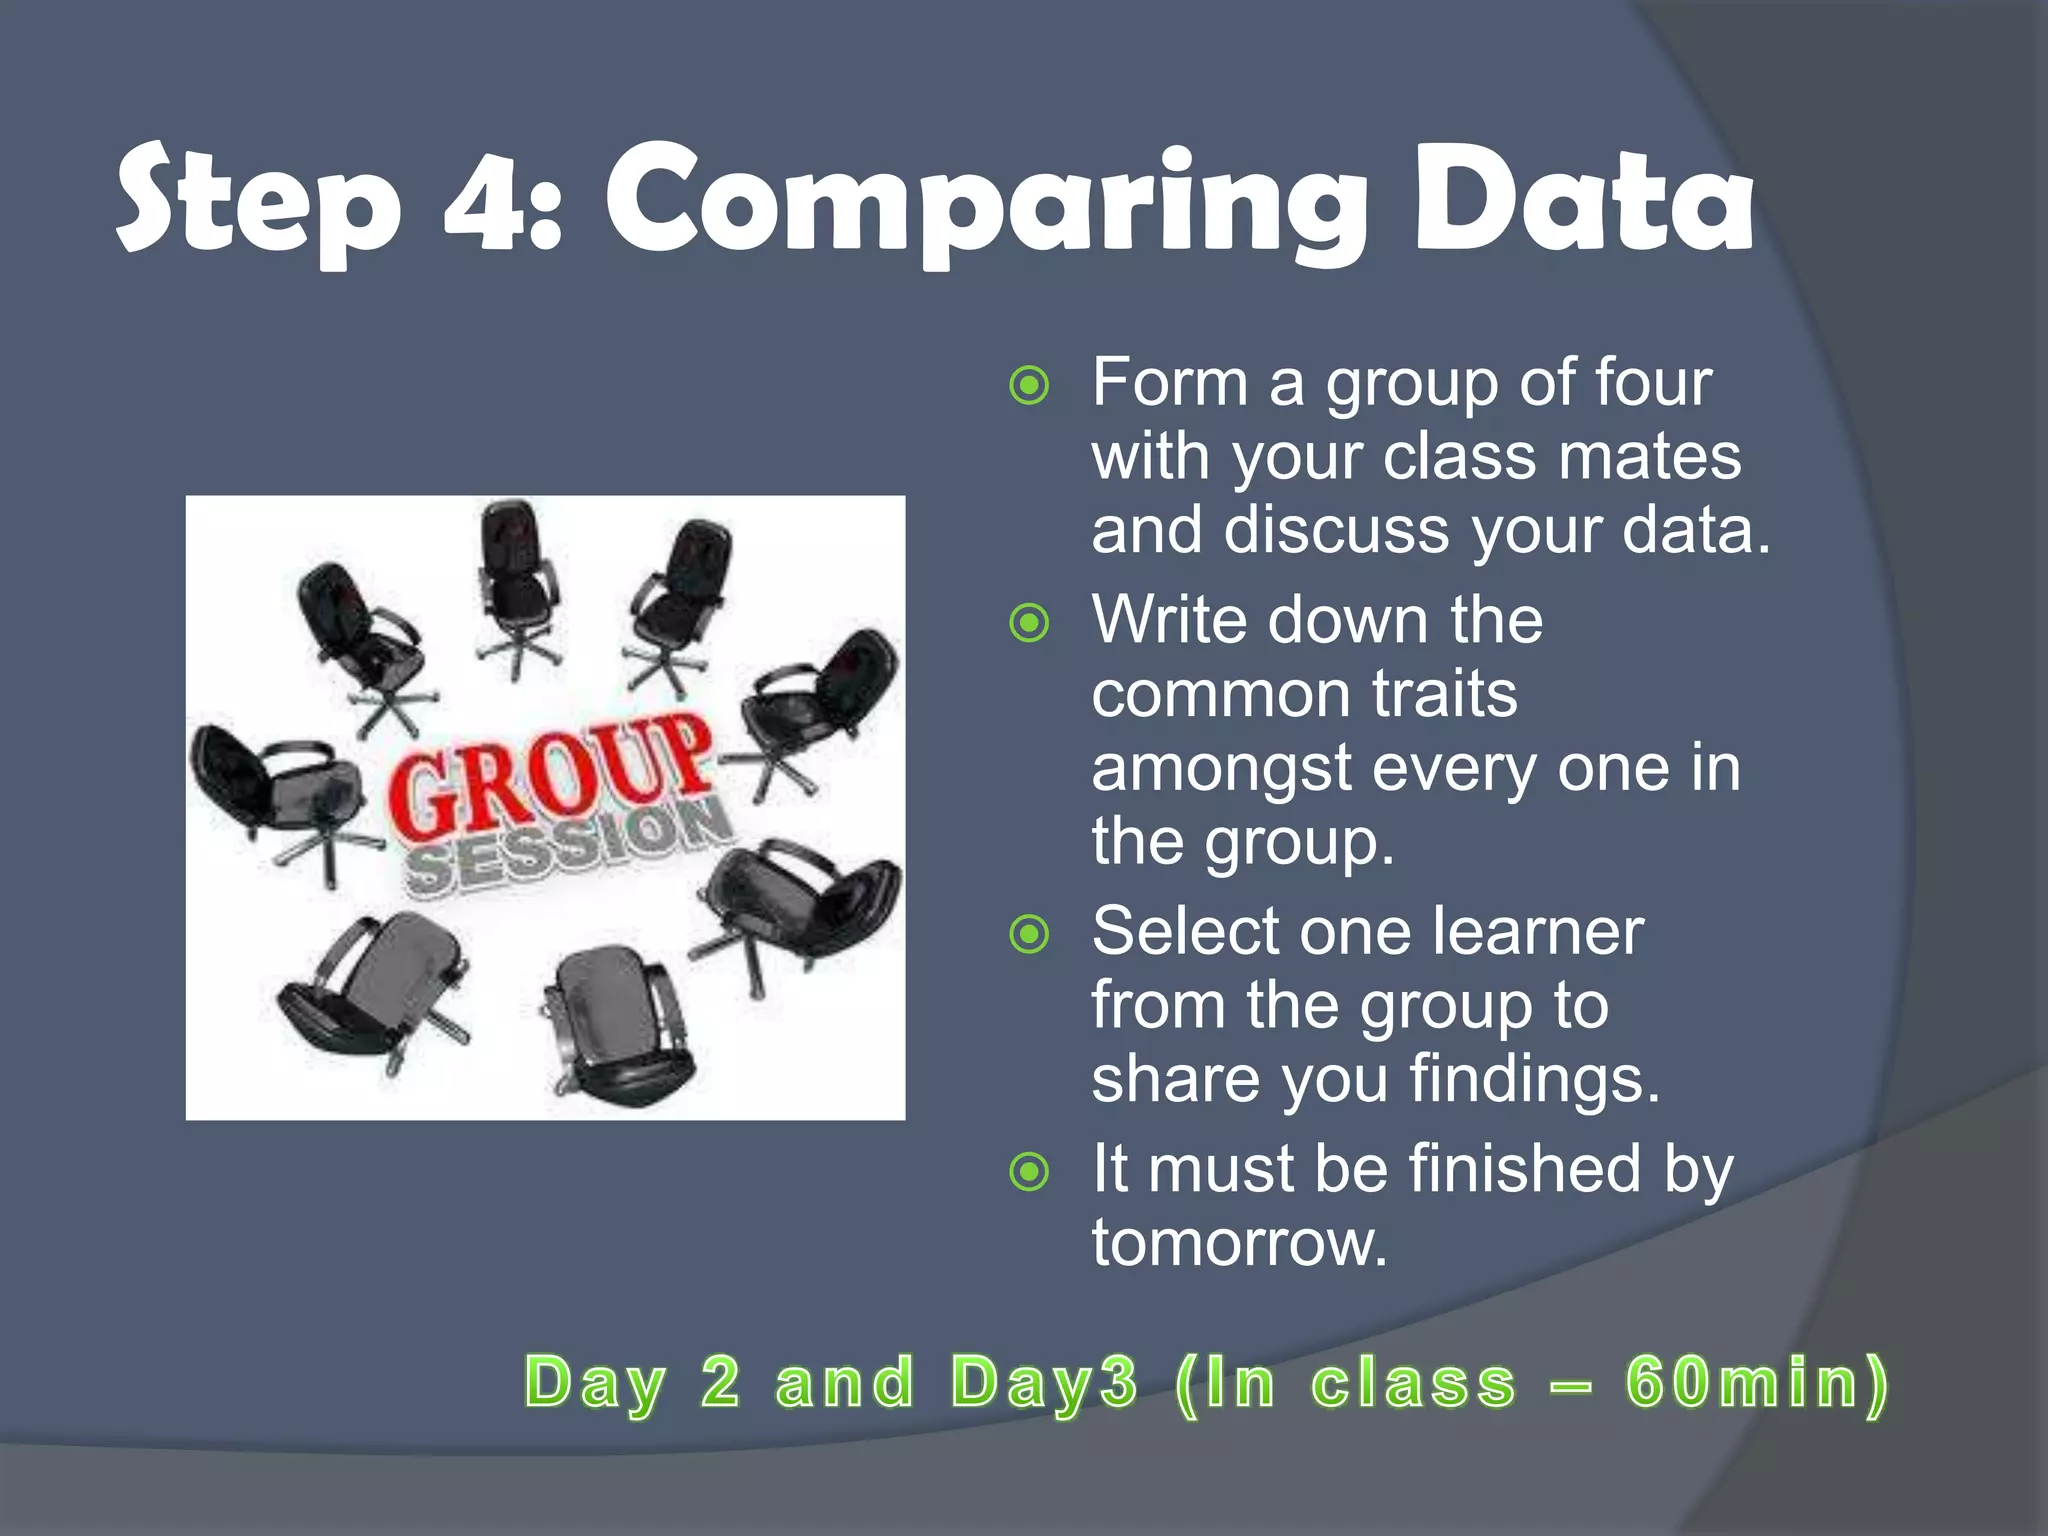
Step 4: Students compare findings in groups, writing common traits, with a deadline for sharing.
Step 5: Students display data using pie charts and other graphical representations with calculations.
Step 6: Answering questions about car traffic patterns and preferences after data display.
Conclusion: Students write an essay reflecting on their experiences and learnings from the activity.
Step 1 :Planning
During the course of this
period I want you to look
at all the different topics
on Data Handling.
Then you are going draw
up a plan of how to
complete this task
accordingly (Remember
to include particular time
constraints)
3.
Step 2 :Collecting data
Go home, to the main street near your house
and sit on the side of the road at any time of
the day and count how many cars you can
see for 30min.
Count how many: Black cars
White cars
Red cars
Blue cars, you see.
Write all that down and bring that research to
class the next day.
4.
Step 3 :Recording Data
Choose two methods of recording that
information that was collected about the
cars. Remember the different colours.
You must choose two methods from the
follow: Stem and leaf diagram
Frequency table
Frequency table (with the tally)
Class frequency table
5.
Step 4: ComparingData
Form a group of four
with your class mates
and discuss your data.
Write down the
common traits
amongst every one in
the group.
Select one learner
from the group to
share you findings.
It must be finished by
tomorrow.
6.
Step 5: DisplayingData
Now using your own data that you
collected on Day 1. You must represent
that information on a pie chart
(remember to show all calculation.)
Then choose another method, such as a
bar graph, histogram, line graph etc.
And display the data again.
7.
Step 6 :Interpreting Data
Answer the following questions:
1. Which area has the most cars passing by in the afternoons?
( also take note of your classmates’ findings)
2. Which colour car is mostly seen in all the areas?
3. Considering the amount of cars there are in the afternoon
(after 5pm). Why do you think there are that cars?
4. If your mother wanted to buy herself a different and unusual
colour car. What colour would you recommend to her?
5. Overall which road is the busiest road at any time of the
day?
After drawing the pie chart and the other graphs to display
your data. Where else in the world do you think they use
these graphs and why?
8.
Conclusion
Write ashort essay ( 10 – 15 lines)
about what you learnt from this activity.
Remember to write what you liked and
what you did not like about the entire
activity.