Downloaded 125 times

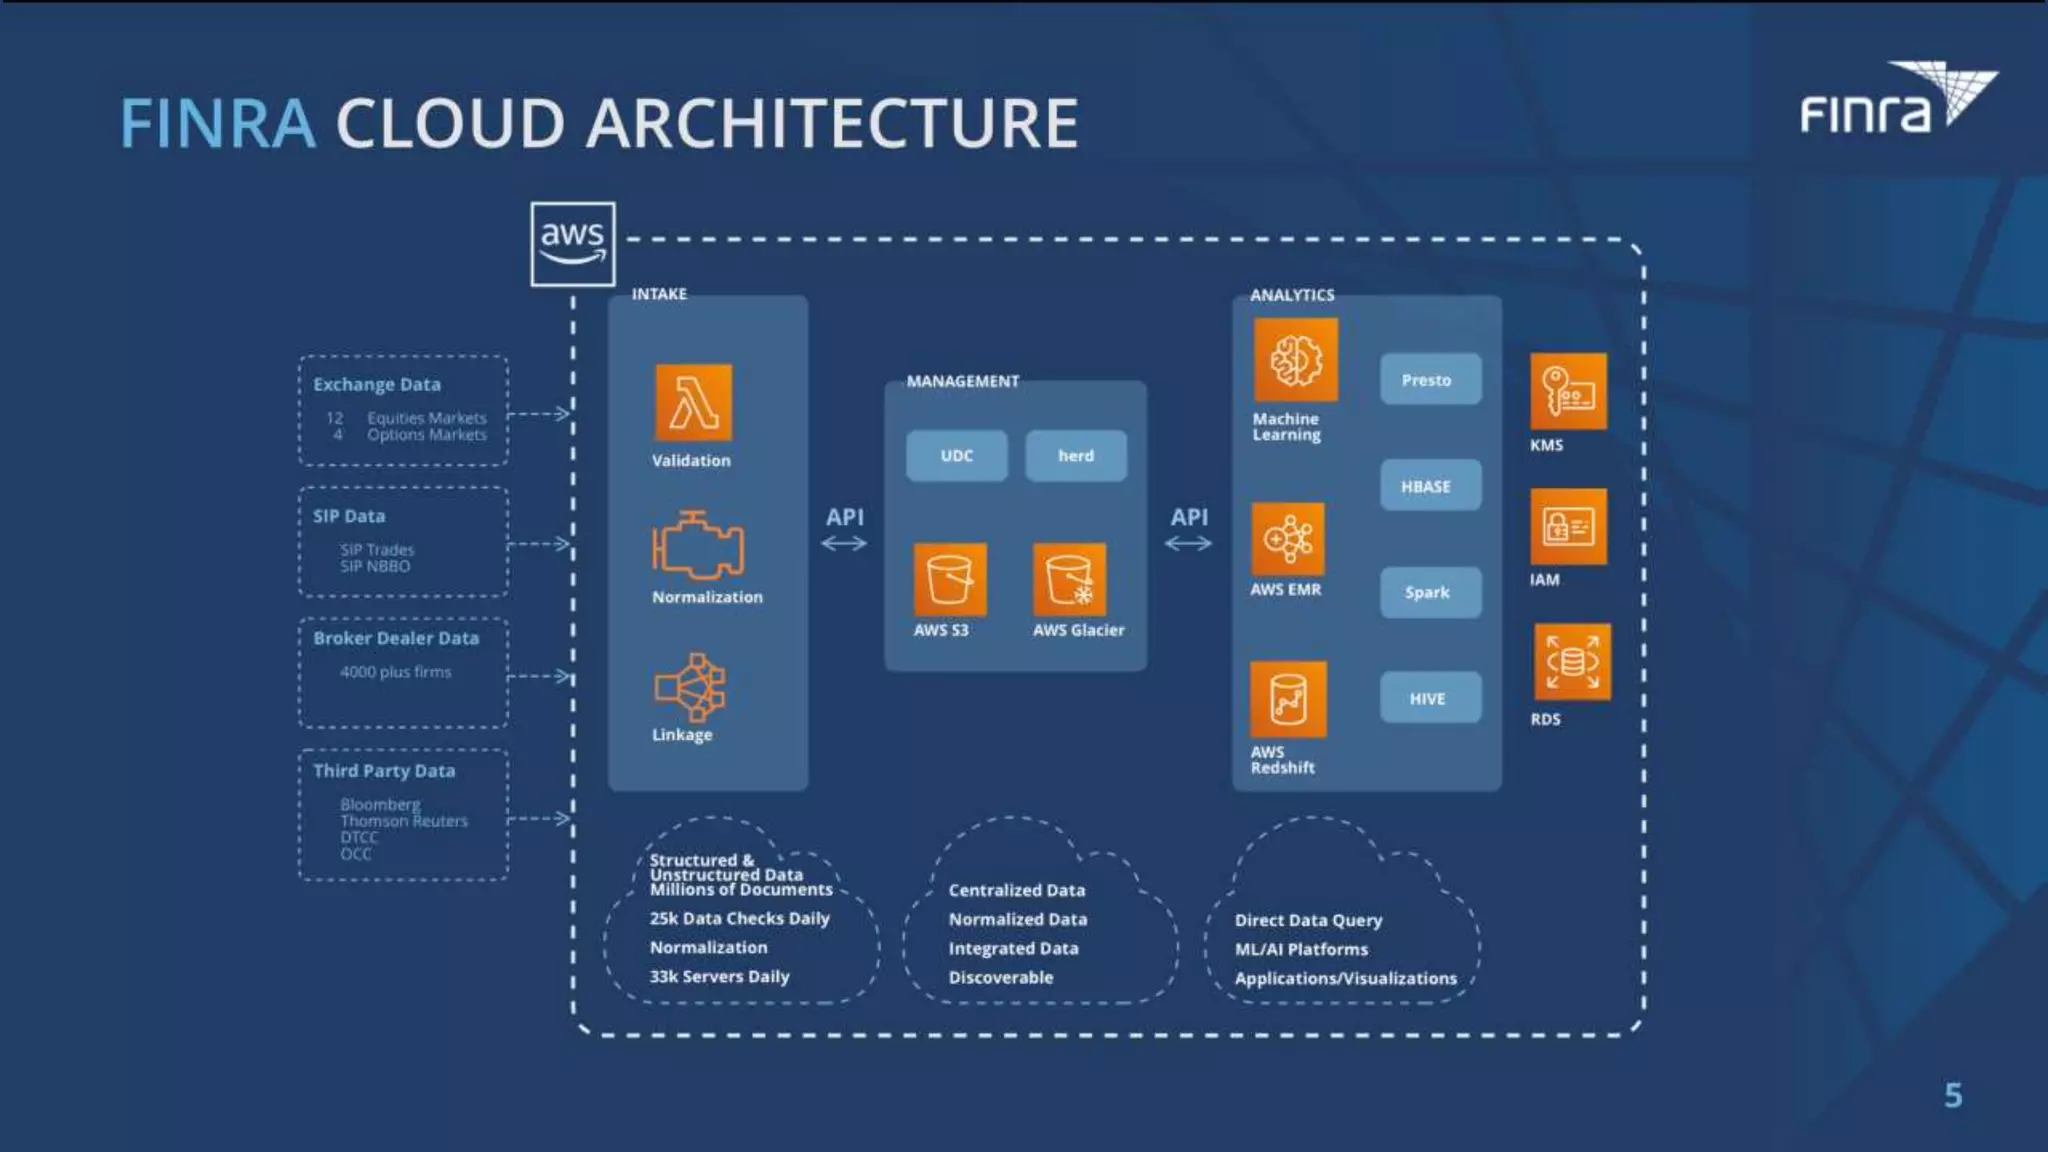
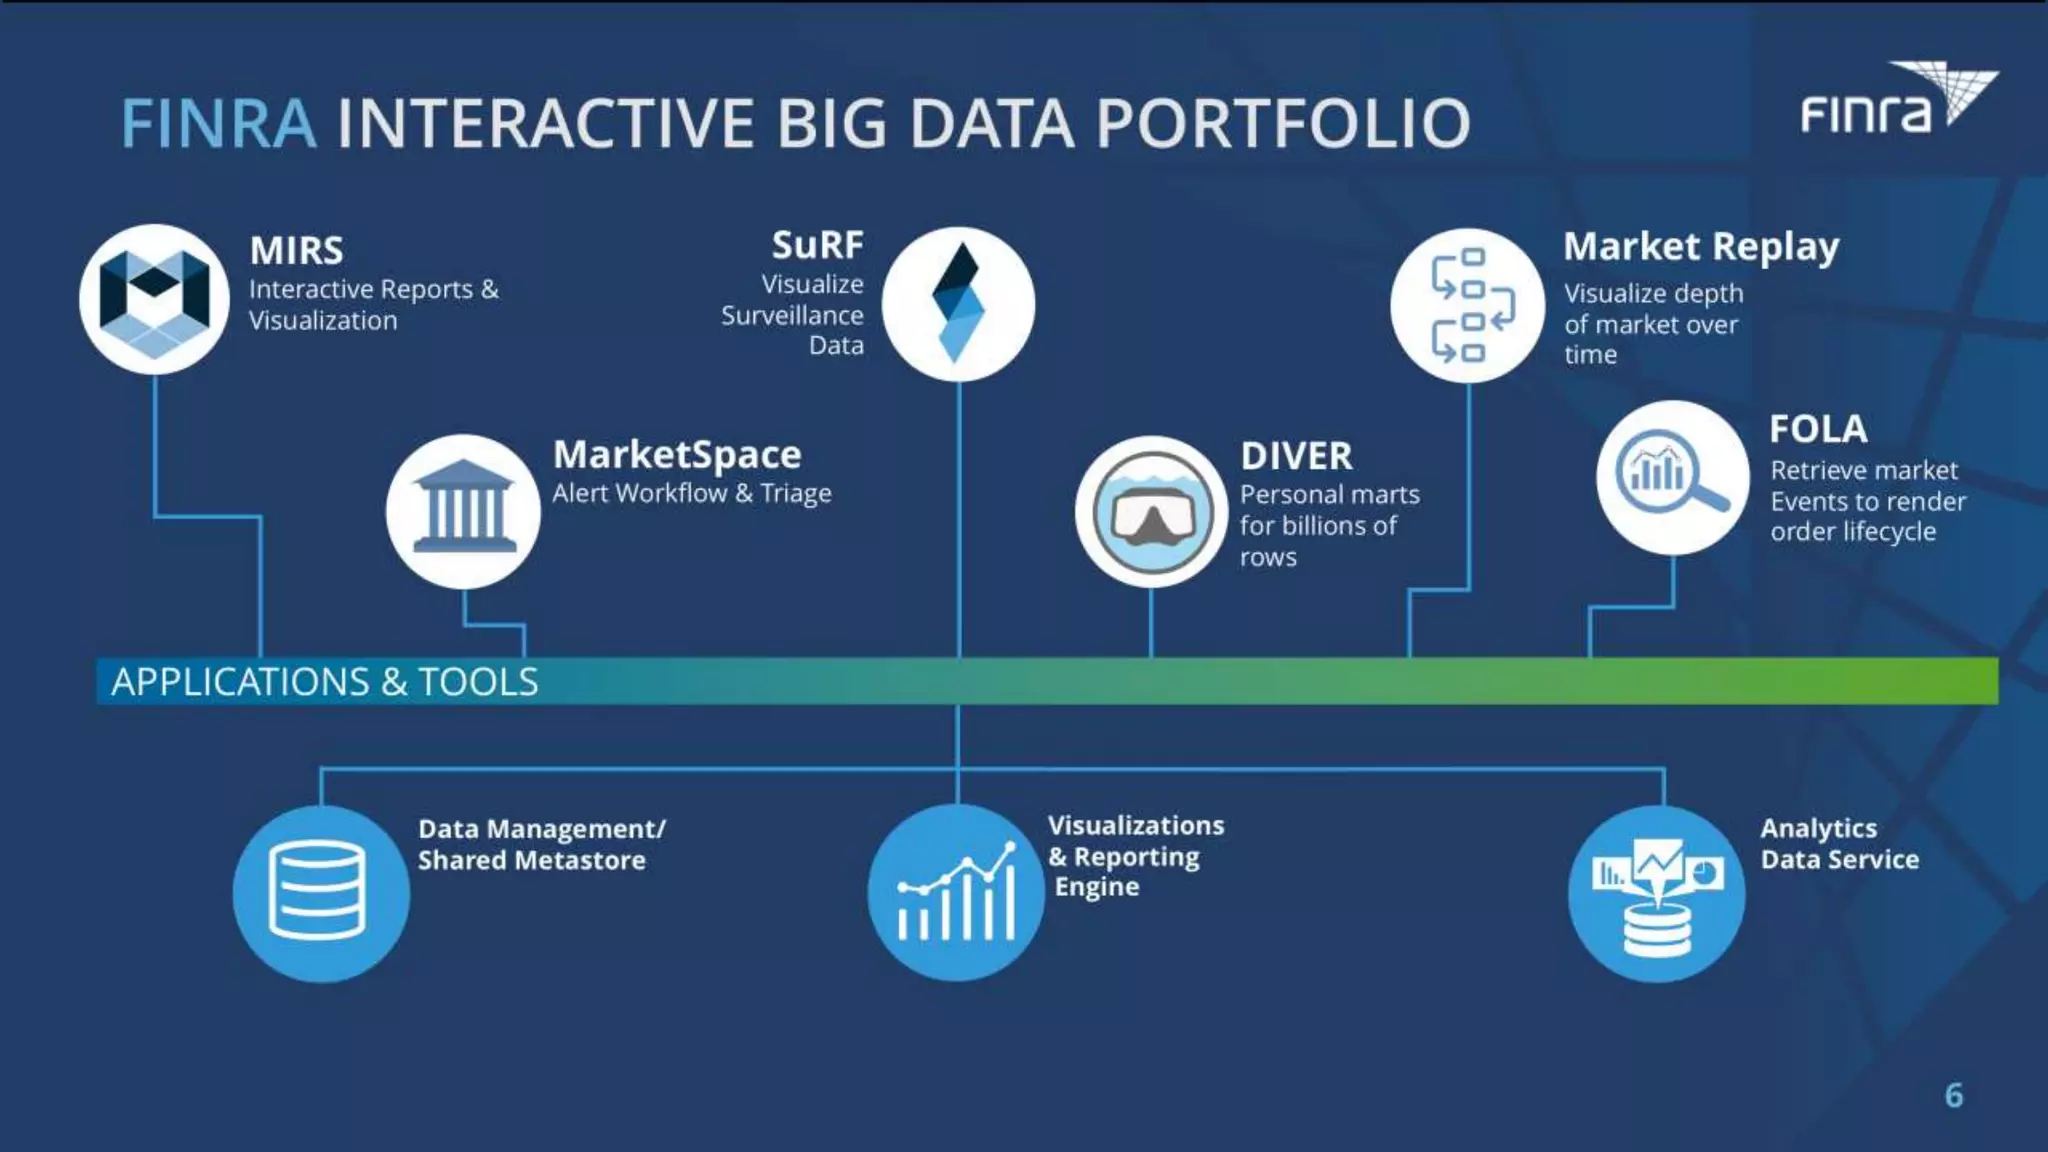
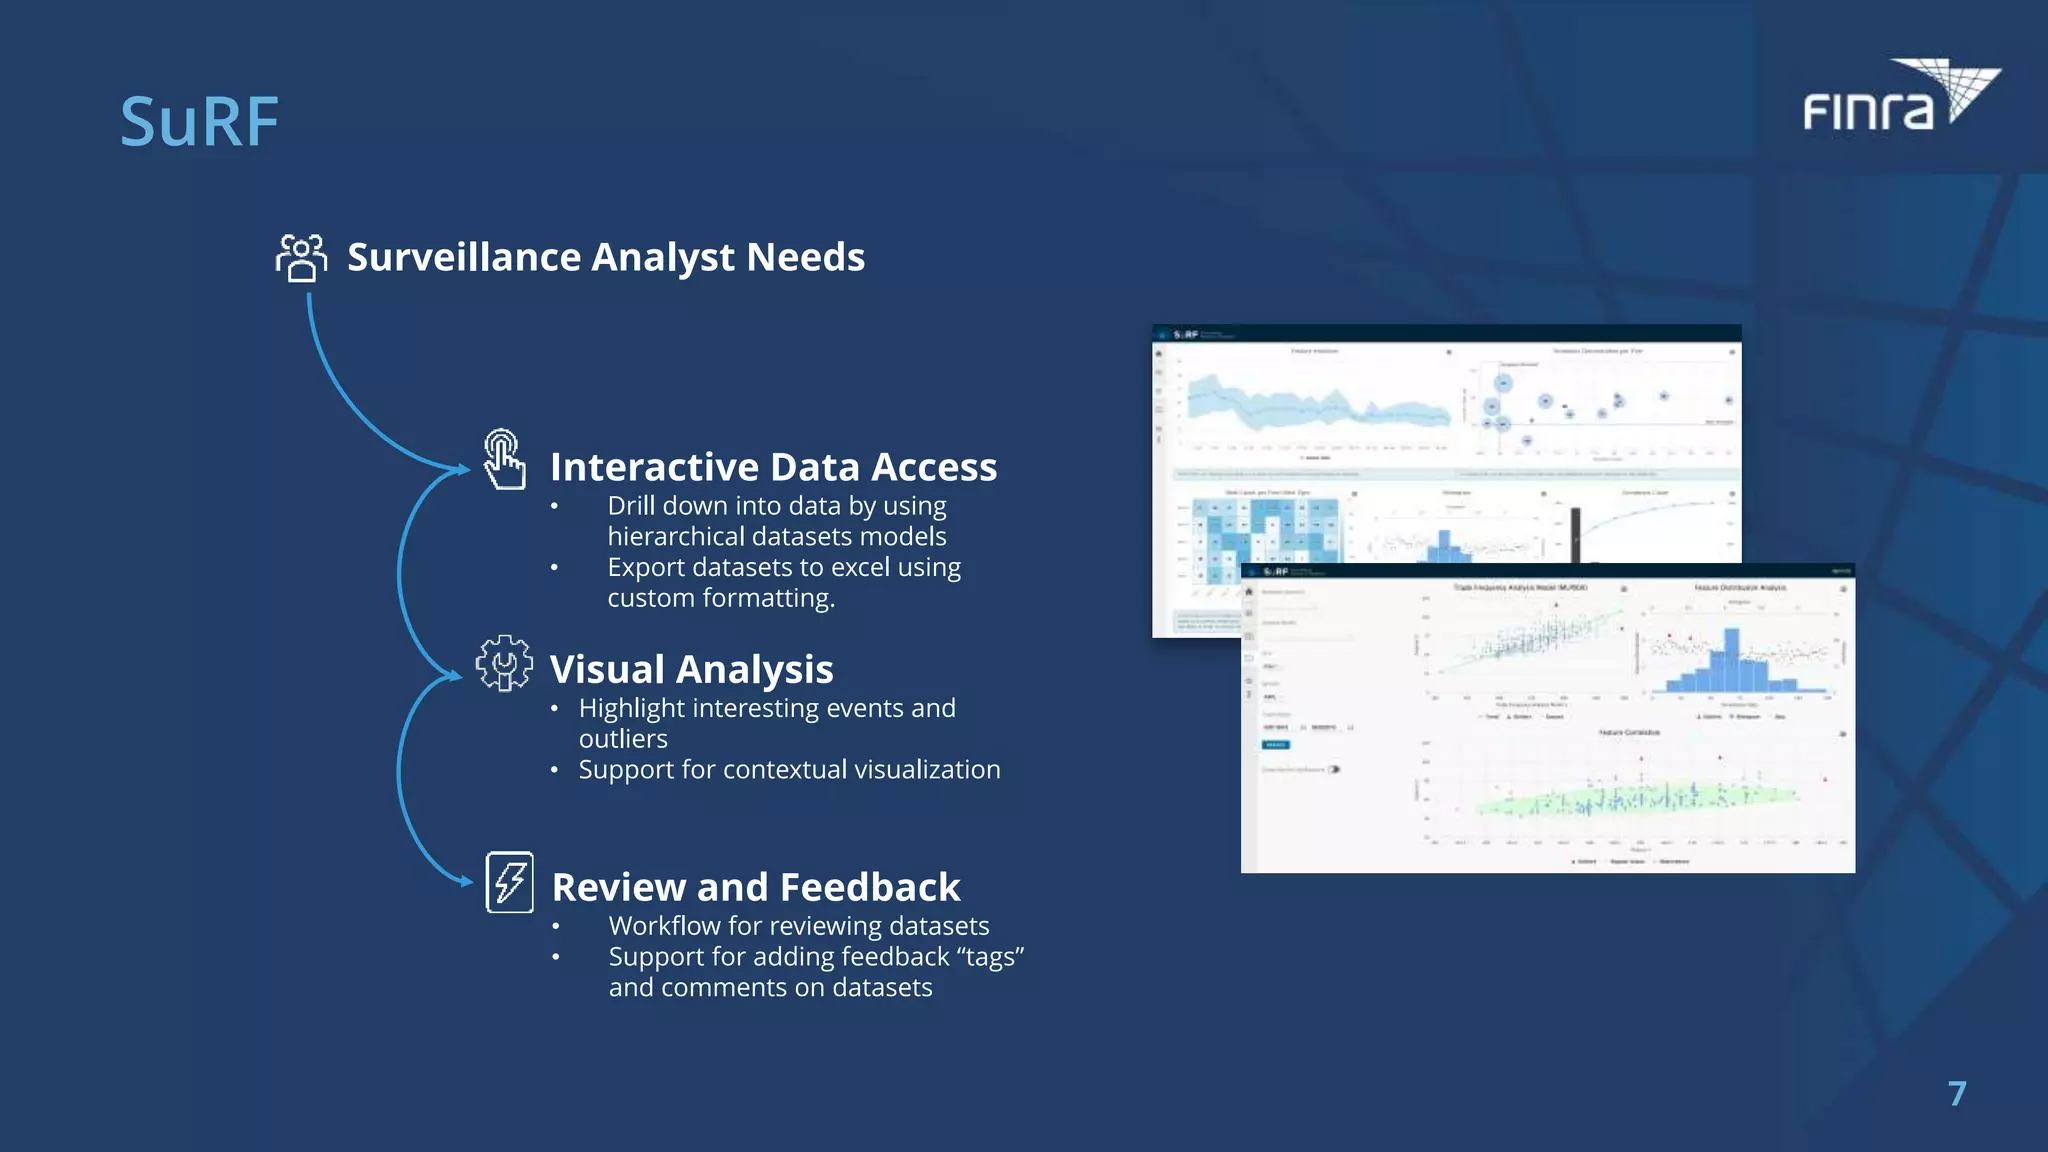
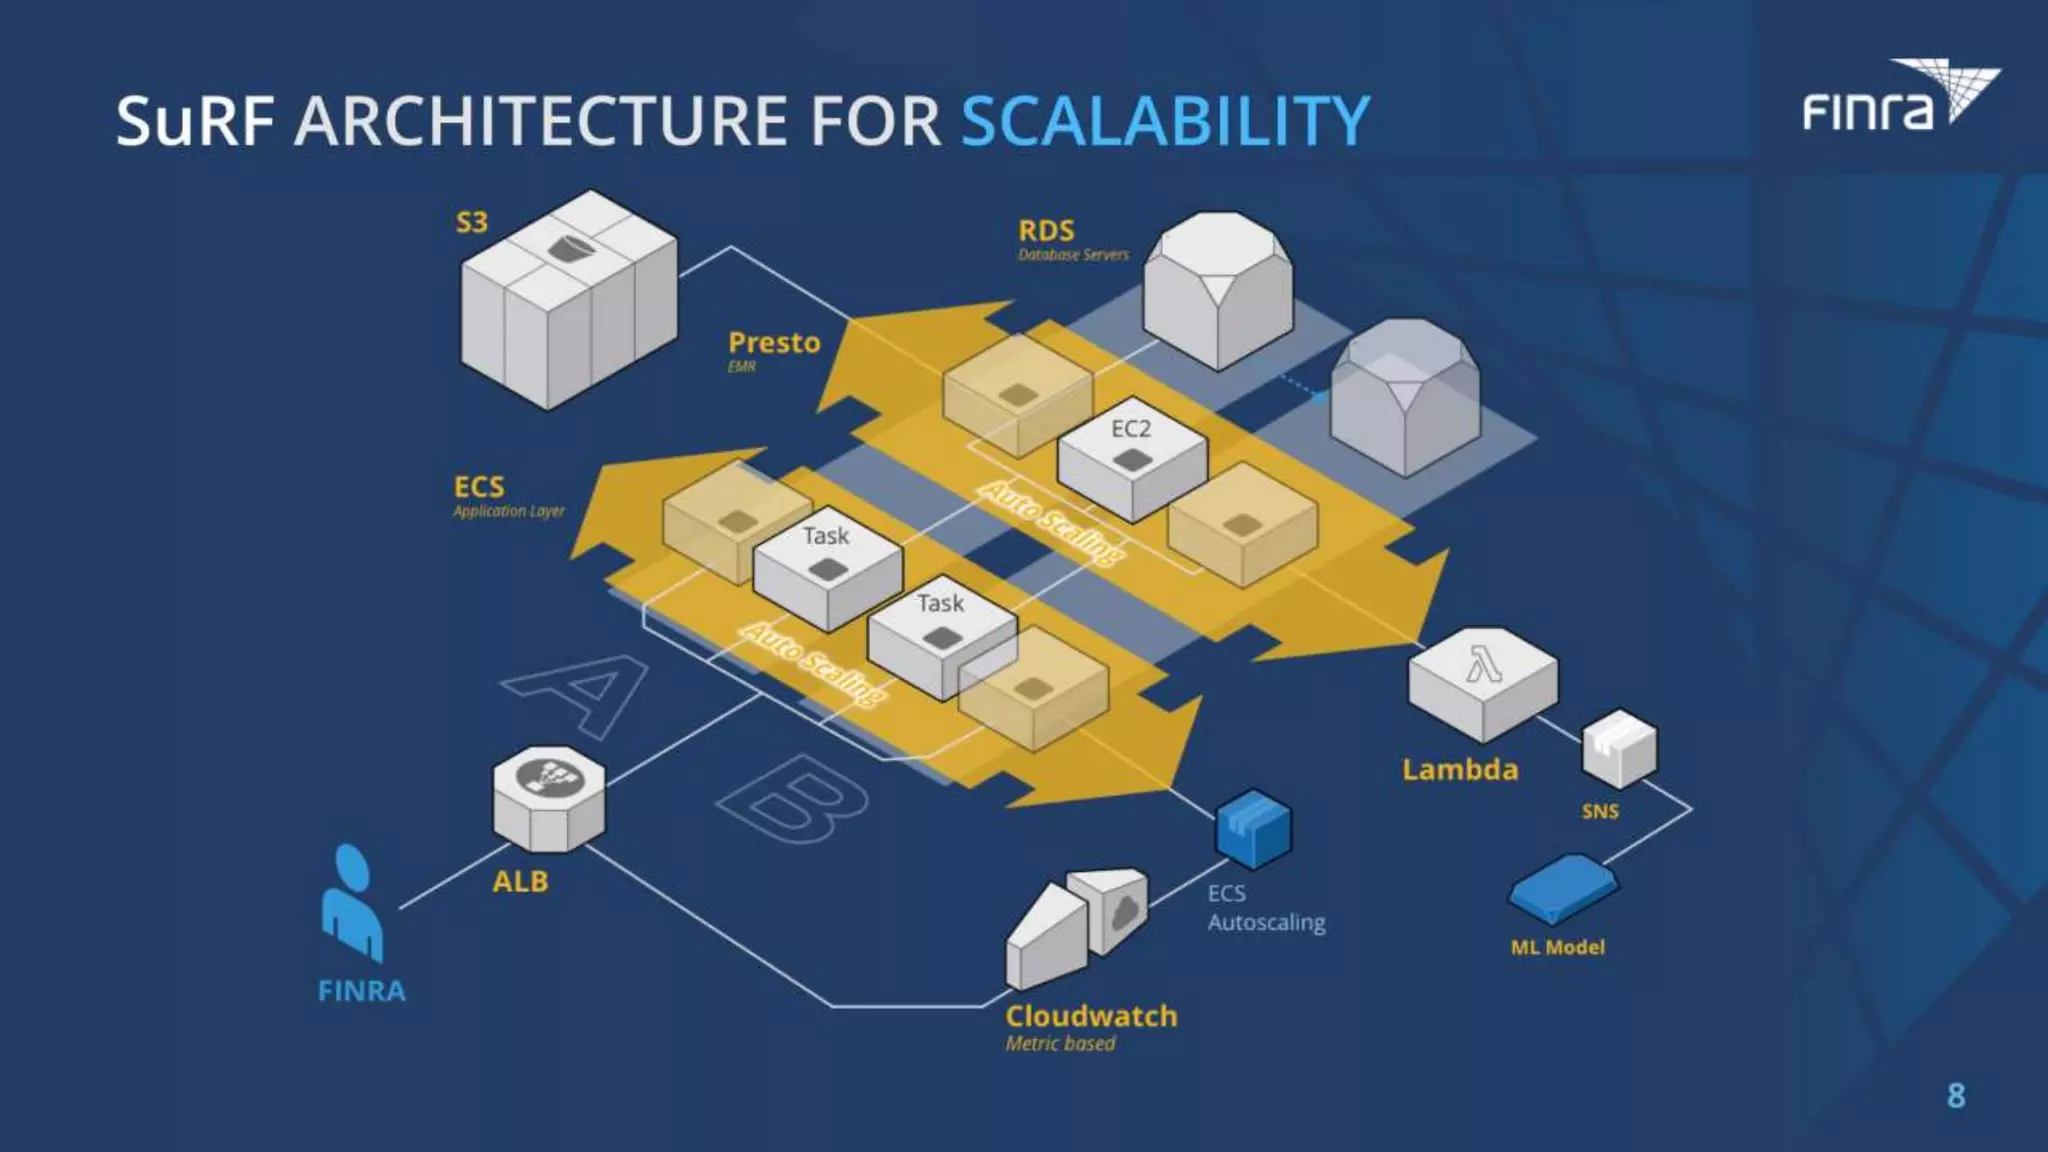
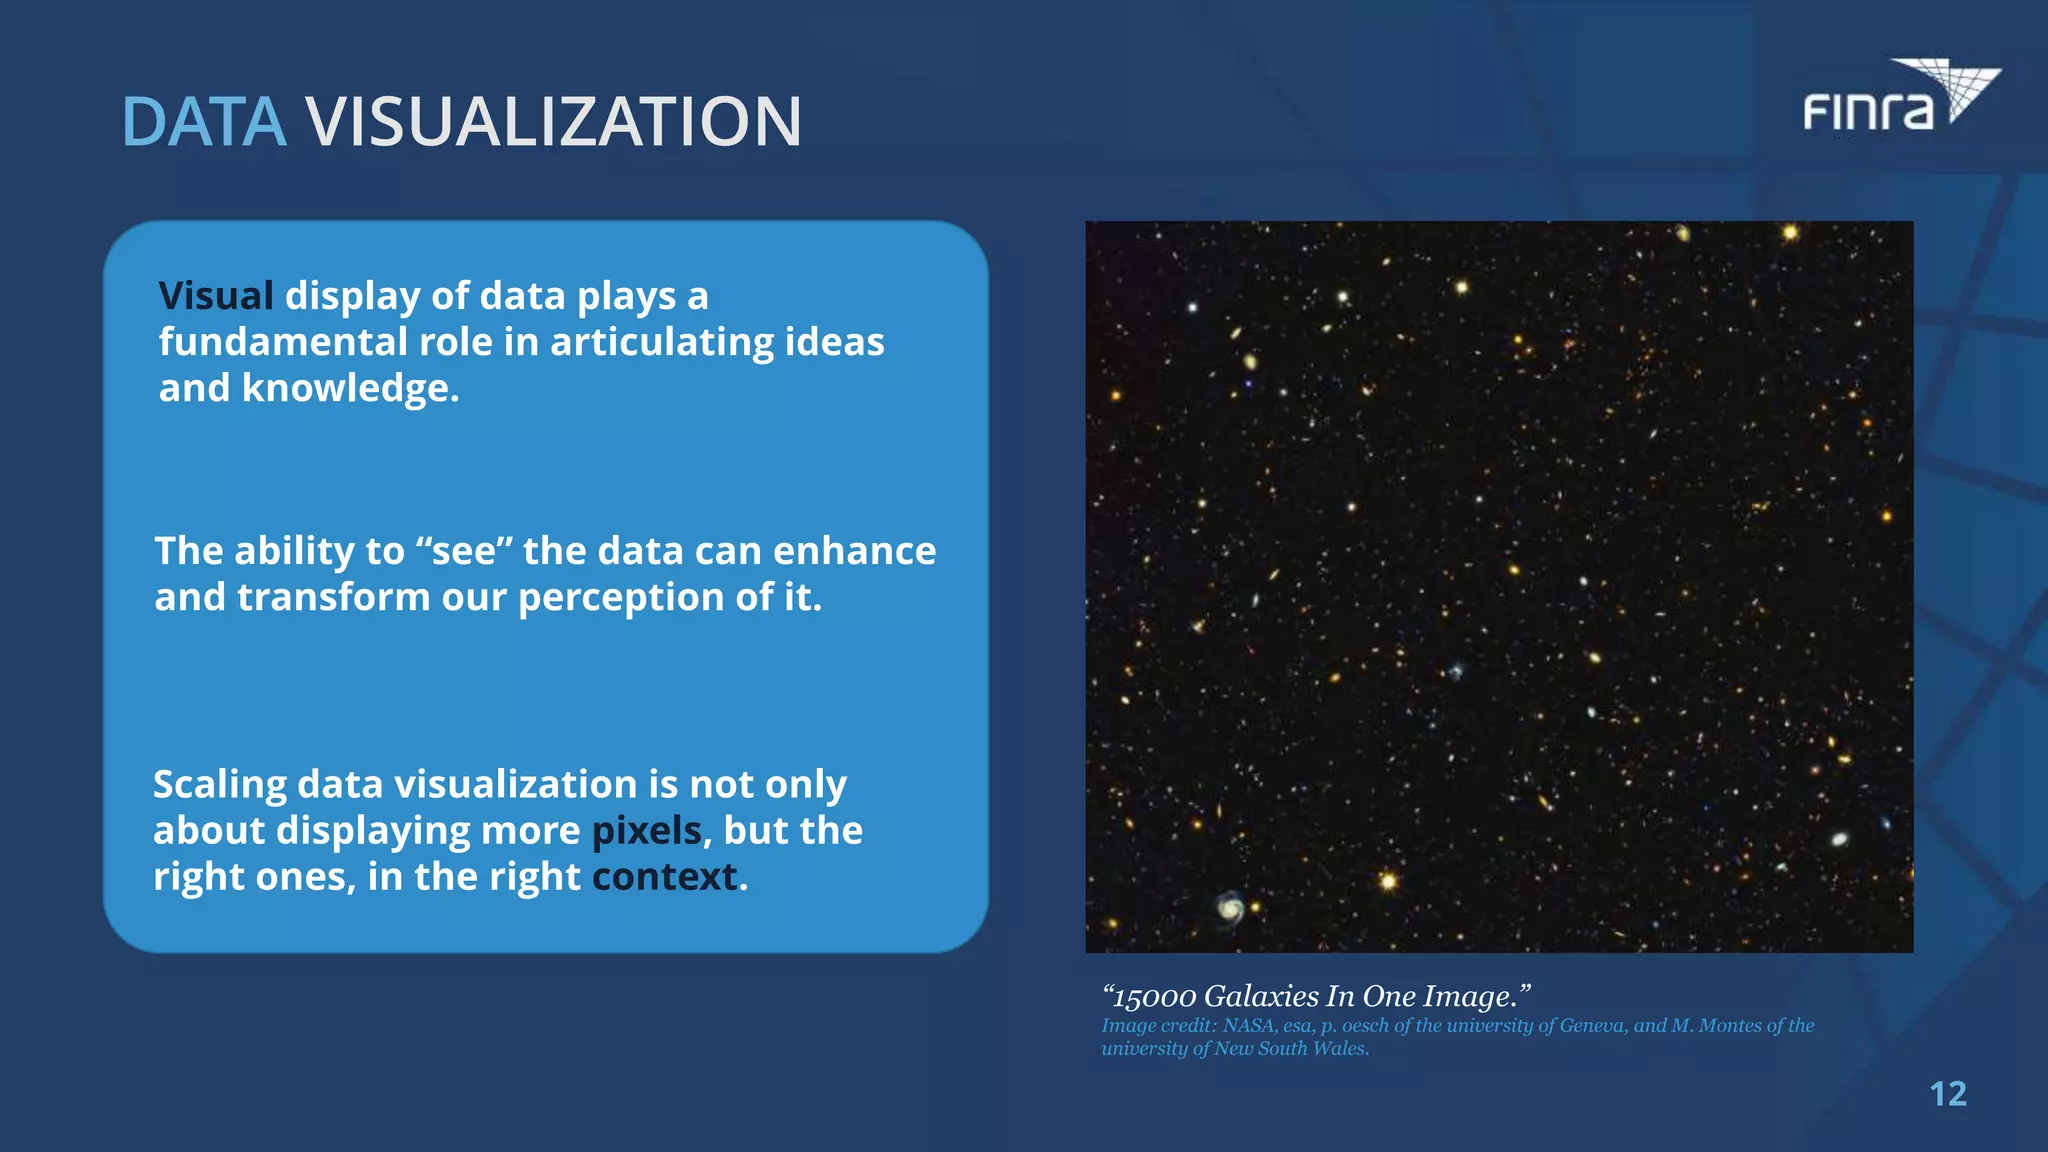
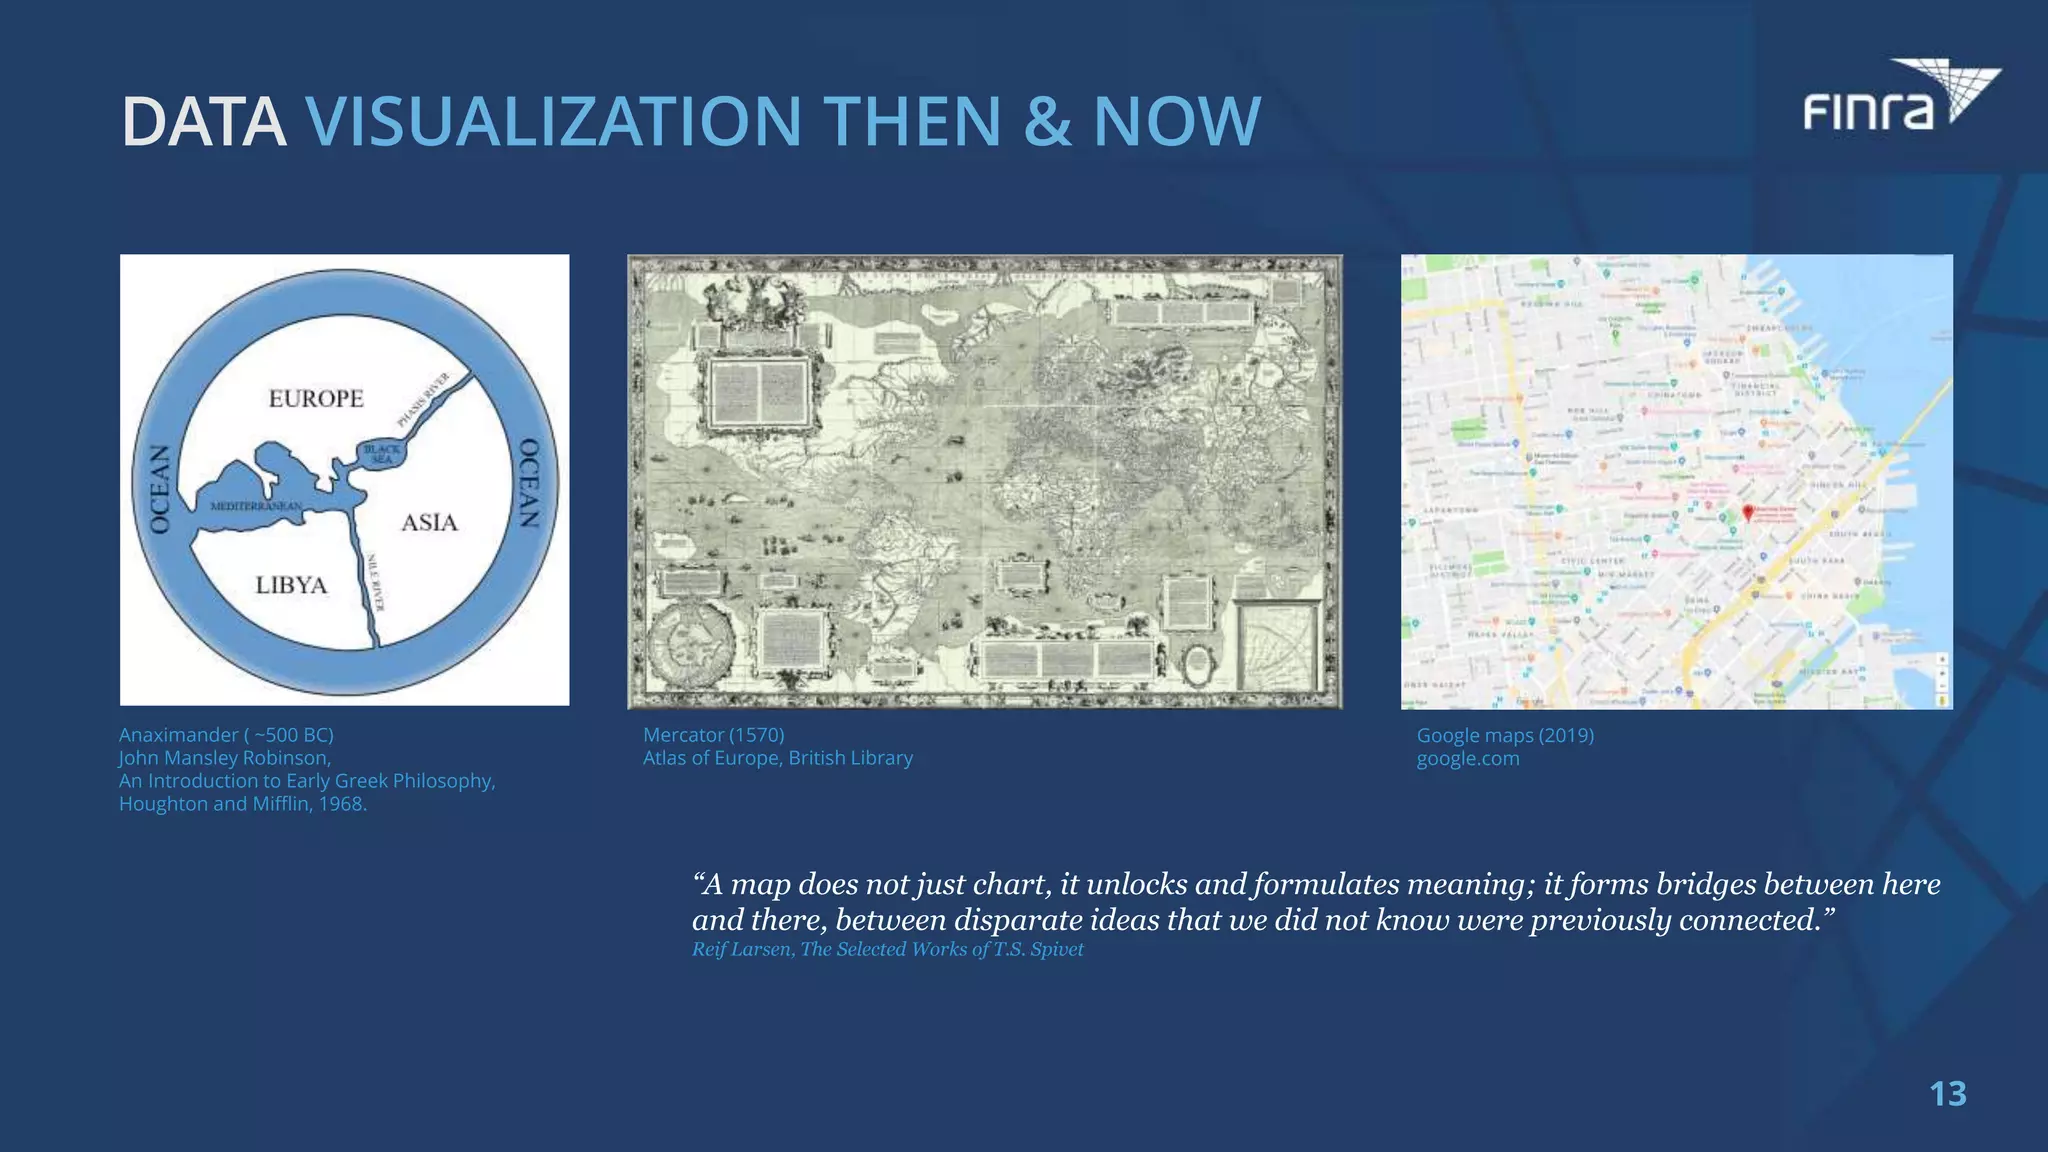
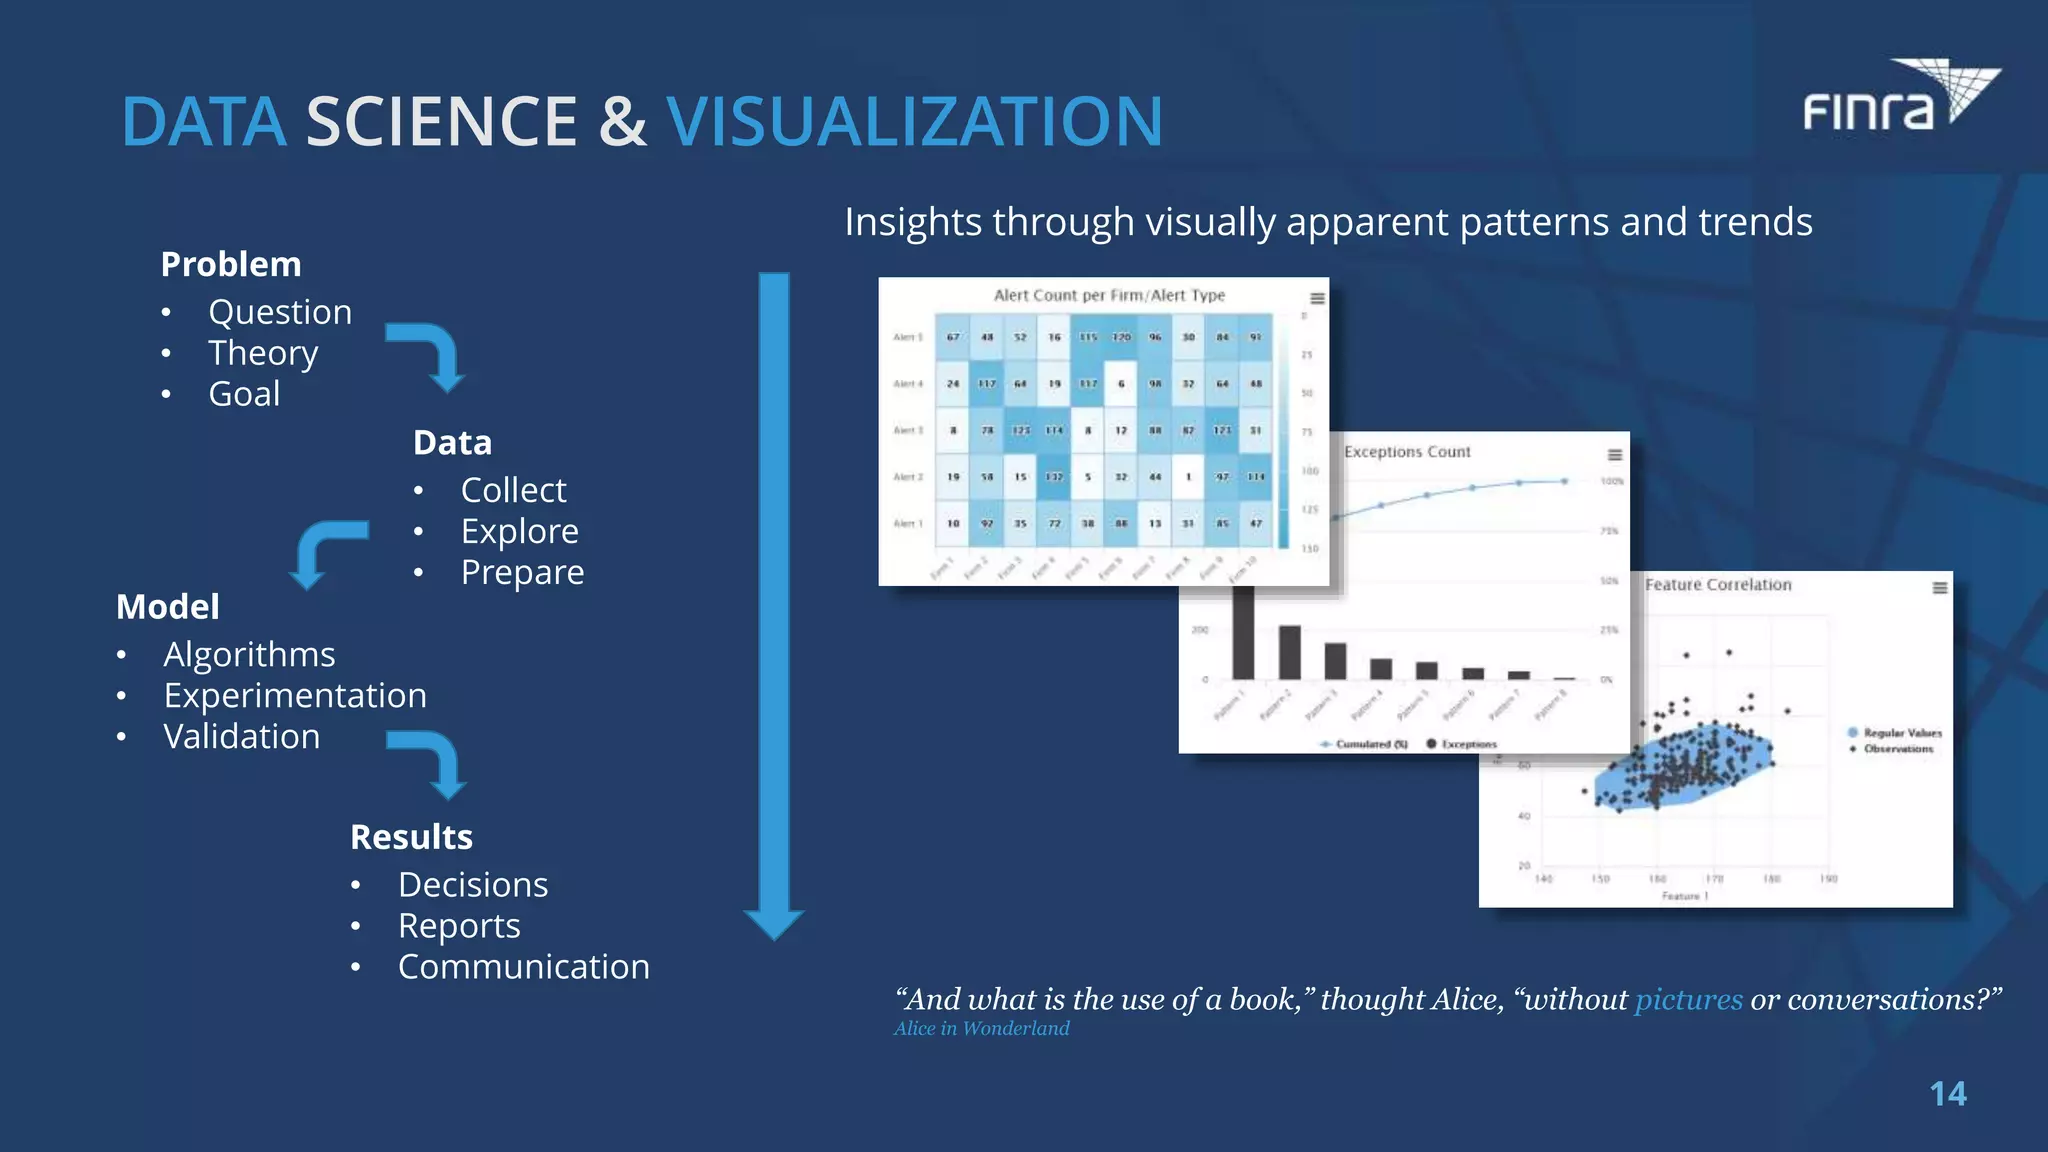
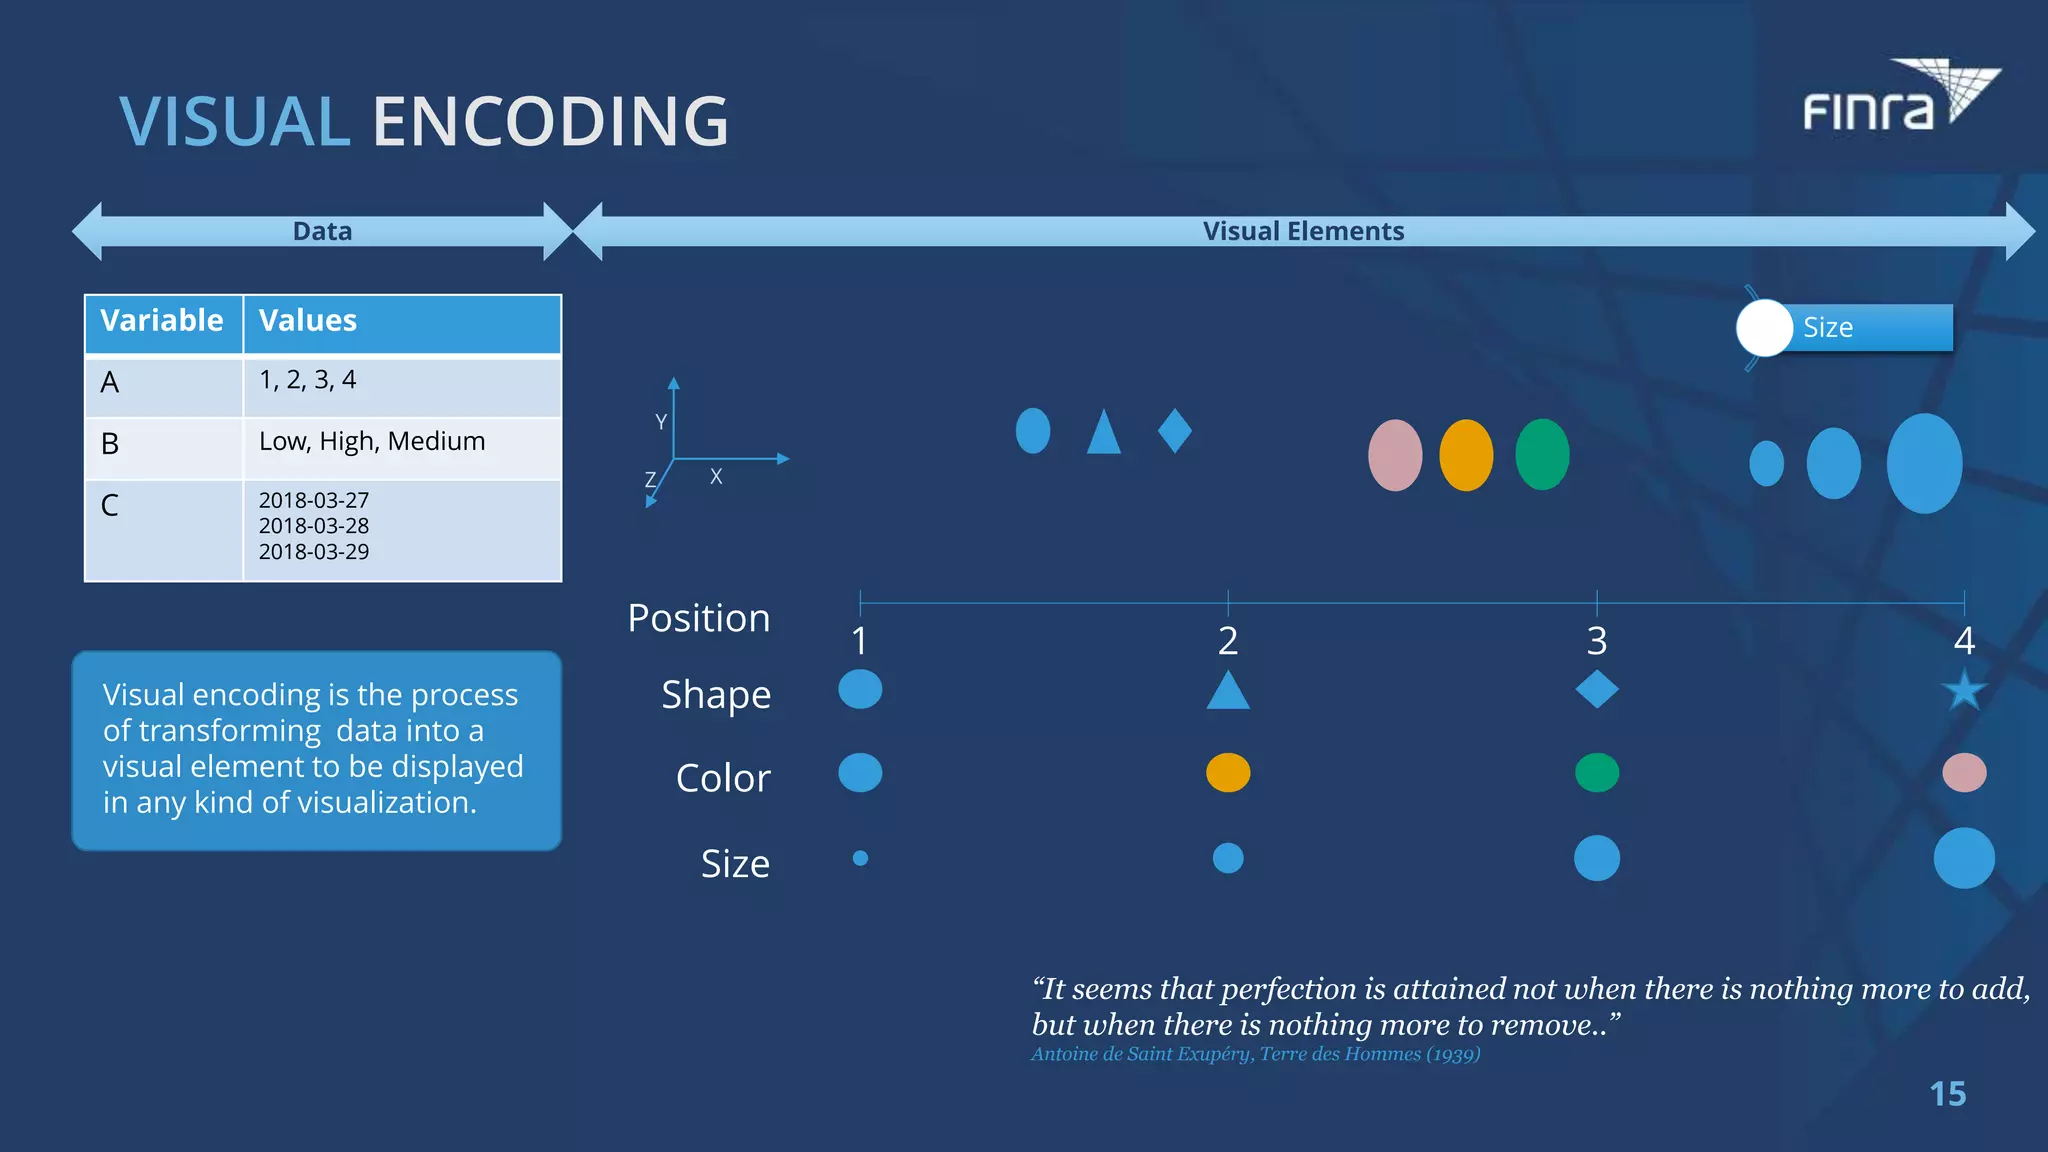
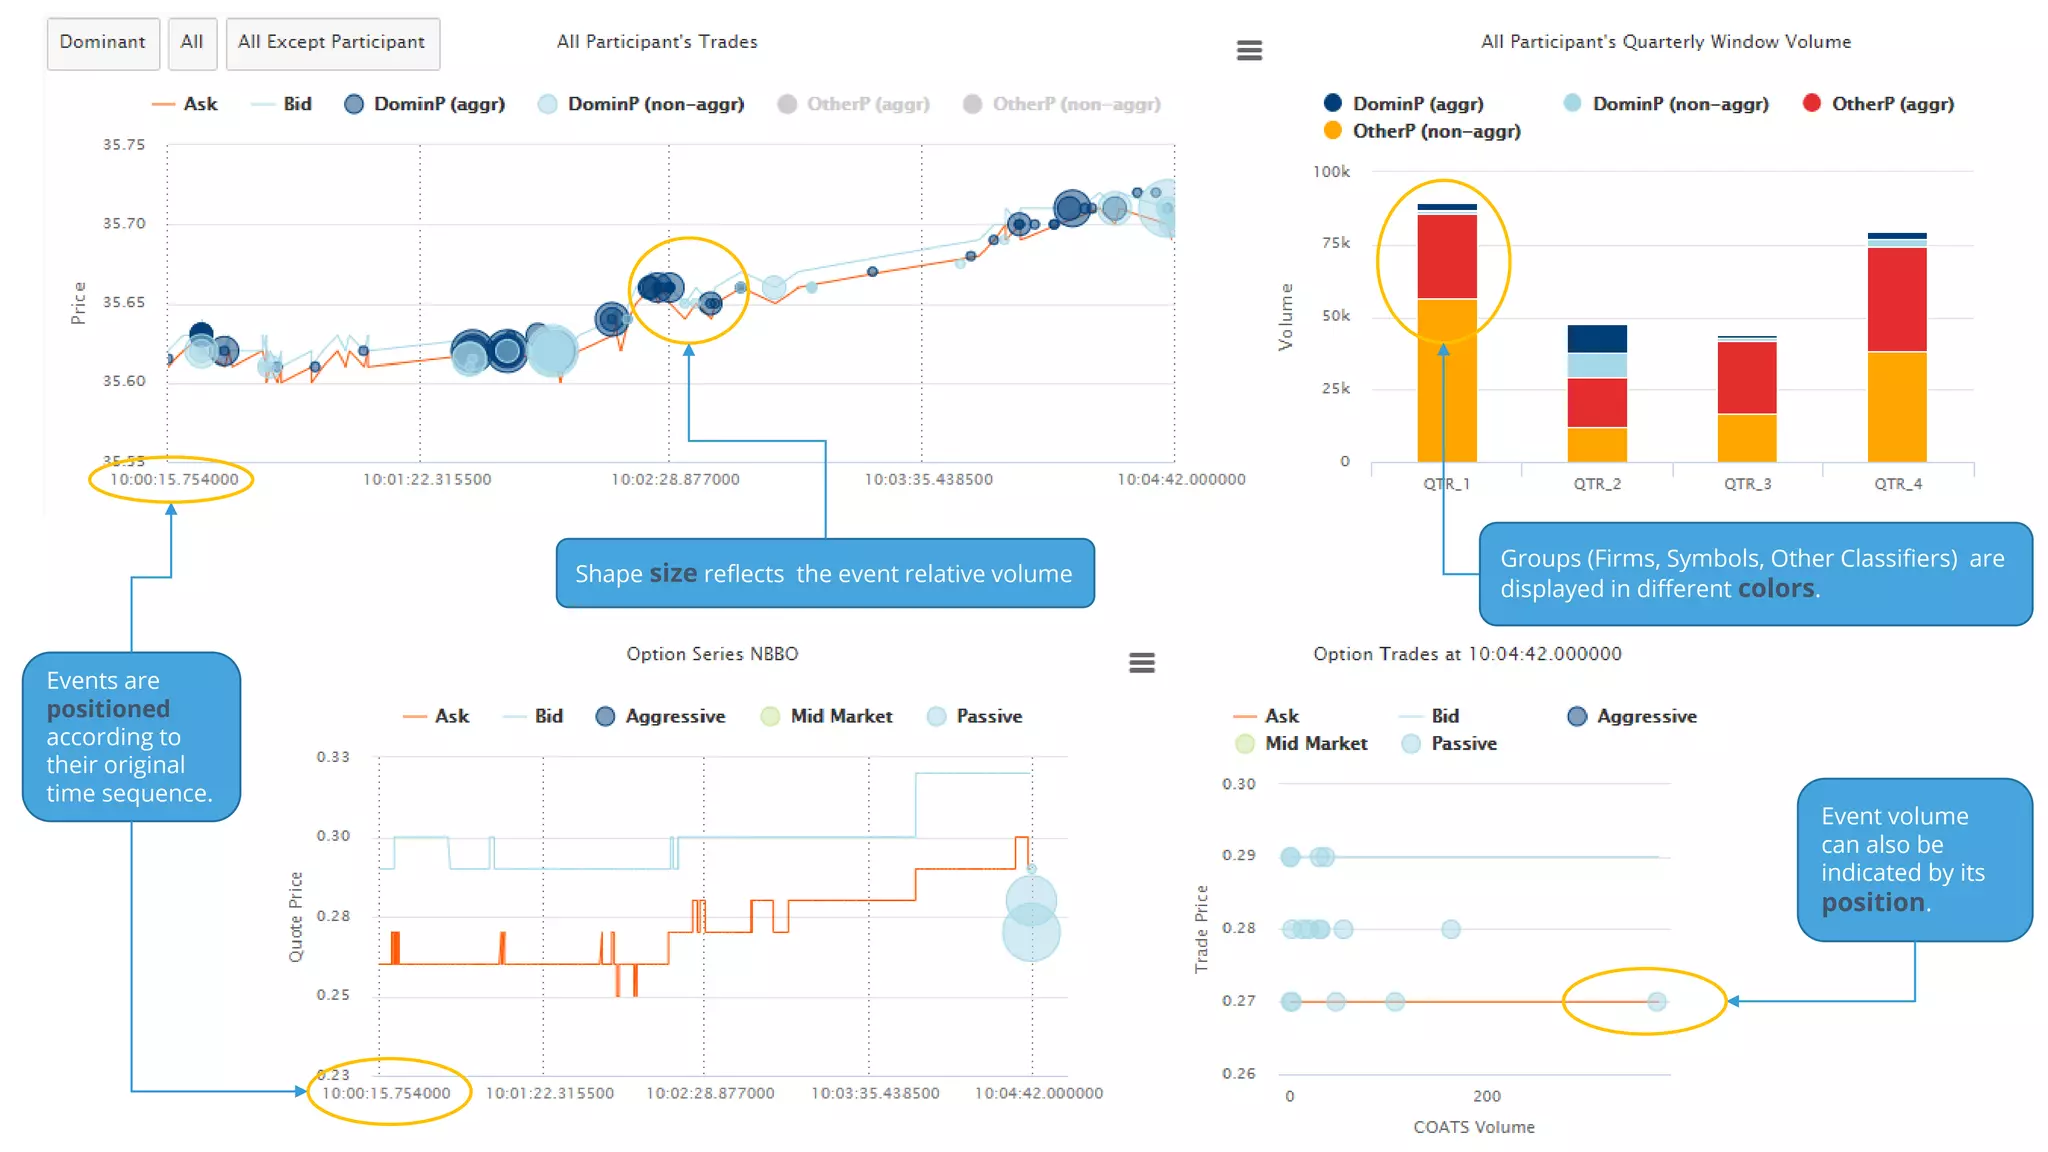
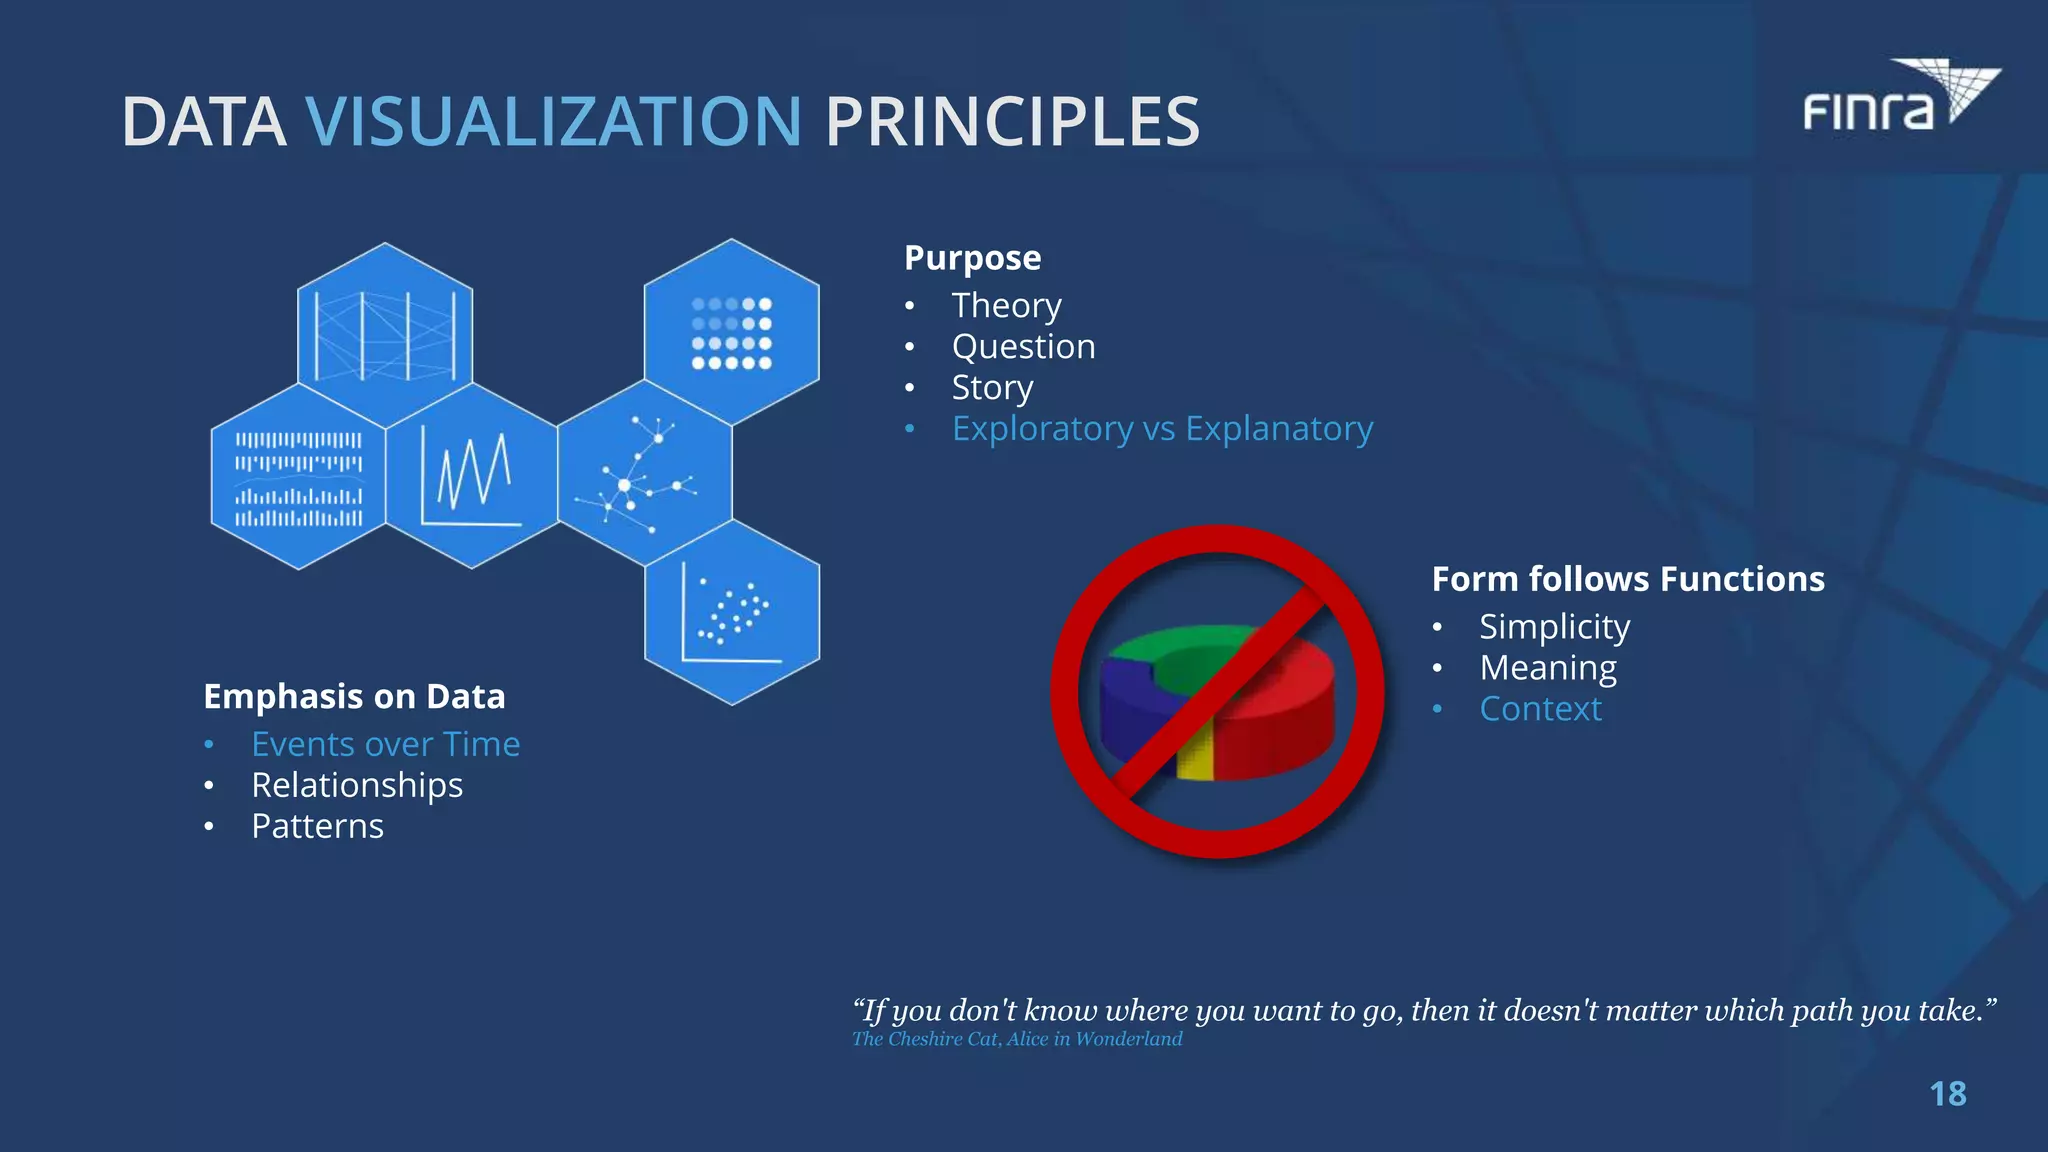
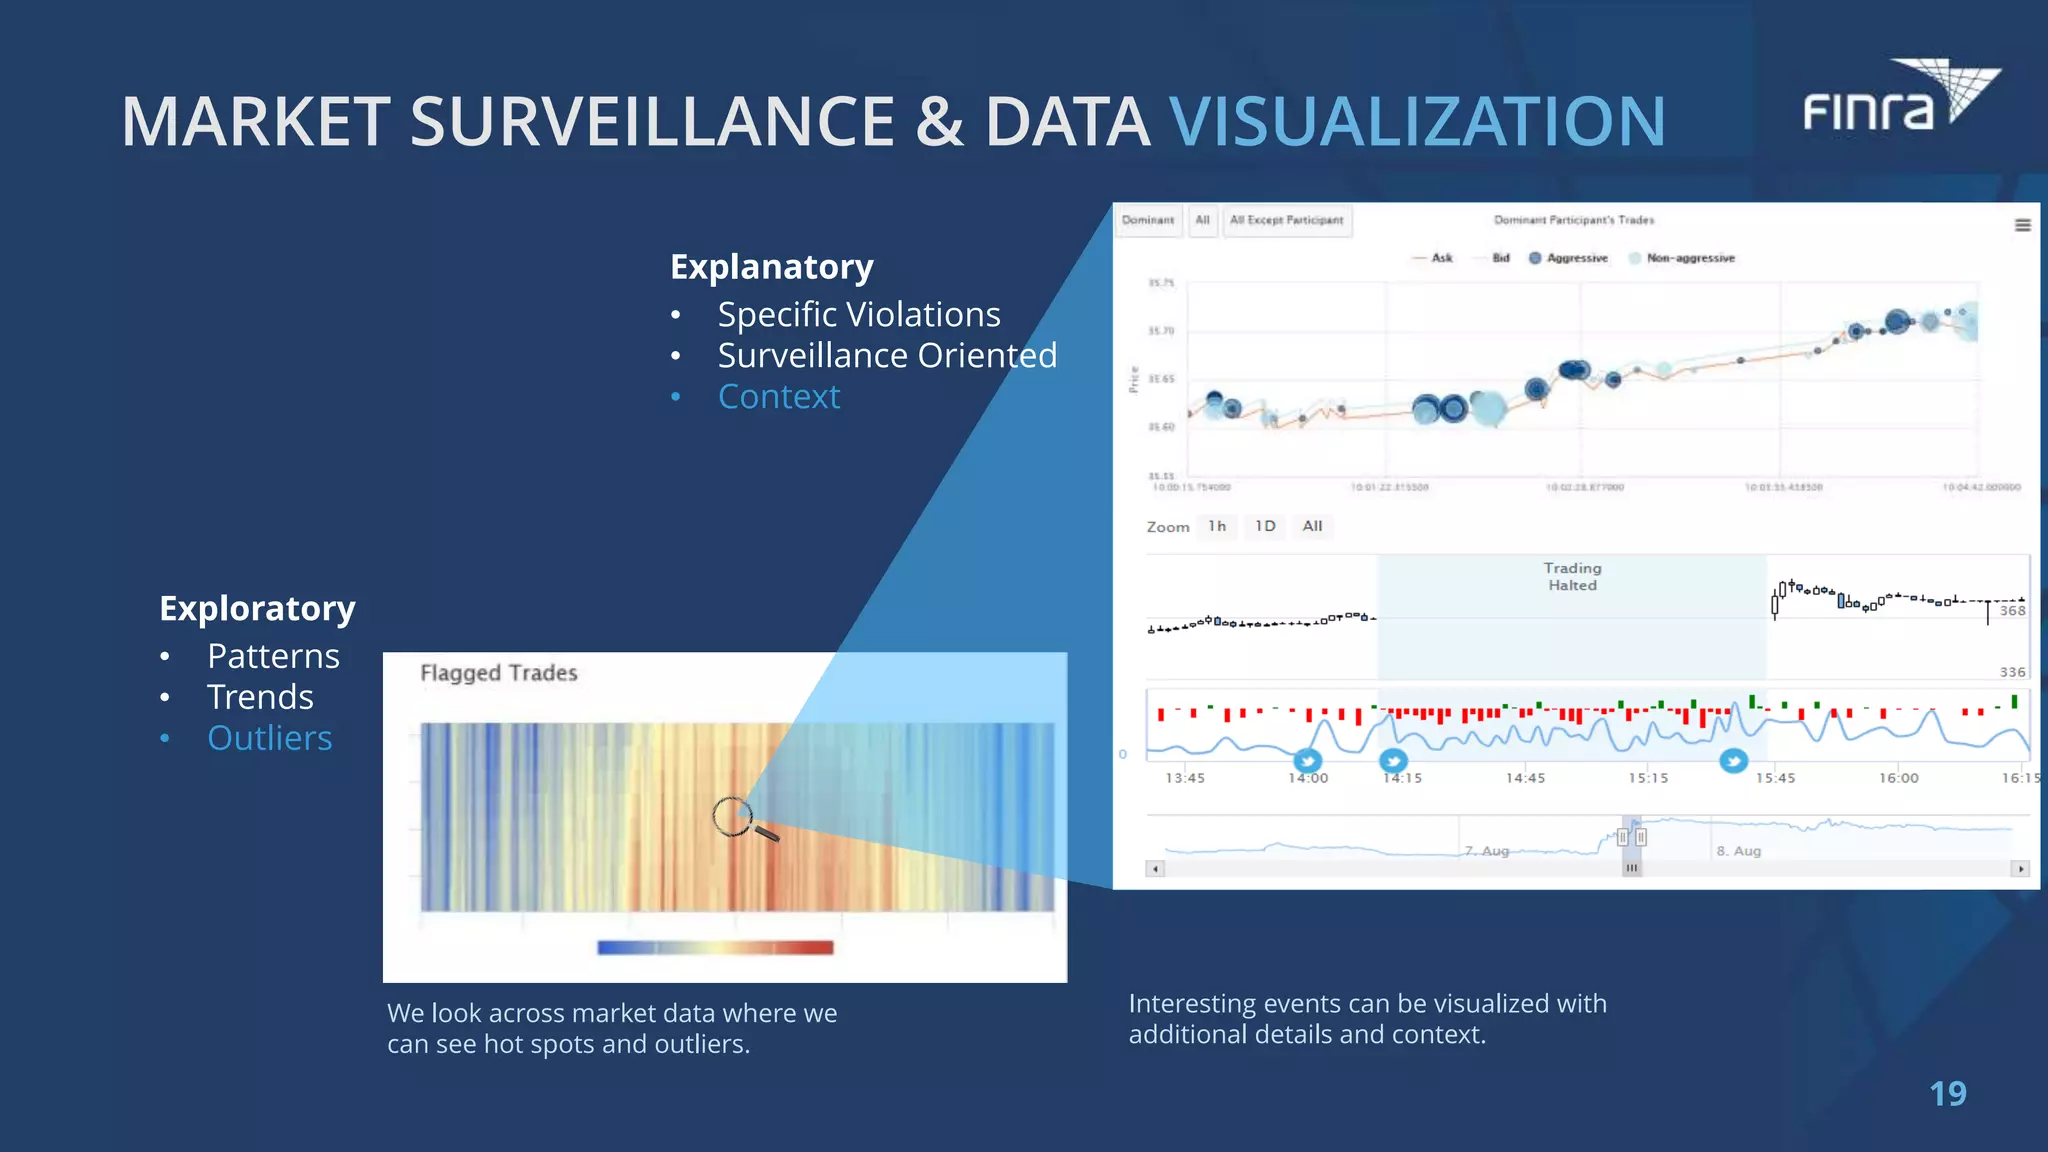
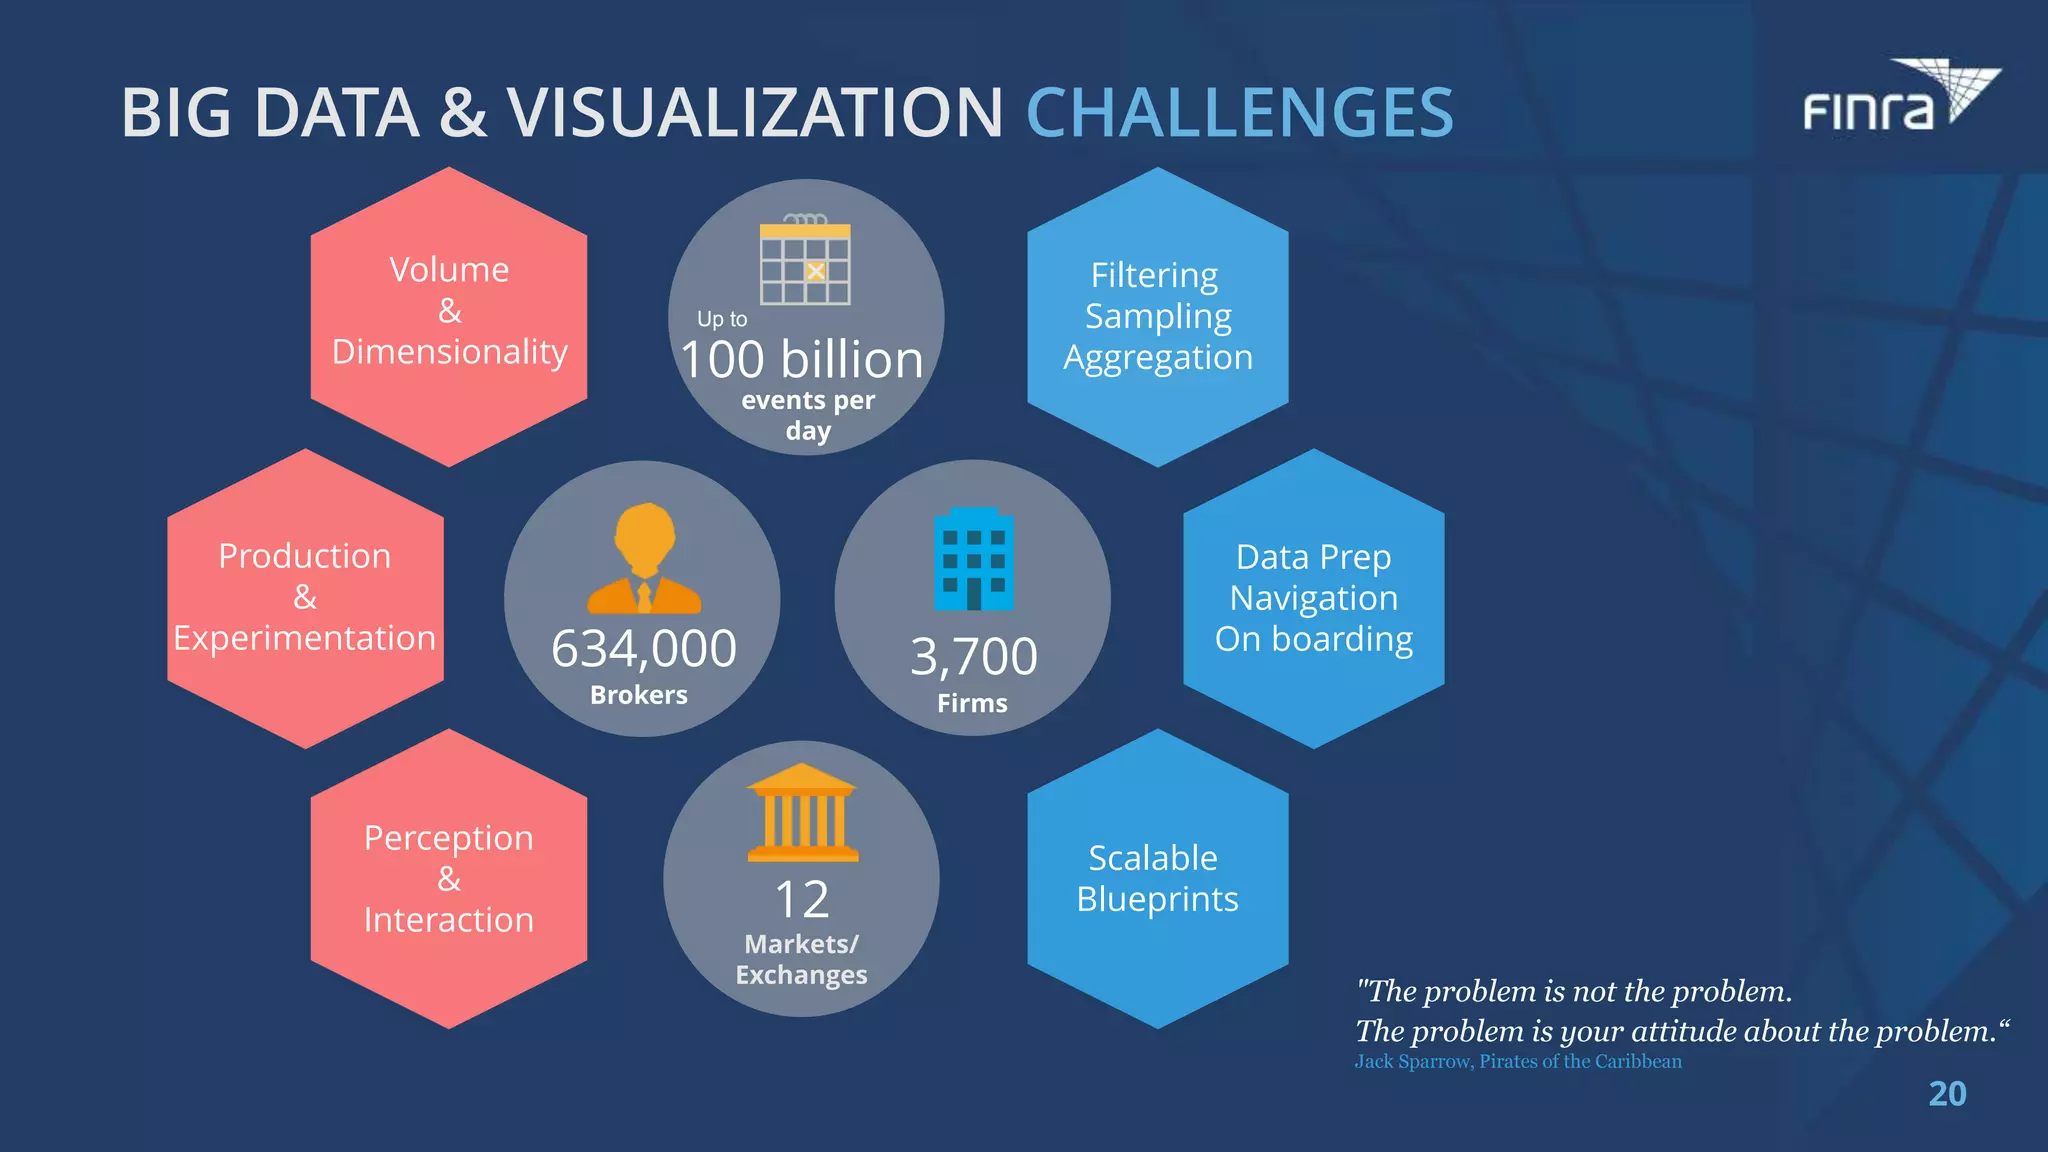
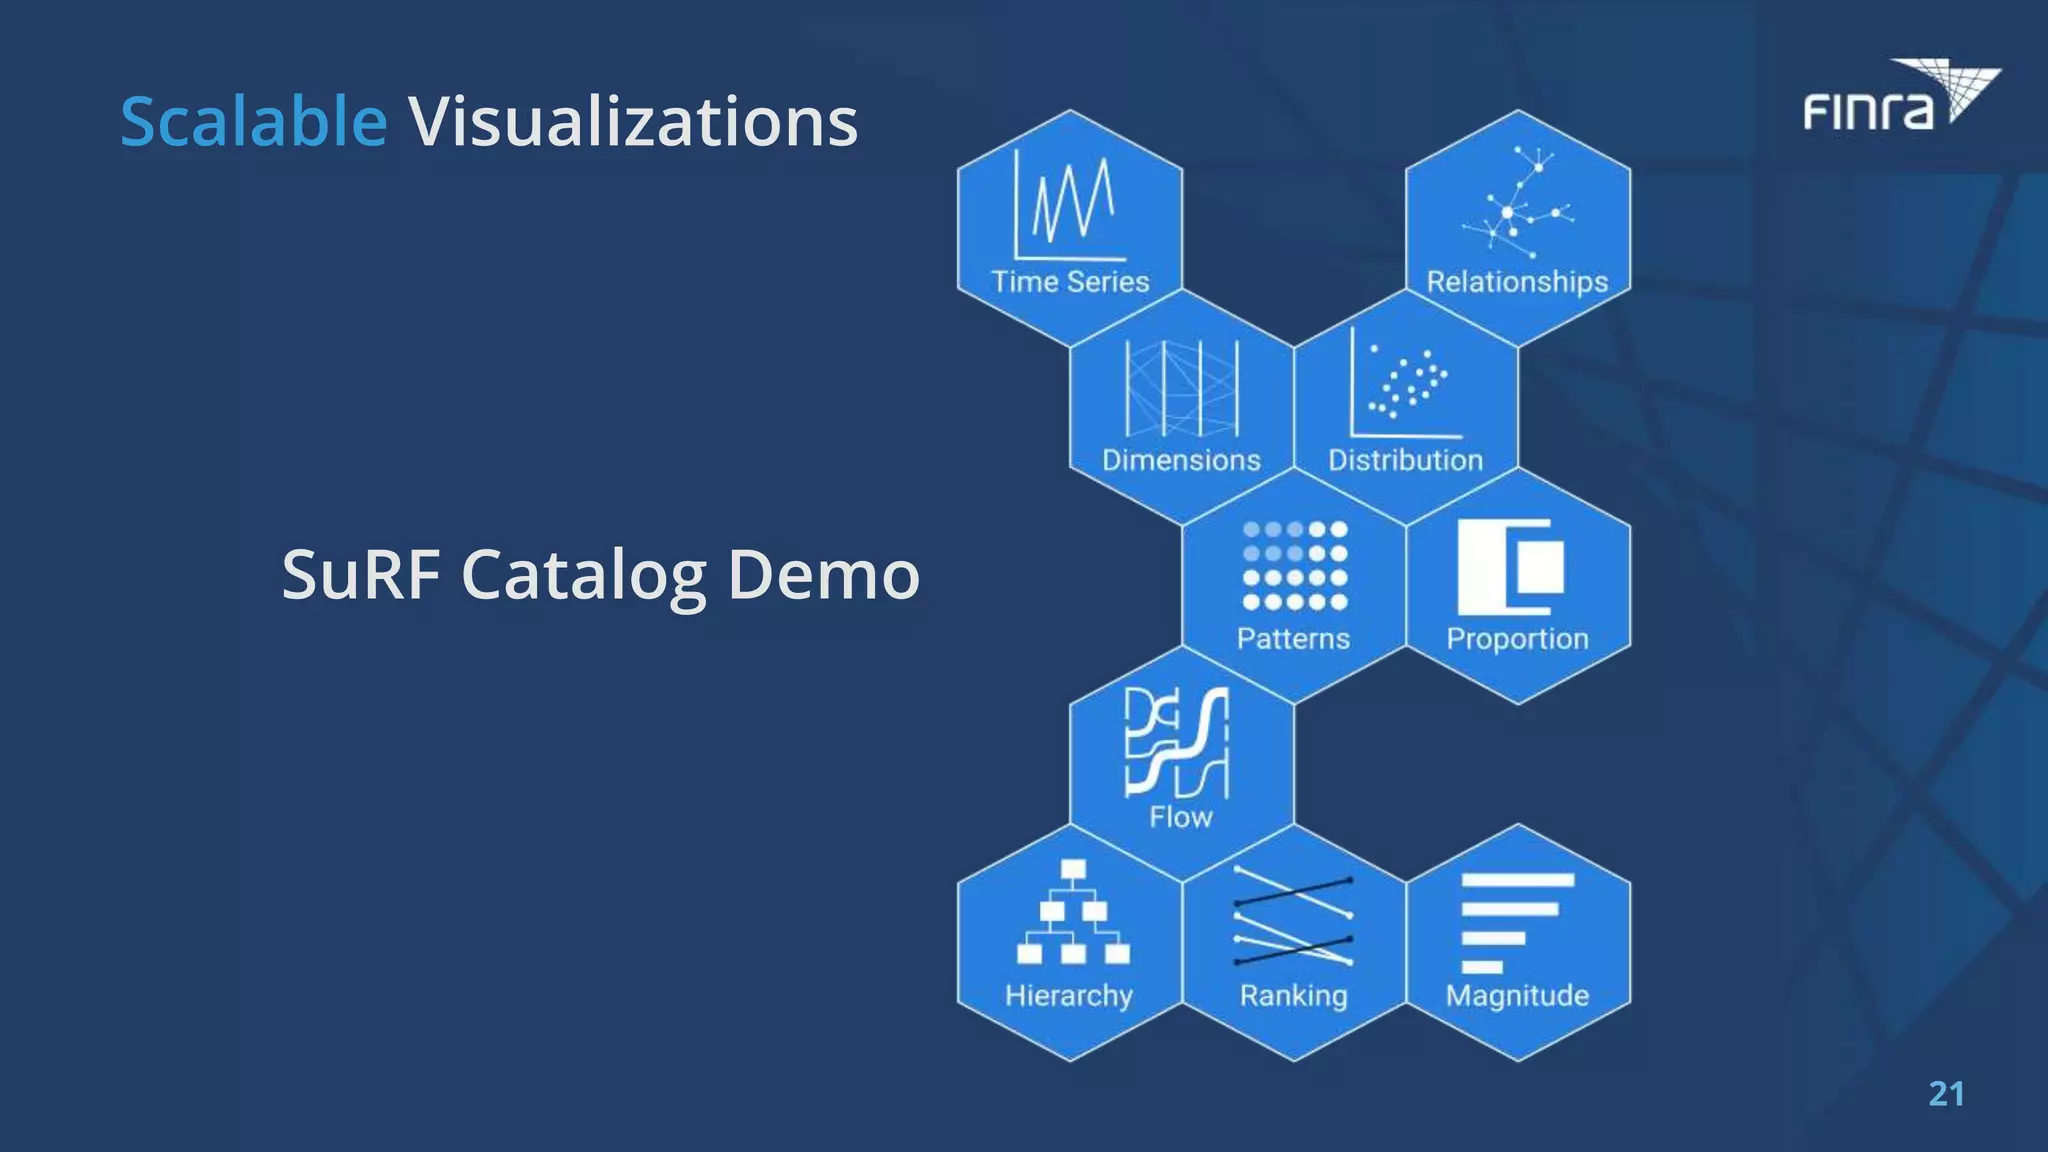
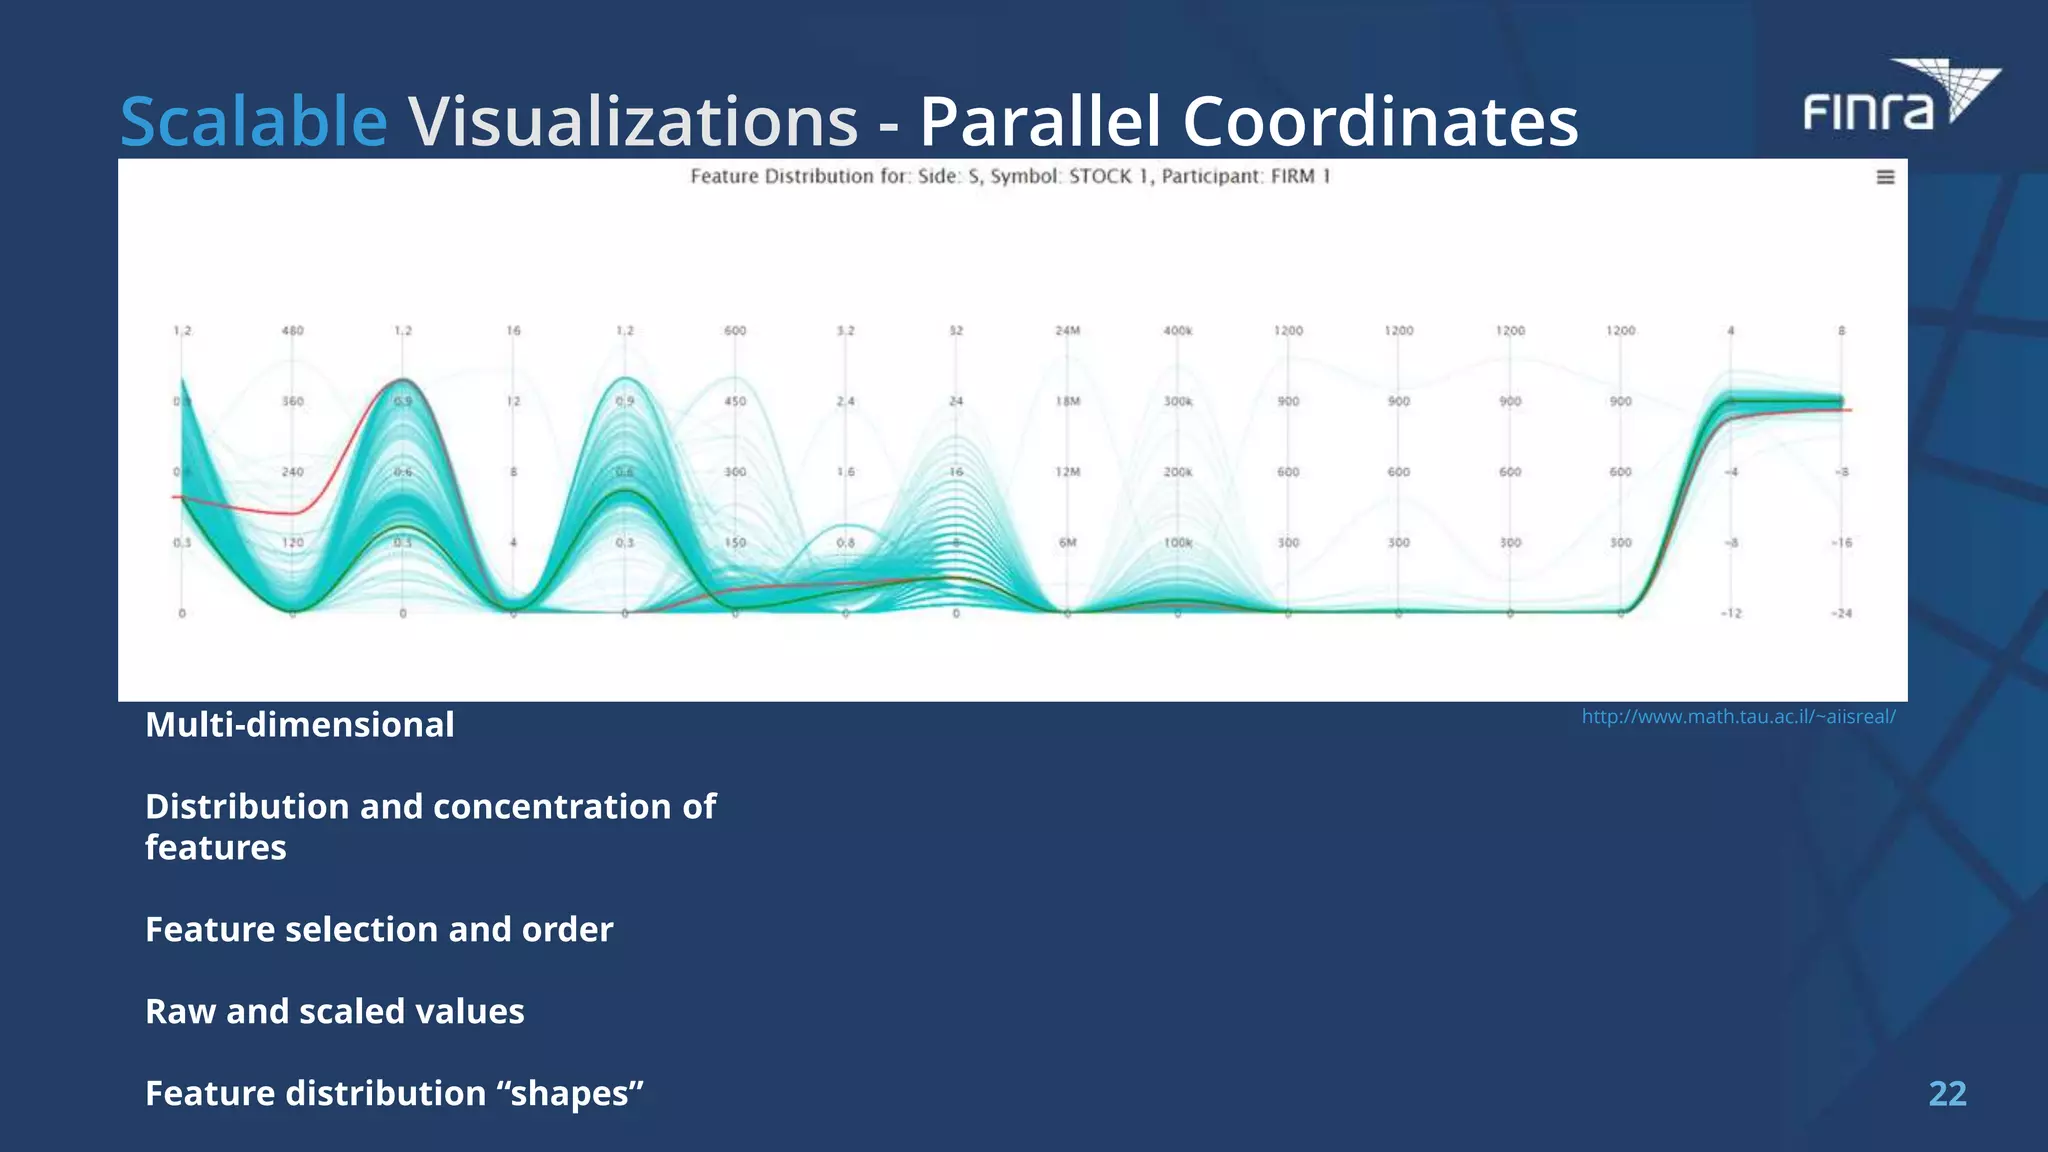
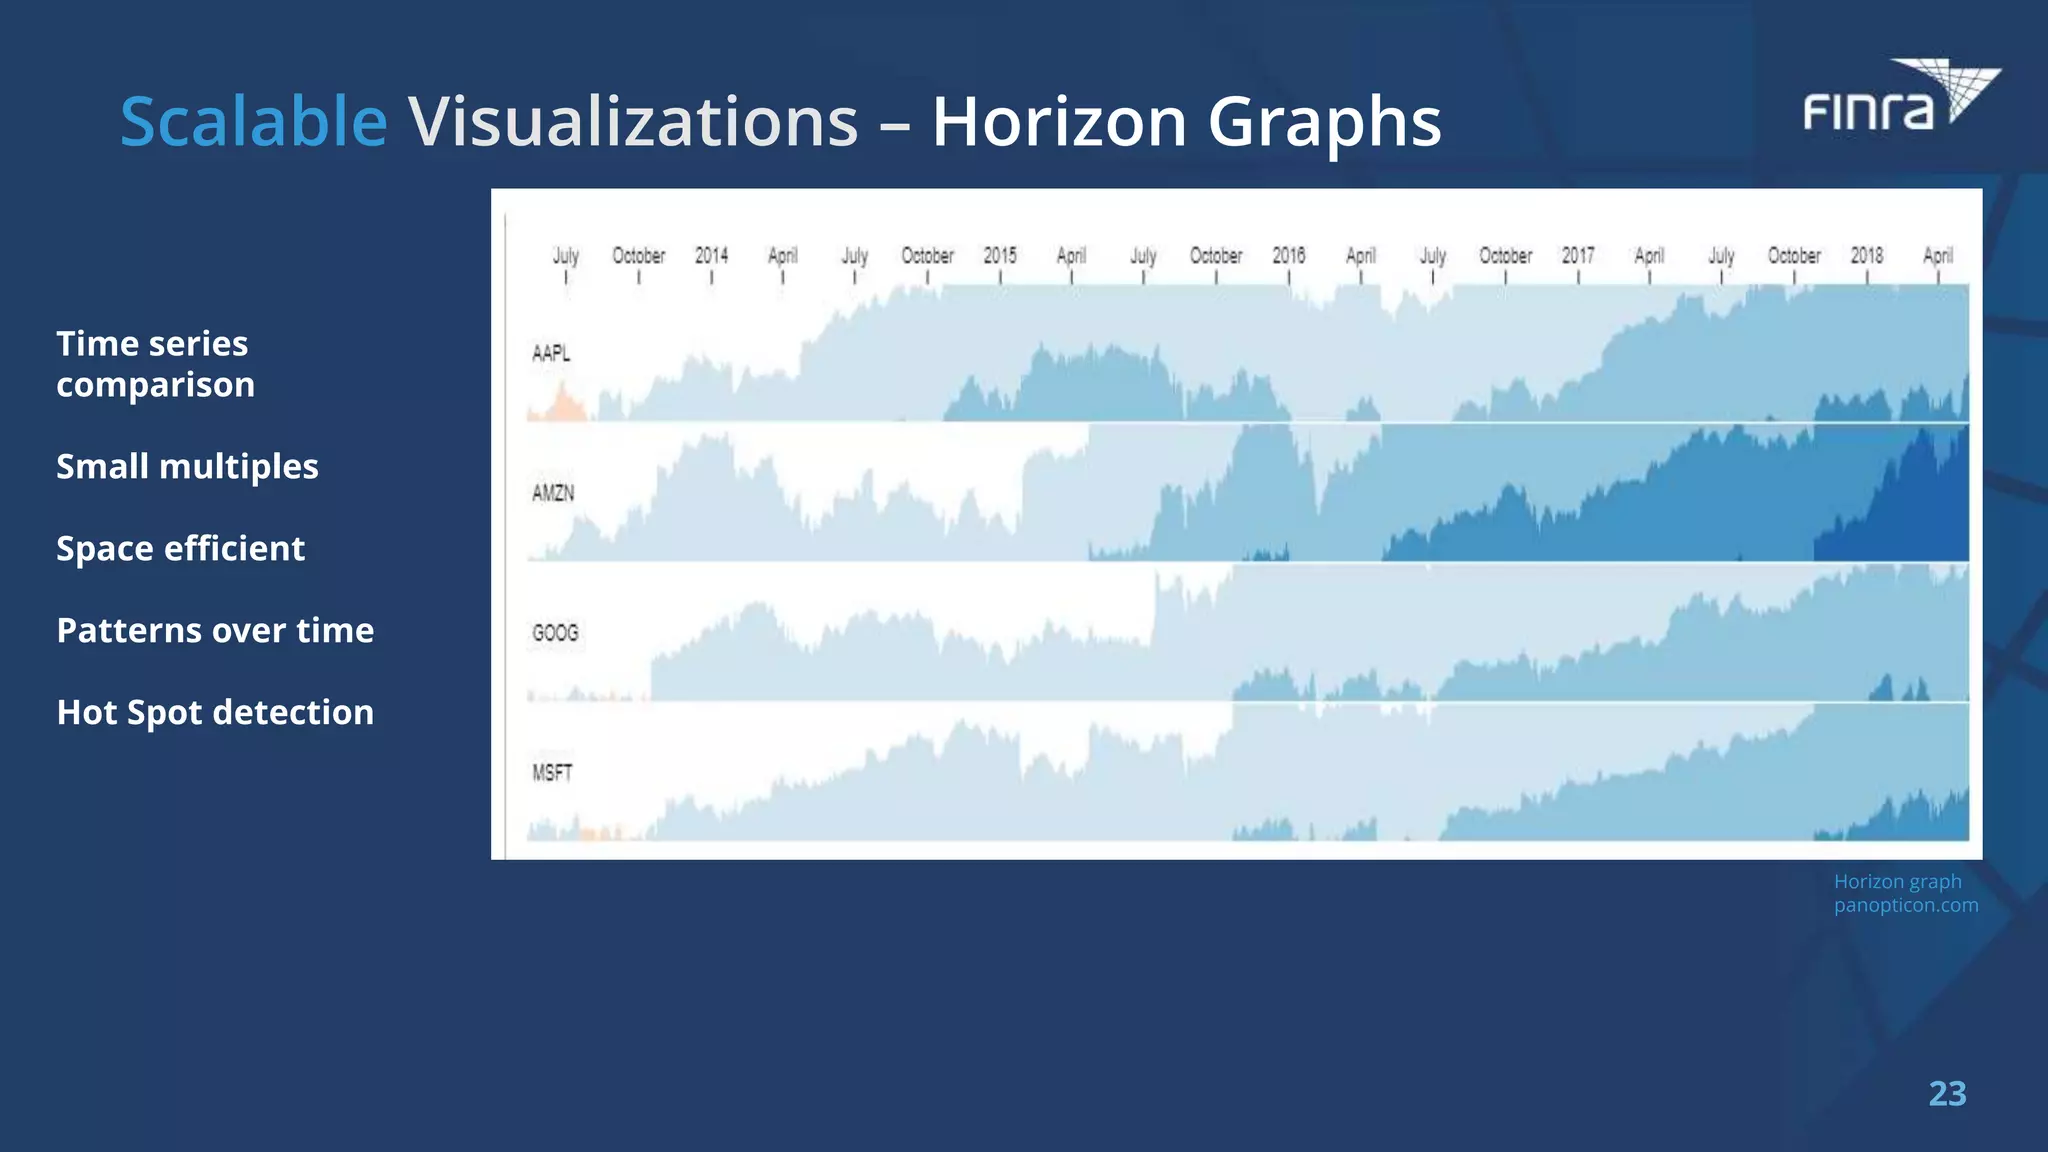
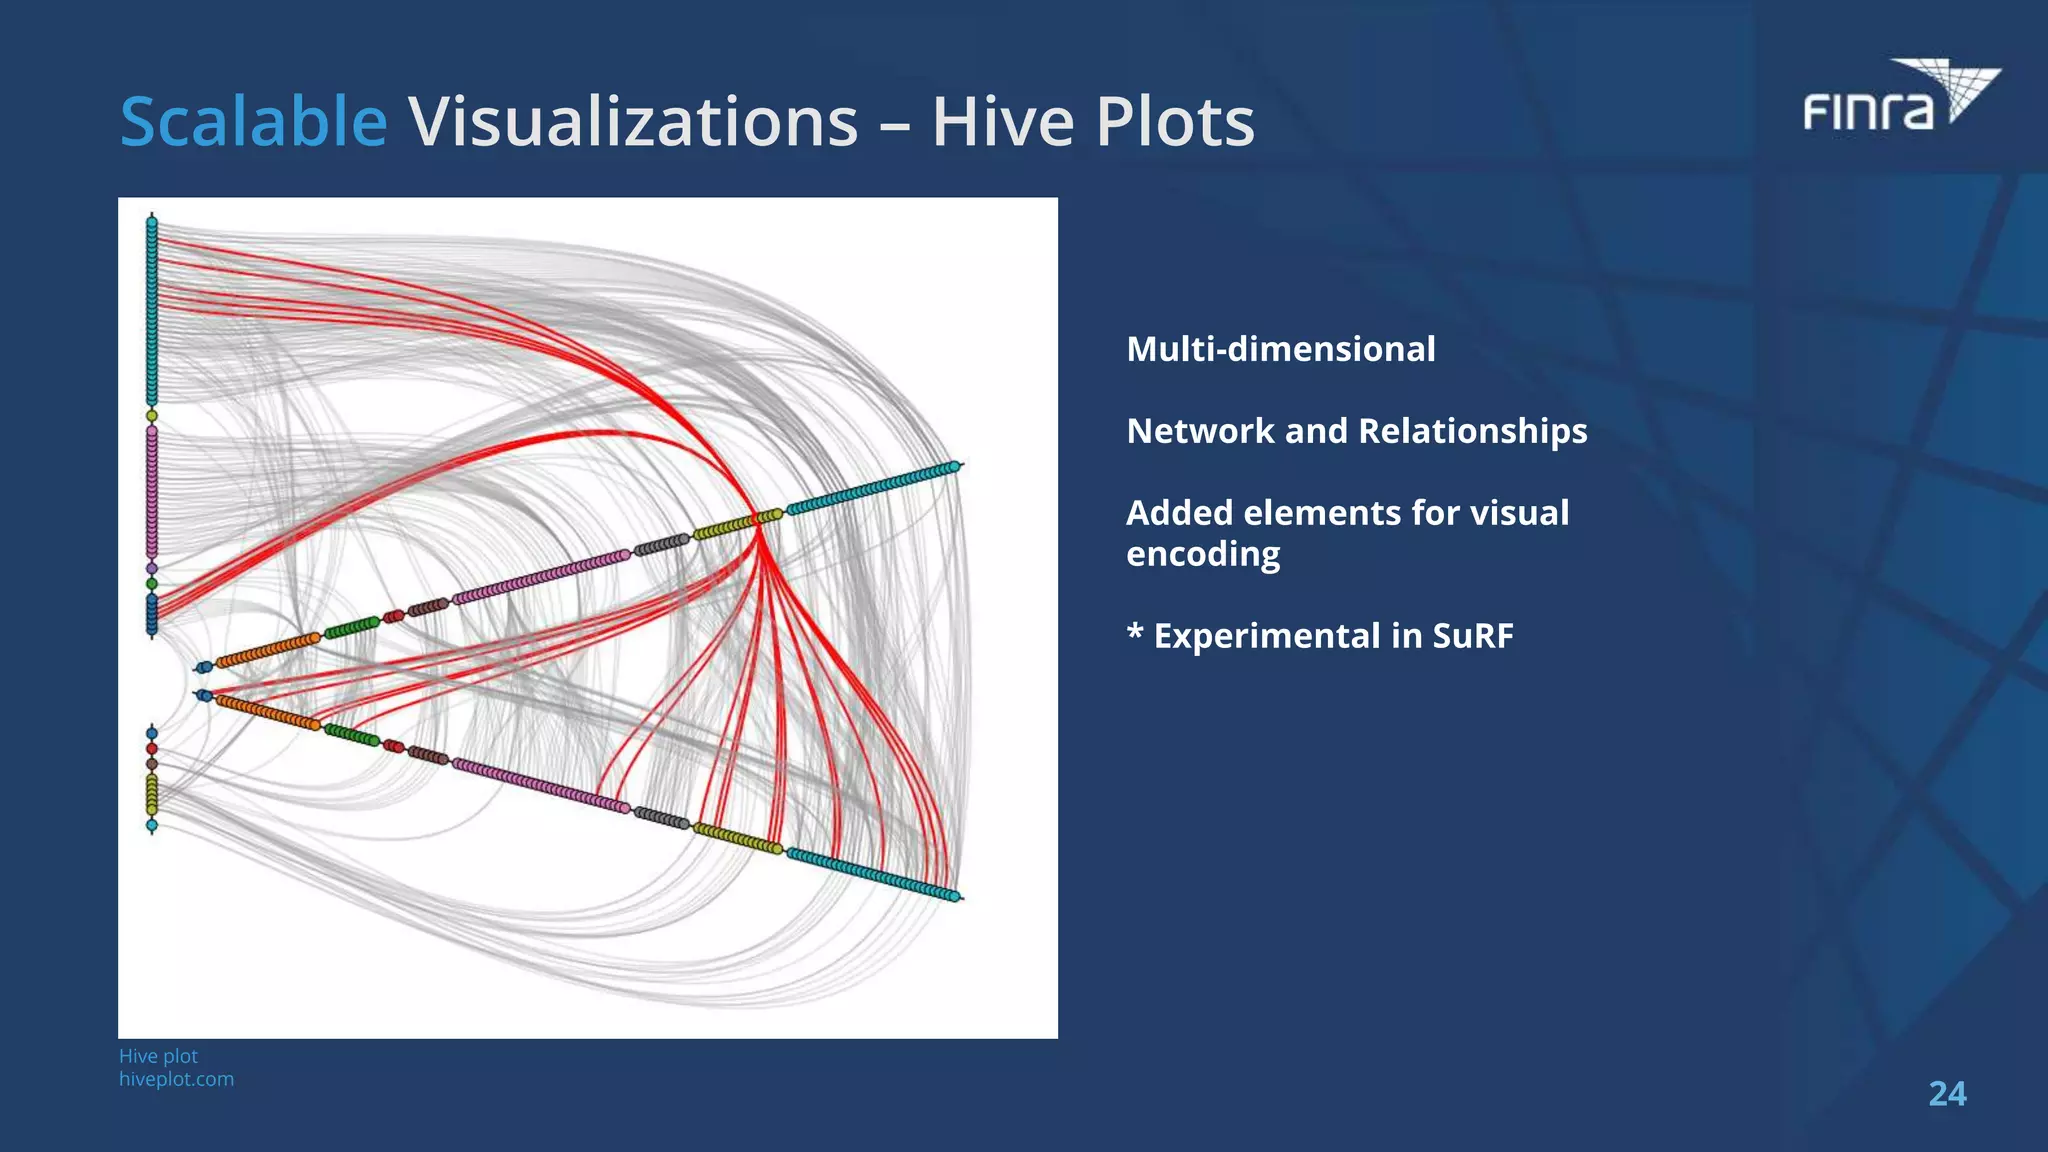


The document discusses how FINRA utilizes cloud technologies and data visualization techniques to enhance market surveillance and analysis. Key points include scaling challenges, interactive data access, visual analysis methods, and the fundamental importance of visual representation in interpreting complex data. It emphasizes the need for effective visualization to identify patterns, outliers, and relationships in large datasets.


![Coded Agents – with UiPath SDK + LangGraph [Virtual Hands-on Workshop]](https://cdn.slidesharecdn.com/ss_thumbnails/codedagentsdeck-251215155422-5497c599-thumbnail.jpg?width=640&height=640&fit=bounds)


![Vibe Coding vs. Spec-Driven Development [Free Meetup]](https://cdn.slidesharecdn.com/ss_thumbnails/vibecodingvsspecdrivendevelopment-251209105622-43f455e7-thumbnail.jpg?width=640&height=640&fit=bounds)


