Definition of DATA
•Collection of facts, numbers, words, observations or other
useful information.
• Through data processing and data analysis, raw data is
transformed into valuable insights that improve decision-
making and drive better business outcomes.
• In recent years, the rise of AI has further increased the focus
on data to train machine learning models and refine predictive
algorithms.
• As data’s volume, complexity and importance grow,
effective data management processes are needed to keep
information organized and accessible for data analysis.
2
3.
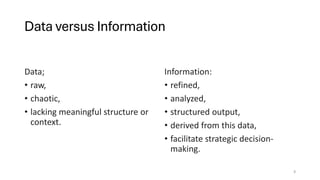
Data versus Information
Data;
•raw,
• chaotic,
• lacking meaningful structure or
context.
Information:
• refined,
• analyzed,
• structured output,
• derived from this data,
• facilitate strategic decision-
making.
3
4.
Purposes of DataUse
• Predict customer behaviour
• Optimise supply chain
• Forcast demand
• Predictive analytics
• Generative AI
• Healthcare innovations
• Social science research
• Cybersecurity and risk management
• Operational efficiency
• Business intelligence (BI)
4
5.
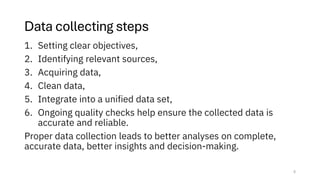
Data collecting steps
1.Setting clear objectives,
2. Identifying relevant sources,
3. Acquiring data,
4. Clean data,
5. Integrate into a unified data set,
6. Ongoing quality checks help ensure the collected data is
accurate and reliable.
Proper data collection leads to better analyses on complete,
accurate data, better insights and decision-making.
5
6.
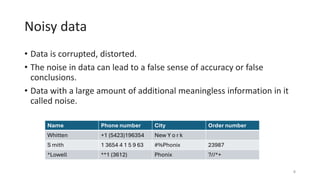
Noisy data
• Datais corrupted, distorted.
• The noise in data can lead to a false sense of accuracy or false
conclusions.
• Data with a large amount of additional meaningless information in it
called noise.
6
Name Phone number City Order number
Whitten +1 (5423)196354 New Y o r k
S mith 1 3654 4 1 5 9 63 #%Phonix 23987
*Lowell **1 (3612) Phonix ?//*+
7.
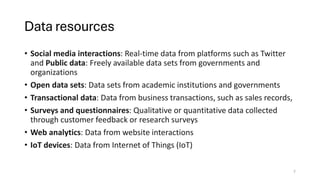
Data resources
• Socialmedia interactions: Real-time data from platforms such as Twitter
and Public data: Freely available data sets from governments and
organizations
• Open data sets: Data sets from academic institutions and governments
• Transactional data: Data from business transactions, such as sales records,
• Surveys and questionnaires: Qualitative or quantitative data collected
through customer feedback or research surveys
• Web analytics: Data from website interactions
• IoT devices: Data from Internet of Things (IoT)
7
8.
Types of DATA
Someof the most common types of data include:
• Quantitative data
• Qualitative data
• Structured data
• Unstructured data
• Semi-structured data
• Metadata
• Big data
8
9.
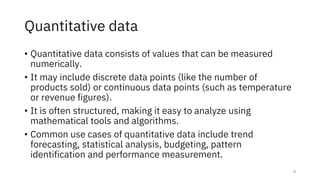
Quantitative data
• Quantitativedata consists of values that can be measured
numerically.
• It may include discrete data points (like the number of
products sold) or continuous data points (such as temperature
or revenue figures).
• It is often structured, making it easy to analyze using
mathematical tools and algorithms.
• Common use cases of quantitative data include trend
forecasting, statistical analysis, budgeting, pattern
identification and performance measurement.
9
10.
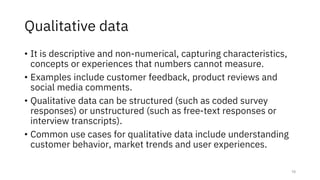
Qualitative data
• Itis descriptive and non-numerical, capturing characteristics,
concepts or experiences that numbers cannot measure.
• Examples include customer feedback, product reviews and
social media comments.
• Qualitative data can be structured (such as coded survey
responses) or unstructured (such as free-text responses or
interview transcripts).
• Common use cases for qualitative data include understanding
customer behavior, market trends and user experiences.
10
11.
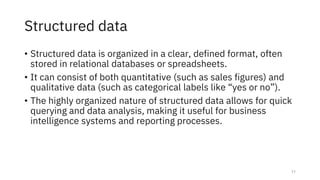
Structured data
• Structureddata is organized in a clear, defined format, often
stored in relational databases or spreadsheets.
• It can consist of both quantitative (such as sales figures) and
qualitative data (such as categorical labels like “yes or no”).
• The highly organized nature of structured data allows for quick
querying and data analysis, making it useful for business
intelligence systems and reporting processes.
11
12.
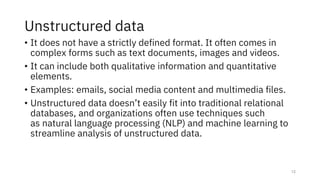
Unstructured data
• Itdoes not have a strictly defined format. It often comes in
complex forms such as text documents, images and videos.
• It can include both qualitative information and quantitative
elements.
• Examples: emails, social media content and multimedia files.
• Unstructured data doesn’t easily fit into traditional relational
databases, and organizations often use techniques such
as natural language processing (NLP) and machine learning to
streamline analysis of unstructured data.
12
13.
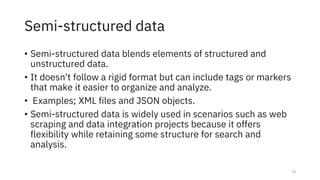
Semi-structured data
• Semi-structureddata blends elements of structured and
unstructured data.
• It doesn't follow a rigid format but can include tags or markers
that make it easier to organize and analyze.
• Examples; XML files and JSON objects.
• Semi-structured data is widely used in scenarios such as web
scraping and data integration projects because it offers
flexibility while retaining some structure for search and
analysis.
13
14.
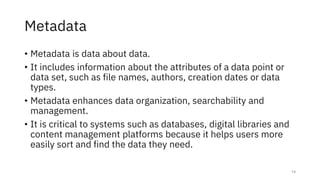
Metadata
• Metadata isdata about data.
• It includes information about the attributes of a data point or
data set, such as file names, authors, creation dates or data
types.
• Metadata enhances data organization, searchability and
management.
• It is critical to systems such as databases, digital libraries and
content management platforms because it helps users more
easily sort and find the data they need.
14
15.
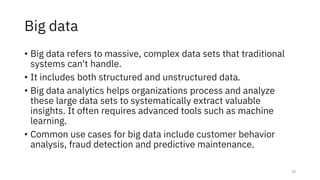
Big data
• Bigdata refers to massive, complex data sets that traditional
systems can't handle.
• It includes both structured and unstructured data.
• Big data analytics helps organizations process and analyze
these large data sets to systematically extract valuable
insights. It often requires advanced tools such as machine
learning.
• Common use cases for big data include customer behavior
analysis, fraud detection and predictive maintenance.
15
16.
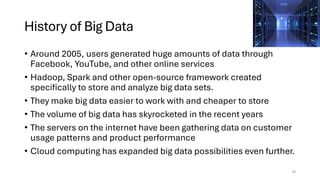
History of BigData
• Around 2005, users generated huge amounts of data through
Facebook, YouTube, and other online services
• Hadoop, Spark and other open-source framework created
specifically to store and analyze big data sets.
• They make big data easier to work with and cheaper to store
• The volume of big data has skyrocketed in the recent years
• The servers on the internet have been gathering data on customer
usage patterns and product performance
• Cloud computing has expanded big data possibilities even further.
16
17.
Data management
• Datamanagement is the practice of collecting, processing and
using data securely and efficiently to improve business
outcomes.
• It addresses critical challenges such as managing large data
sets, breaking down silos and handling inconsistent data
formats.
• Data management solutions typically to help ensure access to
high-quality, usable data for data scientists, analysts and other
stakeholders.
17
18.
2 of themost significant roles in the field
• Data scientist: create models and algorithms to find insights
in large data sets, often using advanced tools such as
machine learning and predictive modeling.
• Data analyst: use statistics to analyze data and answer
specific business questions. Their main goal is to find useful
insights that help with everyday decisions and strategies.
18
19.
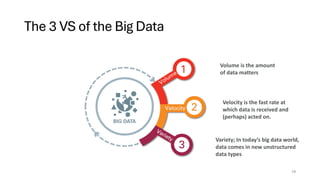
The 3 VSof the Big Data
Volume is the amount
of data matters
Velocity is the fast rate at
which data is received and
(perhaps) acted on.
Variety; In today’s big data world,
data comes in new unstructured
data types
19
20.
Examples from Companies
•Companies like Netfix and Procter & Gamble use big data to
anticipate customer demand.
• Classify key attributes of past and current products or services,
• Model the relationship between those attributes and the commercial
success of the offerings,
• Build predictive models for new products and services.
• P&G uses data and analytics from focus groups, social media, test
markets, and early store rollouts to plan, produce, and launch new
products.
20
21.
Big Data Challenges
•Data volumes are increasing in size and organizations need to find
ways to effectively store it.
• Data is valuable when it is clean. Clean data, or data that’s relevant
and organized in a way that enables meaningful analysis requires a lot
of work.
• Data technology is changing and keeping up with big data technology
is an ongoing challenge. Apache Hadoop and Apache Spark
frameworks appears to be the best approach.
21
22.
Steps of BigData Works
1. Integrating data from different sources, formatting in a required
form
2. Store; in the Cloud, on-premises or both
3. Analyse and act on the data
22
23.
Big Data Platforms
1.Apache Hadoop
2. Snowflake
3. Apache Spark
4. Google BigQuery
5. AWS Big Data Solutions
6. Microsoft Azure HDInsight
23


![[DSC Europe 25] Bojan Djuricic - Predictive Design Process.pdf](https://cdn.slidesharecdn.com/ss_thumbnails/5awdrbedqdek3gqu2ezy-4-the-predictive-design-bojan-djuricic-260120105856-6c399e9b-thumbnail.jpg?width=640&height=640&fit=bounds)

![[DSC Europe 25] Jovan Sumarac - Real-World Applications of Computer Vision in...](https://cdn.slidesharecdn.com/ss_thumbnails/fiksms22smcpopvvld03-jovan-sumarac-real-life-applications-of-computer-vision-in-automotive-systems-260120105855-de622abb-thumbnail.jpg?width=640&height=640&fit=bounds)

![[DSC Europe 25] Harshvardhan Jain - From Pre-Trained to Purpose-Built: Fine-T...](https://cdn.slidesharecdn.com/ss_thumbnails/zru4zmiseku5tgvu2dgw-harshvardhan-jain-from-pre-trained-to-purpose-built-fine-tuning-llms-for-high-i-260119101520-8335585f-thumbnail.jpg?width=640&height=640&fit=bounds)
![[DSC Europe 25] Paula Garcia Esteban -Building the Future: The Role of Data S...](https://cdn.slidesharecdn.com/ss_thumbnails/9ld1r1bsqpwve8qfvphy-paula-garcia-esteban-building-the-future-260122103838-4171f5cb-thumbnail.jpg?width=640&height=640&fit=bounds)
![[DSC Europe 25] Josip Saban - Career building for data professionals.pptx](https://cdn.slidesharecdn.com/ss_thumbnails/zroflcttkm1vmli0txea-josip-saban-career-building-for-data-professionals-260123083019-587cdb8c-thumbnail.jpg?width=640&height=640&fit=bounds)

![[DSC Europe 25] Laila Kakar - Leveraging AI for Strategic Excellence: Enhanci...](https://cdn.slidesharecdn.com/ss_thumbnails/eykmhrtsqmaaftwkexh7-dsc-lailakakar-1-260119101520-5f3b5616-thumbnail.jpg?width=640&height=640&fit=bounds)

![[DSC Europe 25] Egor Krasheninnikov - The Control Stack: Building Guardrails ...](https://cdn.slidesharecdn.com/ss_thumbnails/3lzcz7hxqmo51mtalv4u-the-control-stack-260119101520-ea90841a-thumbnail.jpg?width=640&height=640&fit=bounds)
![[DSC Europe 25] Mikhail Rozhkov - AI Product Canvas: From Business Goals to T...](https://cdn.slidesharecdn.com/ss_thumbnails/d53doddtpgfqivmzqel6-mikhail-rozhkov-ai-product-canvas-v1-260121115910-9dd517a7-thumbnail.jpg?width=640&height=640&fit=bounds)

![[DSC Europe 25] Dubravko Culibrk - Deep Learning for Mammography.pptx](https://cdn.slidesharecdn.com/ss_thumbnails/yiscimuktacgqoiu4dkp-deep-learning-for-mammography-260119121559-aad59182-thumbnail.jpg?width=640&height=640&fit=bounds)


![[DSC Europe 25] Borko Kozomora - Optimizing business workflows with advances ...](https://cdn.slidesharecdn.com/ss_thumbnails/hbgekyb0txw0xpo4yfml-borko-kozomora-leading-ai-transformation-260122103838-cc29ee38-thumbnail.jpg?width=640&height=640&fit=bounds)

![[DSC Europe 25] Srdj Stanisic - Local and Private AI in UX.pdf](https://cdn.slidesharecdn.com/ss_thumbnails/vwmetykqmztgmokmmkfa-3-srdjan-stanisic-local-and-small-ai-in-ux-260120105855-55a31869-thumbnail.jpg?width=640&height=640&fit=bounds)