Downloaded 385 times


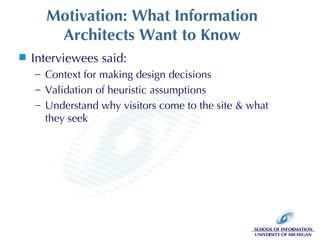
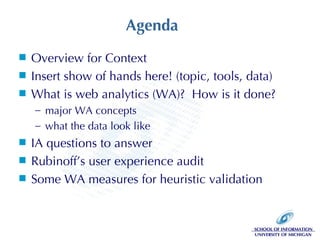
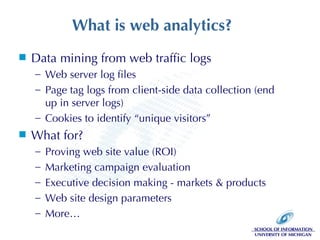


The document discusses the application of web analytics (WA) in information architecture (IA) to improve website design and decision-making processes. It outlines key concepts, methodologies, and metrics for validating design assumptions and understanding user behavior, emphasizing the synergy between analysts and information architects. The presentation stresses the importance of measuring user interactions, error rates, and navigation to optimize user experience on websites.