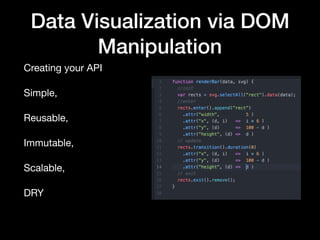
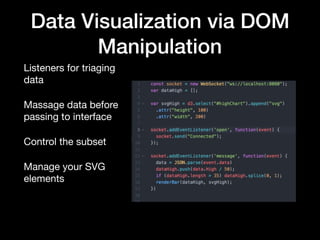
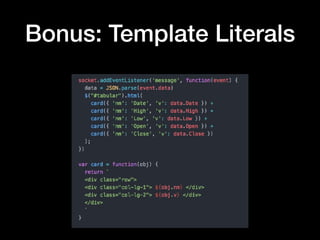
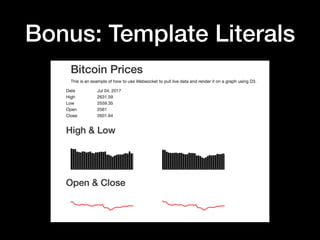
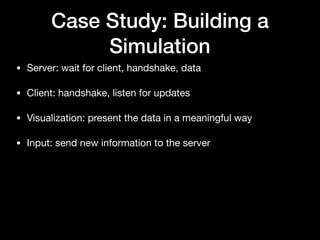
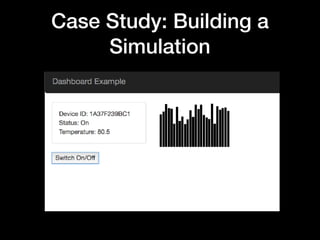
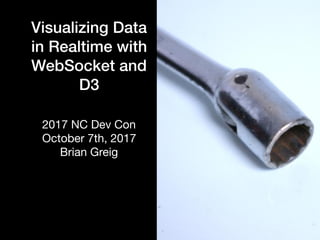
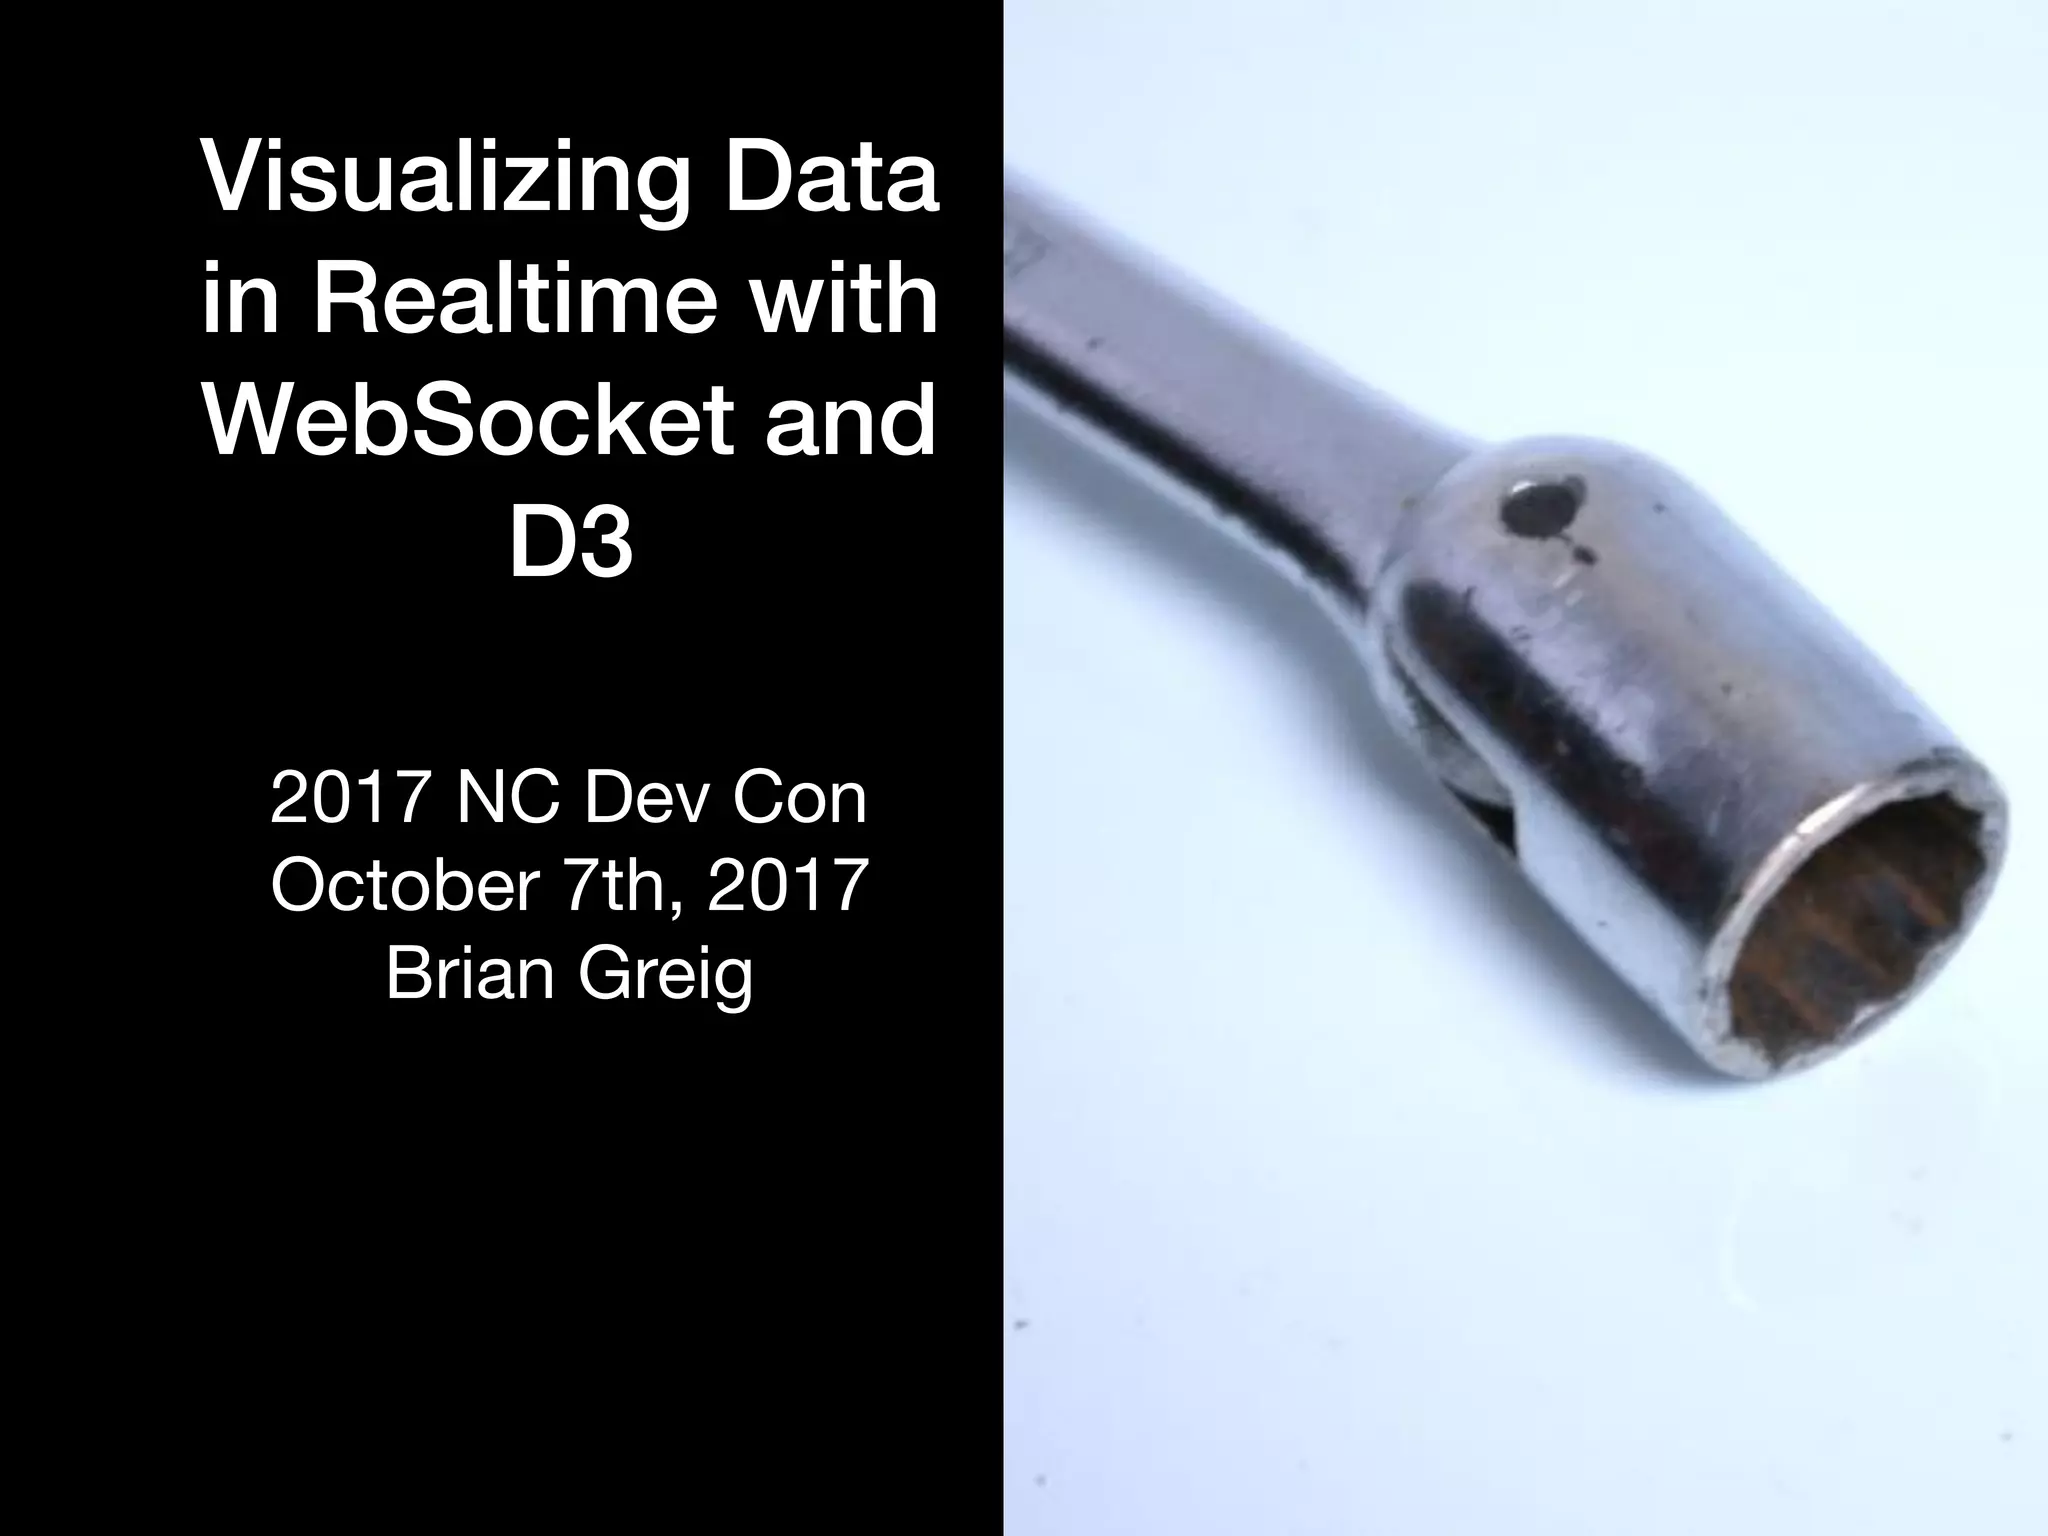
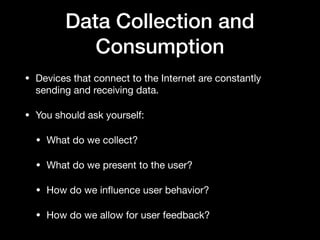
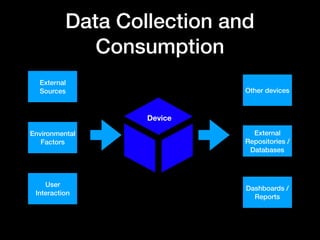
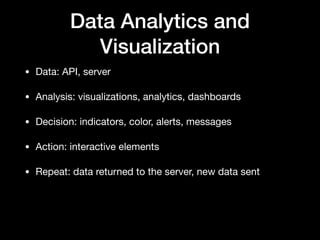
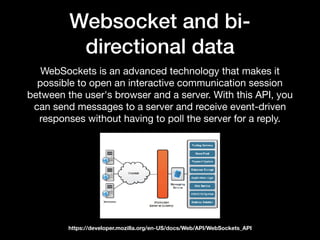
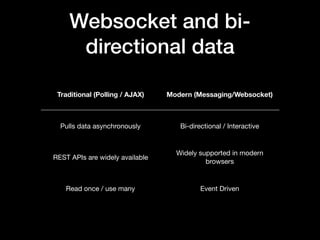
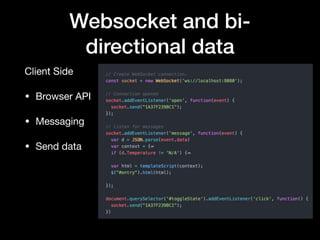
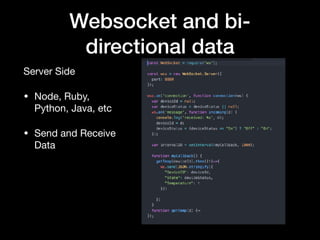
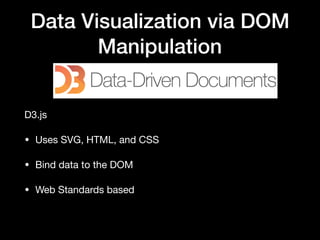
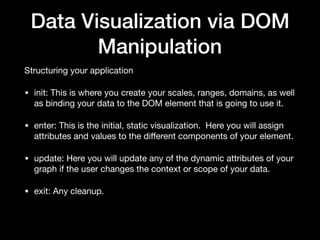
Brian Greig gave a presentation on visualizing data in realtime using WebSockets and D3. He discussed collecting and consuming data from various sources, performing data analytics and visualizations using the DADA loop, using WebSockets for bidirectional data transmission, manipulating the DOM with D3 for data visualization, and presented a case study on building a simulation.
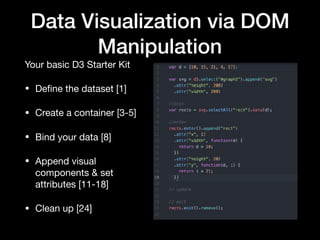
![Data Visualization via DOM
Manipulation
Your basic D3 Starter Kit
• Define the dataset [1]
• Create a container [3-5]
• Bind your data [8]
• Append visual
components & set
attributes [11-18]
• Clean up [24]](https://image.slidesharecdn.com/dc-wsd3-171002012756/85/Data-Collection-and-Consumption-18-320.jpg)