School of ComputingScience and Engineering
Course Code : CSDA4070 Course Name: Data Visualization
Name of the Faculty: Mr.S.Rakesh kumar Program Name: B.Tech.(CS)
UNIT IV
Introduction to D3.js
2.
Software process andProcess Models
Data visualization is the presentation of data in a pictorial or
graphical format.
The primary goal of data visualization is to communicate
information clearly and efficiently via statistical graphics, plots
and information graphics.
Data visualization helps us to communicate our insights
quickly and effectively.
2
Data visualization
Program Name: B.Tech.(CS)
3.
Software process andProcess Models
Data visualizations can be interactive, so that users analyze
specific data in the chart.
Data visualizations can be developed and integrated in regular
websites and even mobile applications using different
JavaScript frameworks
Any type of data, which is represented by a visualization
allows users to compare the data, generate analytic reports,
understand patterns and thus helps them to take the decision.
3
Data visualization
Program Name: B.Tech.(CS)
4.
Software process andProcess Models
4
What is D3.js?
Program Name: B.Tech.(CS)
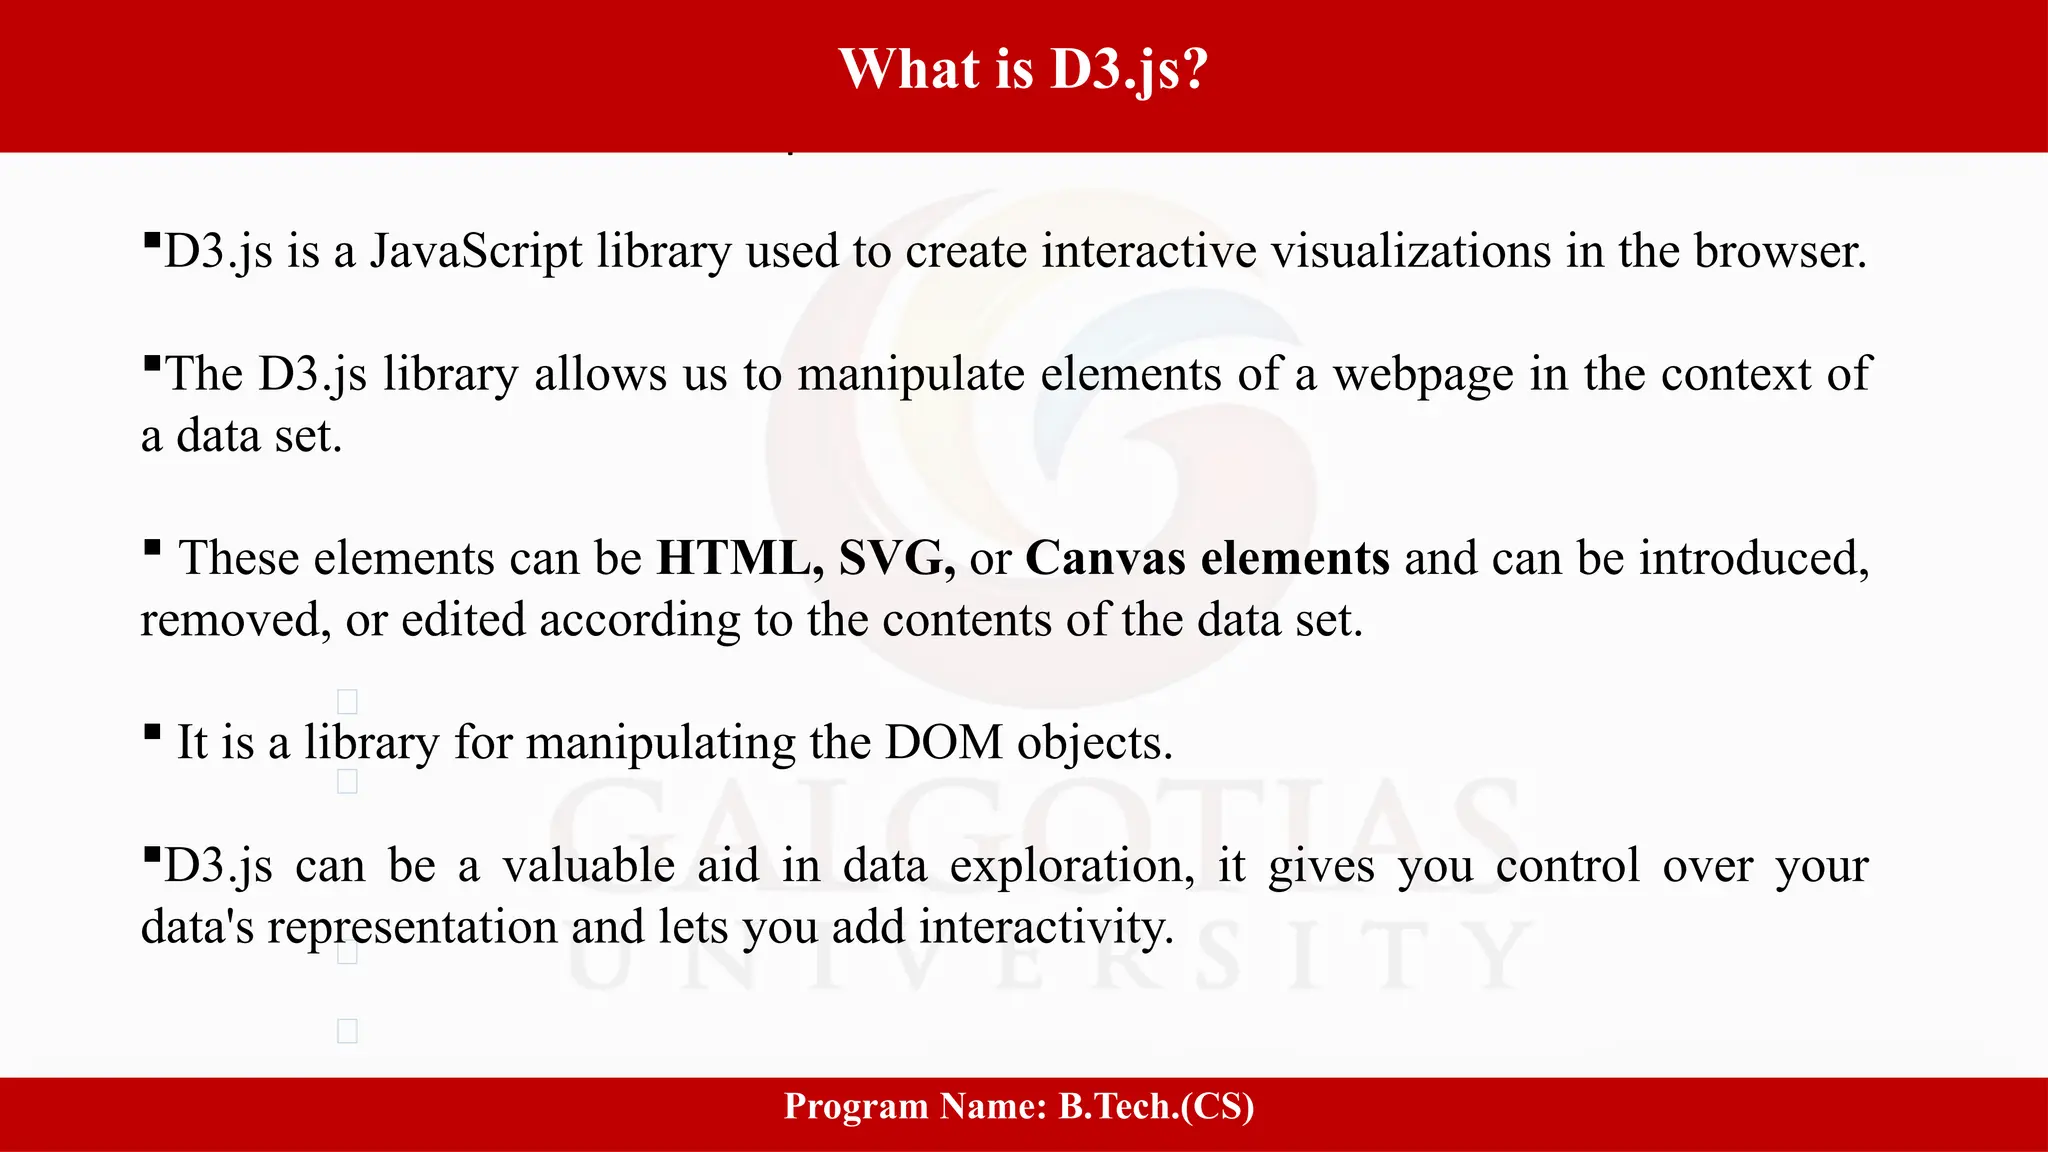
D3.js is a JavaScript library used to create interactive visualizations in the browser.
The D3.js library allows us to manipulate elements of a webpage in the context of
a data set.
These elements can be HTML, SVG, or Canvas elements and can be introduced,
removed, or edited according to the contents of the data set.
It is a library for manipulating the DOM objects.
D3.js can be a valuable aid in data exploration, it gives you control over your
data's representation and lets you add interactivity.
5.
5
Why Do WeNeed D3.js?
Program Name: B.Sc.(CS)
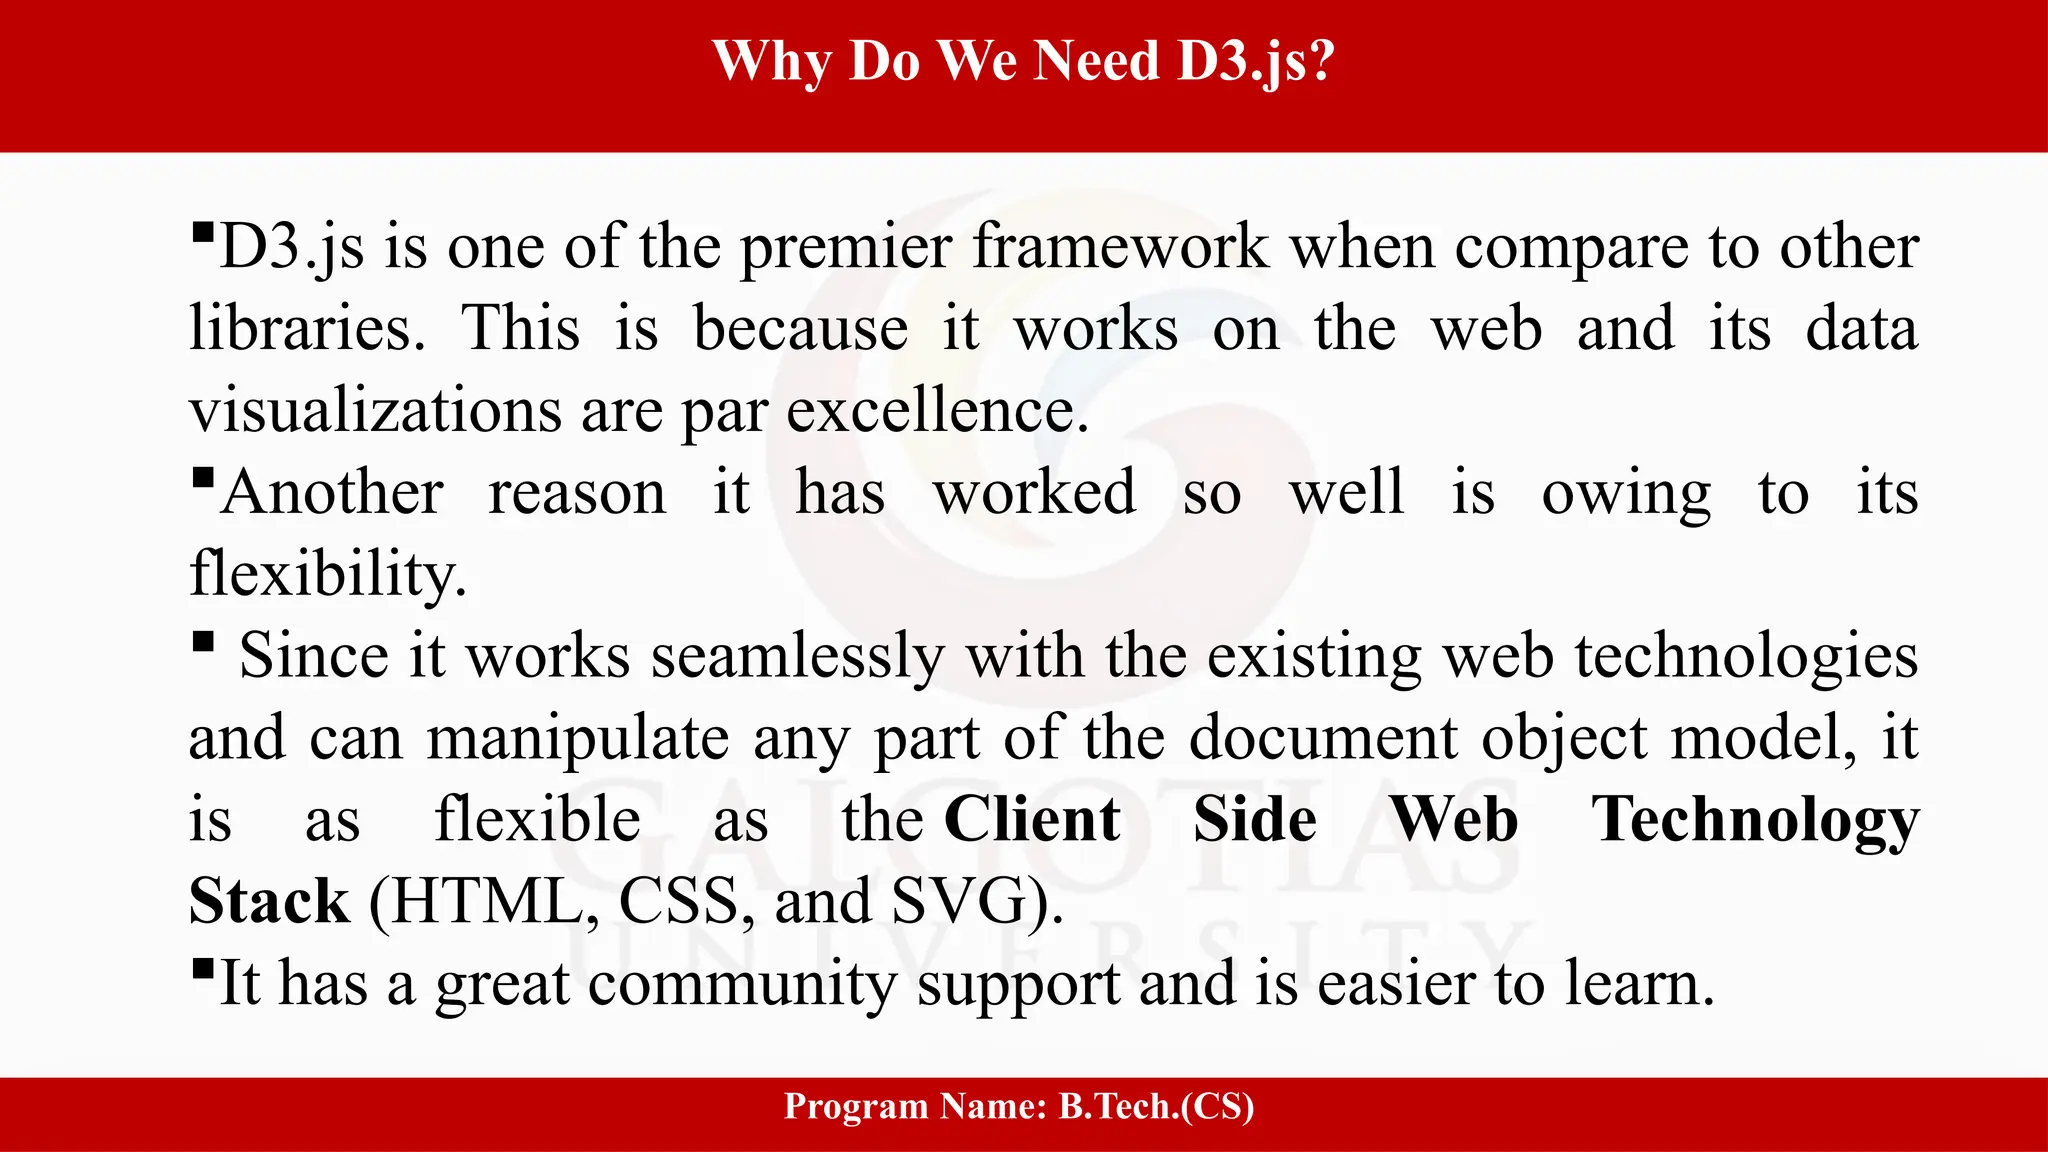
D3.js is one of the premier framework when compare to other
libraries. This is because it works on the web and its data
visualizations are par excellence.
Another reason it has worked so well is owing to its
flexibility.
Since it works seamlessly with the existing web technologies
and can manipulate any part of the document object model, it
is as flexible as the Client Side Web Technology
Stack (HTML, CSS, and SVG).
It has a great community support and is easier to learn.
6.
6
D3.js Features
Program Name:B.Sc.(CS)
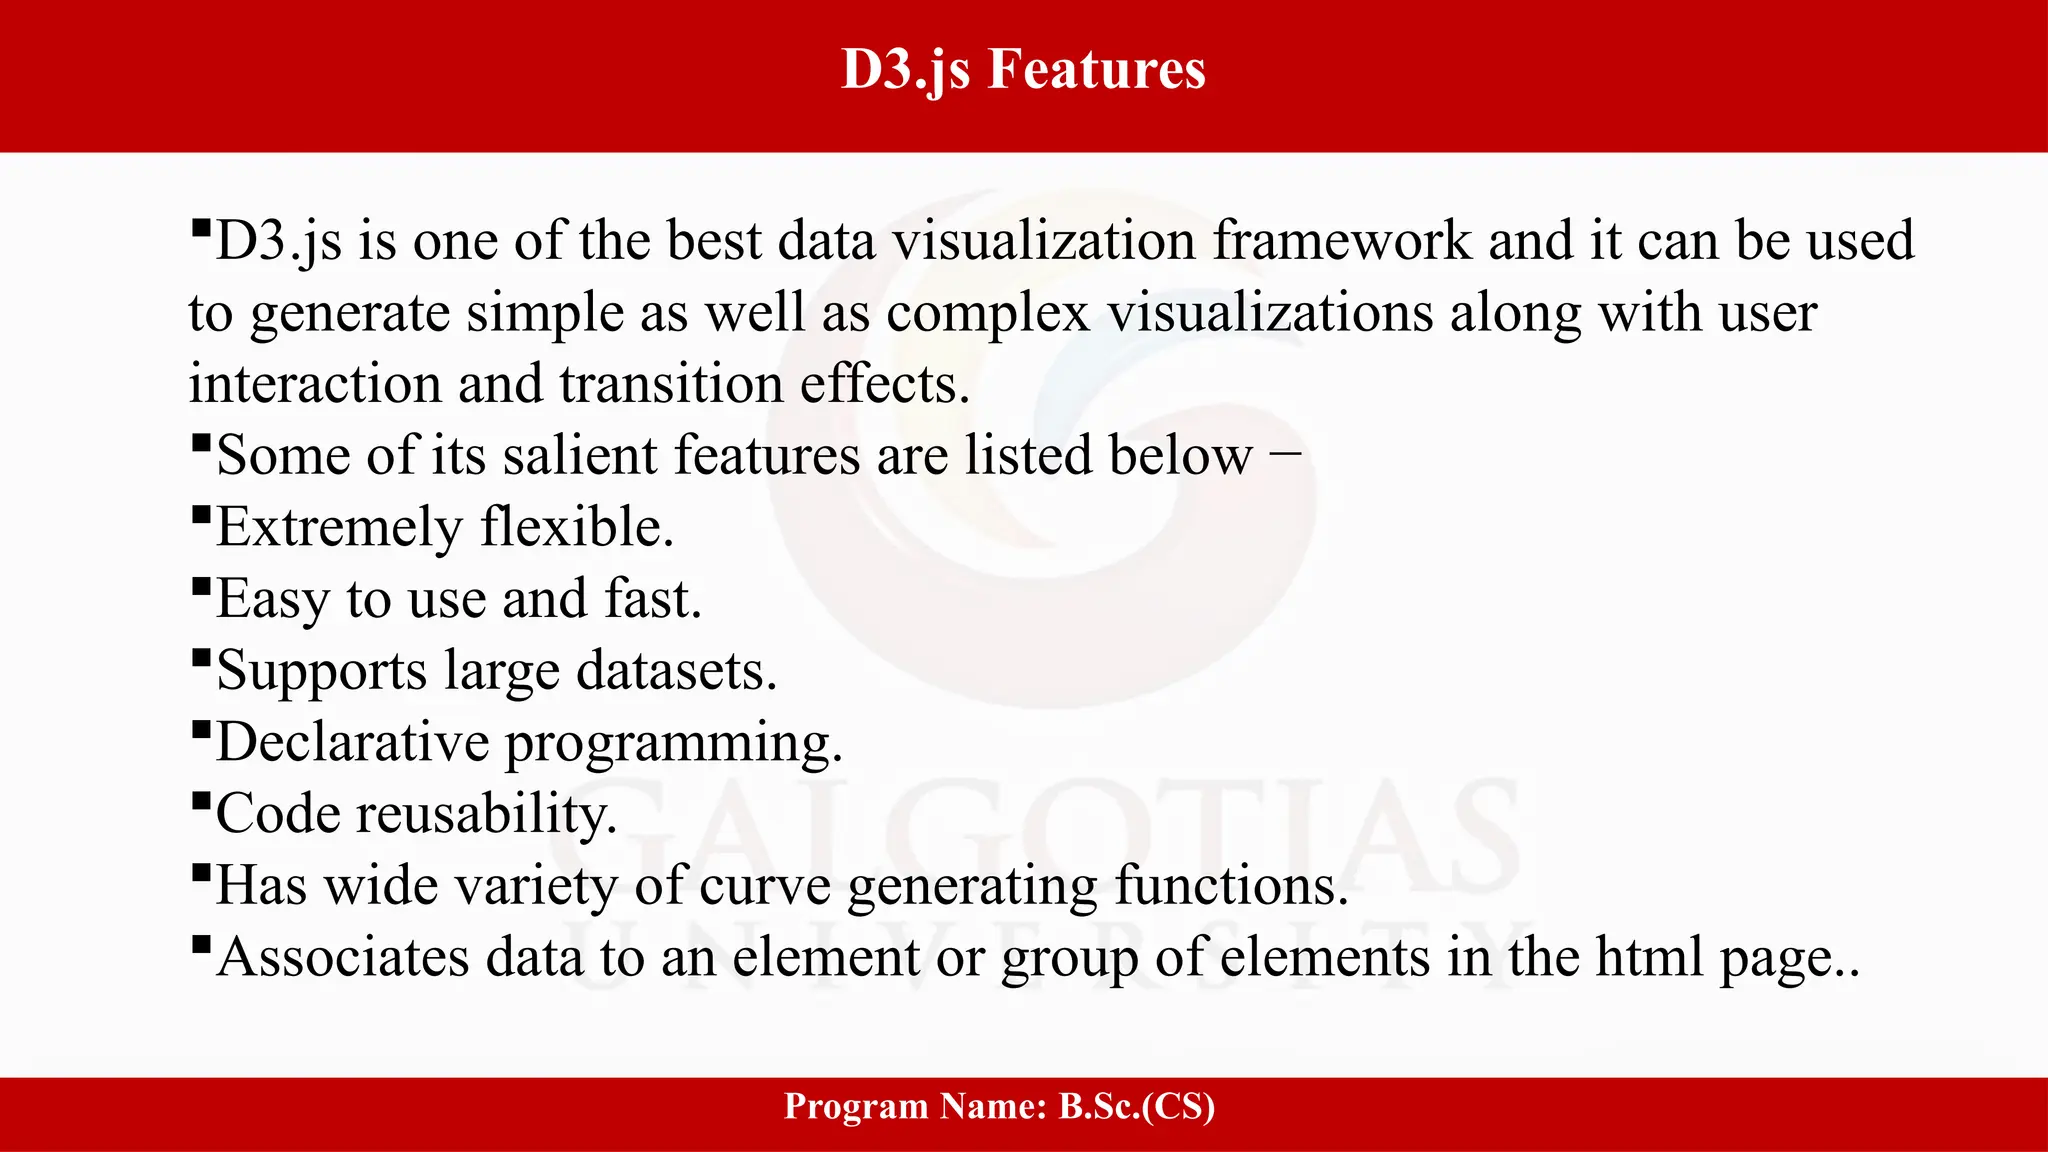
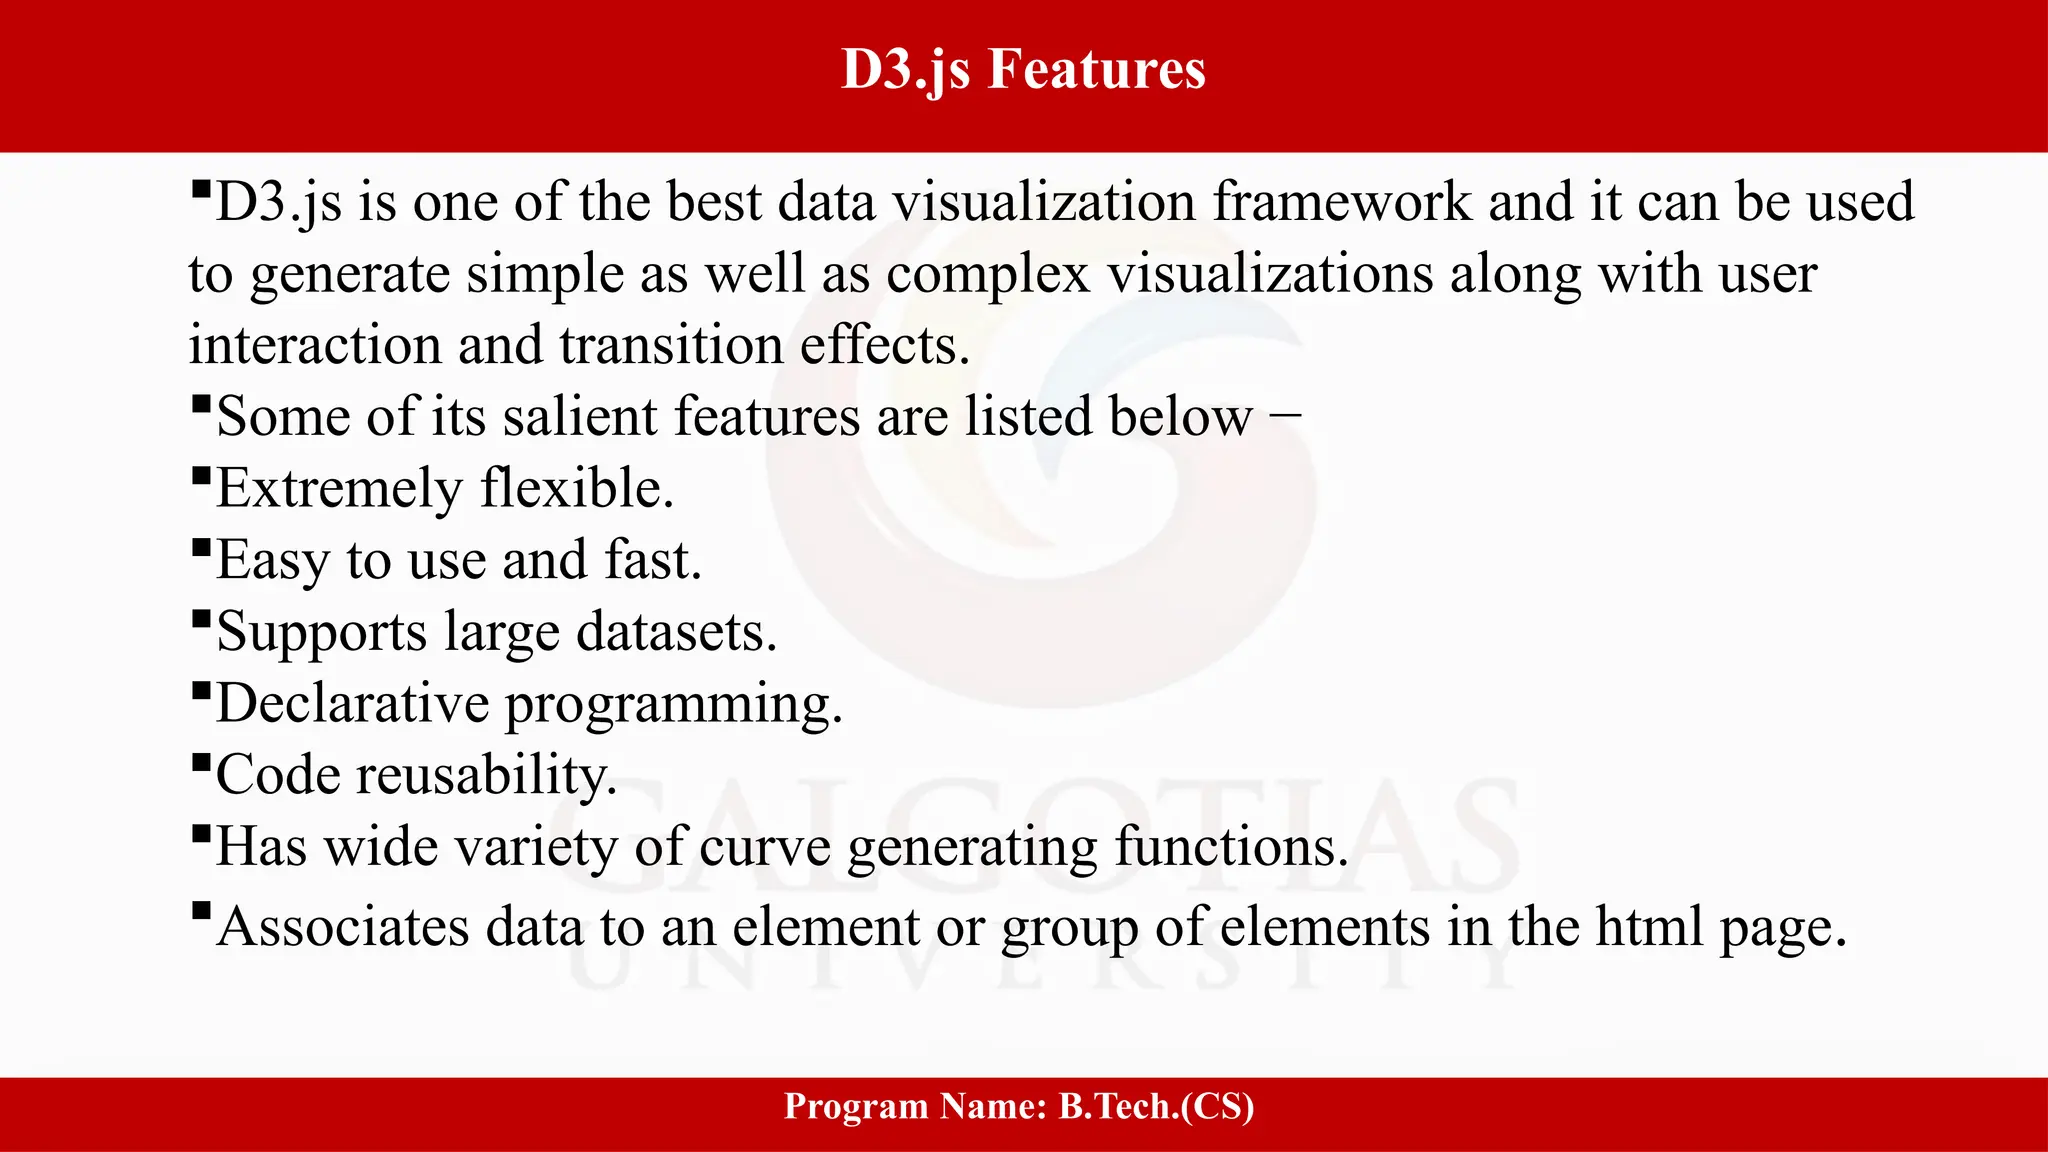
D3.js is one of the best data visualization framework and it can be used
to generate simple as well as complex visualizations along with user
interaction and transition effects.
Some of its salient features are listed below −
Extremely flexible.
Easy to use and fast.
Supports large datasets.
Declarative programming.
Code reusability.
Has wide variety of curve generating functions.
Associates data to an element or group of elements in the html page..
7.
7
D3.js Benefits
Program Name:B.Sc.(CS)
D3.js is an open source project and works without any plugin.
It requires very less code and comes up with the following
benefits −
Great data visualization.
It is modular. You can download a small piece of D3.js, which
you want to use. No need to load the whole library every time.
Easy to build a charting component.
DOM manipulation.
8.
8
Why Do WeNeed D3.js?
Program Name: B.Tech.(CS)
D3.js is one of the premier framework when compare to other
libraries. This is because it works on the web and its data
visualizations are par excellence.
Another reason it has worked so well is owing to its
flexibility.
Since it works seamlessly with the existing web technologies
and can manipulate any part of the document object model, it
is as flexible as the Client Side Web Technology
Stack (HTML, CSS, and SVG).
It has a great community support and is easier to learn.
9.
9
Why Do WeNeed D3.js?
Program Name: B.Tech.(CS)
D3.js is one of the premier framework when compare to other
libraries. This is because it works on the web and its data
visualizations are par excellence.
Another reason it has worked so well is owing to its
flexibility.
Since it works seamlessly with the existing web technologies
and can manipulate any part of the document object model, it
is as flexible as the Client Side Web Technology
Stack (HTML, CSS, and SVG).
It has a great community support and is easier to learn.
10.
10
D3.js Features
Program Name:B.Tech.(CS)
D3.js is one of the best data visualization framework and it can be used
to generate simple as well as complex visualizations along with user
interaction and transition effects.
Some of its salient features are listed below −
Extremely flexible.
Easy to use and fast.
Supports large datasets.
Declarative programming.
Code reusability.
Has wide variety of curve generating functions.
Associates data to an element or group of elements in the html page.
11.
11
D3.js Benefits
Program Name:B.Tech.(CS)
D3.js is an open source project and works without any plugin.
It requires very less code and comes up with the following
benefits −
Great data visualization.
It is modular. You can download a small piece of D3.js, which
you want to use. No need to load the whole library every time.
Easy to build a charting component.
DOM manipulation.
12.
12
D3.js - Selections
ProgramName: B.Tech.(CS)
D3.js helps to select elements from the HTML page using the
following two methods −
select() − Selects only one DOM element by matching the
given CSS selector. If there are more than one elements for the
given CSS selector, it selects the first one only.
selectAll() − Selects all DOM elements by matching the
given CSS selector. If you are familiar with selecting elements
with jQuery, D3.js selectors are almost the same.
13.
13
D3.js
Program Name: B.Tech.(CS)
References:
"InformationDashboard Design: Displaying Data for At-a-glance Monitoring” by Stephen Few
"Beautiful Visualization, Looking at Data Through the Eyes of Experts by Julie Steele, Noah Iliinsky"
"The Accidental Analyst: Show Your Data Who’s Boss” by Eileen and Stephen McDaniel
"The Functional Art” by Alberto Cairo
"The Visual Display of Quantitative Information” by Edward R.Tufte


![[DSC Europe 25] Goran Obradovic - The Rise of Sovereign AI: Building the Regi...](https://cdn.slidesharecdn.com/ss_thumbnails/7nw2xxixrxqdxvrb5wca-6-251205085714-ab09a2ac-thumbnail.jpg?width=640&height=640&fit=bounds)
![[DSC Europe 25] Jim Sterne - Adopting Generative AI Capabilities Into the Ent...](https://cdn.slidesharecdn.com/ss_thumbnails/sxhpofuorcagxsaulkmt-3-251204082258-7e66bc48-thumbnail.jpg?width=640&height=640&fit=bounds)
![[DSC Europe 25] Vid Stimac - Policy Parsimony: Between Oversimplifying and Ov...](https://cdn.slidesharecdn.com/ss_thumbnails/eqlepagzqp2rhg3gbluh-dsc-stimac-251120-251205090438-059e7f54-thumbnail.jpg?width=640&height=640&fit=bounds)


![[DSC Europe 25] Andy Cotgreave - Nothing is new in analytics.pptx](https://cdn.slidesharecdn.com/ss_thumbnails/mba4vzcurvoh5lfrd5zw-6-251205194645-341bbbbe-thumbnail.jpg?width=640&height=640&fit=bounds)
![[DSC Europe 25] Dragana Ilic - AI for Big Data in Astronomy.pptx](https://cdn.slidesharecdn.com/ss_thumbnails/8palya86qaatvjhva1ms-2-dragana-ilic-ai-ilic-251208151906-652b819c-thumbnail.jpg?width=640&height=640&fit=bounds)


![[DSC Europe 25] Max Talanov - Non digital NNs.pptx](https://cdn.slidesharecdn.com/ss_thumbnails/wif8tr3gtua74qvtopke-non-digital-nns-251205090438-26b0eea6-thumbnail.jpg?width=640&height=640&fit=bounds)


