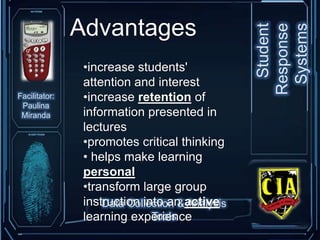
Thank You Jello for the wonderful job of compiling all powerpoints and unifying them with the theme you made! Had a really great time with this report :)
This document discusses how Turning Technologies utilizes student response systems to improve student achievement through formative assessment and interactive learning activities. Key features highlighted include administering polls and surveys, online content and assessment integration, data aggregation, and research-backed pedagogical approaches. The response system allows teachers to gauge student understanding in real-time, personalize instruction, and monitor progress.
An app idea to facilitate feedback and improve student learningEldon Prince
This is an app idea I came up with to improve student learning.
What is the motivation for this app?
Students, who are the customers of education, have little input. Teachers, who heavily influence student learning, lack the data to improve teaching. Administrators, who can promote change, have little information.
The auris app is designed to facilitate feedback and serve as a powerful tool to empower students, enable teachers, and inform administrators.
What do you think?
Educators as designers of learning analytics?Elizabeth Koh
Educators as designers of learning analytics? Keynote slides at 8th N3 ICT Symposium 24th July 2018 by Elizabeth Koh
Please note that some slides are revised for public sharing.
Presentation delivered at the UCISA event A-Z of learning analytics 28/06/2017. Ed Foster & Jane McNeil. A longer case study can be found at https://www.google.com/url?q=https://www.ucisa.ac.uk/-/media/Files/publications/truthaboutda/TheTruthAboutDA&sa=U&ved=0ahUKEwi8r-7W5_7eAhVKRBUIHf66CGEQFggMMAM&client=internal-uds-cse&cx=008281077274678676179:yulrfklwima&usg=AOvVaw17iuGZYPJPqFRCMGyBKLd0
Late return of feedback from lecturers was demoralizing students and causing frustration, poor NSS results, and some students considering dropping out. The causes included lecturers' busy schedules, the issue not being raised by course reps, academics not seeing it as a priority, and no monitoring of timescales. Potential solutions included setting targets for admin staff and course reps raising the issue to get academics more supported in meeting deadlines, informing students of any delays, and monitoring progress with university departments. This could lead to higher marks for students as they learn from feedback and improve motivation, retention, and NSS scores.
Evaluating The A Self Based Learning Format The Microsoft Word Documentsu068701
This document summarizes a self-paced learning program called "Format the Microsoft Word Documents" created by Aaisha Al Badi to help 6th grade students in Oman learn how to edit page setup in MS Word. The program is delivered via CD and uses various motivational strategies like pictures, sounds and interactions. It will be evaluated using the ACTIONS model which assesses access, interactivity, teaching/learning, and novelty. Checklists are provided to evaluate each level of the ACTIONS model.
Associate Professor Tracey Bretag: Contract cheating implications for Teachin...Studiosity.com
The document summarizes key findings from a research project on contract cheating in Australian higher education. The project involved surveys of over 14,000 students and 1,100 staff across 8 universities. It found that contract cheating is a systemic issue influenced by perceptions of higher education as a business. While most outsourcing involves people students know, certain factors like speaking a non-English language at home increase risk. Authentic assessment alone does not prevent cheating, and suspected cases often go unreported due to lack of proof or time. Overall, the problem requires addressing the complex causes rather than simplistic solutions.
The document discusses an institution's efforts to improve success rates for at-risk online students from 2005-2010. It identifies factors that placed students at risk and implemented interventions like tracking student activity and providing personalized outreach. As a result, the percentage of at-risk students completing courses increased by 2% to 84% over three years and the percentage earning a C or higher increased by 2% to 68%. The institution aims to further improve success in core subjects and enhance case management and instructor dashboards.
This capstone project document summarizes Mary Beth Jager's efforts to increase teacher and student usage of the ItsLearning platform at her school. Over the course of 9 months, she provided training sessions and support to help teachers integrate ItsLearning tools like the planner, quizzes, and polls into their instruction. Surveys found that teacher comfort levels and usage increased after the trainings. While usage grew, the document recommends continuing professional development to help students use ItsLearning in more transformational ways.
This document summarizes research comparing the effectiveness of different active learning techniques for information literacy instruction. The researchers studied clickers, problem-based learning, and a traditional lecture style. They administered pre- and post-class assessments to measure student learning. Results showed that clickers and problem-based learning produced slightly higher gains in student skills than traditional lectures. Problem-based learning was most effective for combining concepts using Boolean operators and quotation marks. The researchers aim to further develop hybrid class models and better integrate assessments to measure long-term learning impacts.
The student data driven life... every teacher's dreamNavigatingNerdies
Presented at the South Carolina Middle School Conference on March 1, 2014.
Come take a look at how we use student data to drive (and even detour) our instruction!
The document discusses using formative and summative evaluations to improve a field trip program called Think Science! Pathways. Formative evaluations in 2002 found that few teachers used the Pathways materials due to access issues, length, and complexity. It did increase time spent and engagement at exhibits. In response, materials were shortened and simplified. A 2003 summative evaluation found low Pathways use and no clear cognitive impact yet, but suggested in-class visits before field trips improved learning. Evaluations highlighted the need to better understand teacher and chaperone needs to improve program use and effectiveness.
1. The document discusses the history and evolution of data-driven instruction in education. It traces how educators shifted from relying solely on annual test scores and adherence to methods/materials to using real-time data to modify instruction.
2. Both advantages and disadvantages of data-driven instruction are presented. The advantages include tailoring instruction to student needs, holding schools accountable, and targeting resources. Disadvantages include over-reliance on testing and "teaching to the test."
3. The future of data-driven instruction is depicted as widespread use of interim assessments to monitor student and teacher progress and target interventions in a timely manner. Administrators will also use data to evaluate programs and resource allocation.
This document discusses the implementation of a data-driven school (DDS) system in the United States to address problems with existing school systems. It describes how a school district collected student data, had stakeholders analyze the data to develop goals, aligned programs and designed interventions based on gaps identified. The district was then able to monitor student performance, attendance and provide tailored classroom instruction. The system helped the district nearly close achievement gaps between white and minority students. Implementing a similar DDS system could help address issues in Bangladeshi schools like scheduling and university selection.
The effects of offering choice between two homework version adjp7676
This document summarizes an action research project that examined whether offering students a choice between two homework options would increase homework completion rates. The researcher found that while students reported enjoying having a choice, quantitative data analysis showed no significant increase in homework completion. Most students reported forgetting or finding homework too difficult as obstacles to completing it, rather than a lack of motivation. Offering a choice may only affect the minority of students who find homework boring.
Strategy Sessions: Improving student engagement through active participationLearningandTeaching
Units such as counselling skills, clinical psychology or social work, are able to engage students due to the clear, practical implications for future careers. In contrast, it is often difficult to engage students in theoretically driven or statistically based units. However, increased student engagement and active learning can be promoted when more opportunities for participation and discussion are provided.
In this presentation, Nicholas Harris shares strategies for better engaging students, whether they are studying online or on campus, or studying theoretical units. Strategies include weekly reflection quizzes, increased interactive activities during tutorials and lectures, and incorporating online consultation times, serve to increase opportunities for students to ask questions and have hands-on practice with the learning materials.
The document discusses assessment-driven instruction for reading programs in grades K-3. It defines assessment-driven instruction as using data from valid reading assessments that measure six components of reading. Teachers use several types of assessments, including screening, progress monitoring, diagnostic, and outcome assessments. The data from these assessments helps teachers identify students' reading levels, group students for effective instruction, target skills to reteach, and monitor student progress. The Lead Literacy Teacher's role includes scheduling assessments three times per year and implementing interventions for students at risk.
The self assessment modules are designed to help students test their understanding of course readings for each week. They consist of 3 multiple choice questions per topic, with feedback provided. If a question is answered incorrectly, students are directed to re-read that section. The modules include images, audio, video and other media to engage students. Student usage of the modules will be analyzed and a survey conducted to help improve them.
The document discusses the Warren Township School District's implementation of the Common Core State Standards for Mathematics using the Go Math curriculum program. It provides an overview of the Common Core Standards, describes how the math committee selected Go Math after examining several programs, and explains how math instruction will change with a greater emphasis on problem solving, reasoning and applying math skills in real-world contexts. Students and teachers will have access to online and digital materials through the Go Math and Think Central platforms to support teaching and learning of the new standards.
The document summarizes the author's experience as the coach of the MATHCOUNTS program at Peterson Middle School. It introduces the author and what MATHCOUNTS is as a non-profit organization that promotes mathematics competitions for middle school students. It then discusses why having a MATHCOUNTS program is beneficial, how the problems are different than standardized tests, and the logistics and challenges of running the after-school program at Peterson Middle School.
The document discusses evaluating online learning resources and facilitation. It provides information on collecting learner feedback through online survey tools like SurveyMonkey, Google Forms, and Moodle questionnaires. It also discusses the purposes of evaluation, such as improving resources and facilitation, understanding the learner experience, and sharing best practices. The document gives examples of the types of information that should be reported from evaluations, such as learner feedback, challenges, changes made, and insights gained from the experience.
e-Assessment and the Independent LearnerKenji Lamb
This document discusses e-assessment and its use at the Open University. It focuses on how e-assessment can support independent learning when done well. The Open University aims to use e-assessment to provide feedback, allow multiple attempts, support various interactions, and enable anytime, anywhere access. Guiding principles for their OpenMark e-assessment system include emphasizing feedback, allowing multiple attempts, supporting different interaction types, and designing for flexible access. When done right, e-assessment can provide personalized, instant feedback to drive future learning.
The document outlines the typical structure of a teacher-led inquiry project, known as a web quest. It begins with an introduction to provide background information for students. Students are then given a single question to analyze information to answer. The teacher guides students through the process, offering advice on time management, data collection, and group work strategies. Students are provided resources like websites to help complete the task. Finally, students present their findings in a written or oral report, and provide reflections on their experience.
The survey of 200 student affairs staff found that while departments use data for planning, most respondents reported needing more training and assistance with assessment. Specifically, over half reported limited time and expertise in assessment and not knowing where to start. To address these needs, implications include providing small group training across departments, increasing understanding and use of assessment tools, and developing structures by leadership to support a culture of assessment through reporting, rewards, and dedicated time and space for training.
Monday May 3 - Online Poll and Survey ToolsBill Tracey
The document discusses how online survey and polling tools can be used by teachers and students for active learning, assessment, and gathering feedback. It provides examples of how these tools allow teachers to collect information from staff and students, and allow students to create their own surveys to collect data for assignments. The document also outlines some of the educational outcomes that can be achieved when students create and analyze the results of their own online surveys.
The document discusses various tools for collecting and analyzing qualitative and quantitative data. It provides examples of tools for online surveys, data visualization, and statistical analysis in Excel, OpenStat, MATLAB, GNU Octave, SPSS, and more. These tools allow users to extract values from graphs, measure distances and angles, record color values, conduct descriptive statistics, correlations, regressions, and more.
This document provides a literature review on data collection and analysis at community schools. It discusses that community schools aim to address academic, health, social, and emotional outcomes both short and long-term. Common data collection methods identified include using existing data systems, surveys, and focus groups. Short-term indicators commonly measured include attendance, family engagement, and partnerships. Long-term indicators include academic achievement, health, employment, and crime rates. The most comprehensive data analysis framework suggested involves developing a logic model and collecting and analyzing data to answer evaluation questions.
Lecture 10 - Data Collection and Analysisanneleftwich
This document discusses using M&Ms to teach students about experimental probability and data collection tools. It proposes having students collect M&M color data to test the "myth" that brown M&Ms are disproportionately common. Students would use data collection tools like Google Forms, surveys, or whiteboards to record colors. Their results could then be analyzed to see if the myth is confirmed or busted. The document also discusses how content exploration, production, communication and data analysis tools can be combined to design classroom activities that develop 21st century skills.
The team collects data from initial teacher training providers to inform recruitment, assure funding, monitor and improve quality, and drive change. They work with partner organizations to eliminate duplication and reduce the burden of data collection. The main datasets collected include an annual trainee census, performance profiles, and an annual survey of newly qualified teachers.
Method of data collection and analysis based in Grounded Theoryprayslide
The document outlines different methods for collecting data in grounded theory research, including continuous monitoring during observations, semi-structured interviews with prepared questions, informal interviews to allow respondents to speak freely, scanning relevant documents, and taking notes from meetings and conversations. It also describes the iterative process of analyzing the data by scanning for themes, summarizing text with labels, identifying frequently used labels, weighing emerging theories, and developing mini theories through triangulation until theoretical saturation is reached.
The document outlines the steps for planning and conducting data analysis, including determining the method of analysis, processing and interpreting the data, and presenting the findings through descriptive and inferential statistical analysis techniques to answer research questions. It also discusses the components and format for writing up the final research paper, including the preliminary pages, main body, and supplementary pages.
This presentation discusses primary and secondary data collection methods. It begins by defining primary data as original data collected specifically for the research purpose, such as through surveys and interviews. Secondary data refers to data previously collected by others, such as published sources. Both data types are useful but have tradeoffs - primary data directly addresses the research question while secondary data is easier to obtain but may not be specific. The presentation provides examples of primary and secondary data collection techniques and their respective advantages and disadvantages.
Challenges of Product Managers in ICT Industry in Saudi ArabiaAbdulsalam Ghaleb
This document provides an introduction to a study on the challenges facing product managers in the ICT industry in Saudi Arabia. It outlines the background and context of Saudi Arabia's growing ICT market. The role of the product manager is discussed, as they are responsible for all aspects of a product throughout its lifecycle. The study aims to identify the key challenges product managers face, examine the relationship between performance and rewards, and understand responsibilities and career development opportunities. It will provide recommendations to help product managers and companies better navigate the Saudi market.
This document provides an overview of research writing and summarizes the typical contents and structure of a research report. It discusses the preliminary parts of a report such as the title page and table of contents. It also outlines the main body of the report including typical chapters for the introduction, literature review, research methodology, data presentation and analysis, and summary and conclusions. Finally, it notes that supplementary sections may include references, bibliography, and appendices.
This document discusses methods of data collection, including sources of primary and secondary data. It provides details on 5 methods for collecting primary data: direct personal investigation through interviews; indirect oral investigation through enumerators; local reporters and questionnaires; mailed questionnaires; and observation. Secondary data collection methods include published sources from international organizations, government publications, commercial research institutions, and unpublished sources. The key difference between primary and secondary data is that primary data is collected directly by the researcher specifically for the research problem, while secondary data was originally collected by others for different purposes.
This document discusses data collection and analysis tasks. It defines these tasks as gathering real-world information to study a problem and come up with a solution. It describes two types of data collection tasks - collecting original data through surveys, interviews, or sensors, and finding existing data sets online or elsewhere. It provides examples of data collection tasks in various subjects and describes tools that can be used, including sensors, survey tools, and instant response systems.
1) The document discusses qualitative data collection and analysis methods, including grounded theory, coding, categorization, triangulation, and interpretation.
2) Grounded theory involves constant analysis of data through four stages: comparing incidents, comparing changes, delimiting the theory, and forming a systematic substantive theory.
3) Triangulation involves using multiple data sources and methods to strengthen findings, and can occur at the data, investigator, methodology, theoretical, or time/location levels.
project on research methodology n data analysis asha mishra
(1) Brands are moving from the periphery of business to the strategic core, where they can create new forms of value.
(2) At the core, brands act as hubs that feed innovation and create networks between the company and customers.
(3) This positions brands and brand teams as key players that determine how to create and grow customers, shaping marketing, products, and business strategy.
This document outlines the outputs and contents of a Social Impact Assessment (SIA) report. The SIA report will include a Community Development Plan that describes the theory of change for addressing social issues and mitigation measures for potential negative impacts. It will also include a Community Monitoring Plan for tracking progress. The SIA report itself will describe the project, stakeholders, baseline social conditions, potential social impacts with and without the project, and a plan for community impact monitoring. It emphasizes collecting quantitative and qualitative data to describe the current social context and design an effective monitoring program.
Organisation Change, Management Development & Communications Consulting and T...journal72
Its services include organization analysis, strategy analysis, people analysis, systems analysis, and transformation programs to drive successful organization changes.
This document discusses the collection and presentation of data in economics. It defines data as quantitative information providing facts in an aggregate manner that is useful for decision making. Data has certain features - it is the aggregate of facts, expressed numerically, influenced by multiple causes, and collected for a predetermined purpose. The document outlines the importance of data in economics for areas like economic planning, determining national income, and forming government policies. It distinguishes between primary data, which is originally collected, and secondary data, which has already been collected by others. Various methods of collecting primary data and sources of secondary data are also described.
The document outlines a workshop on workforce analysis and planning. It discusses identifying and collecting workforce data, developing current and future workforce profiles, conducting gap analyses to identify differences between current and future needs, and developing solutions, strategies, and implementation plans. The agenda includes developing workforce profiles using tools like tables, charts, and spreadsheets to analyze and display key workforce metrics and trends.
This document provides an overview of key concepts for data gathering and analysis in interaction design. It discusses techniques for interviews, questionnaires, observations, and the analysis of both qualitative and quantitative data. The goal is to understand users and inform the design process. Techniques covered include interviews, questionnaires, observations, analysis frameworks like grounded theory, and presenting findings.
Data collection and analysis tools refer to methods used to systematically gather and examine information. This includes statistical software packages, specialized computer programs, and online testing systems. Popular tools include SPSS, Stata, and R programming language. Computer-based testing systems allow electronic assessment and tracking of student performance. Electronic gradebooks make it easy for teachers to calculate and track student grades digitally. Student response systems engage students in real-time feedback and assessments through interactive technology. Online testing with feedback immediately informs students of correct answers and provides explanations.
This document outlines an agenda for a workshop on best practices for using Moodle. The workshop introduces evaluation tools to identify instructional design deficiencies in online courses. Participants will learn how to evaluate online courses based on sound pedagogical practices. The agenda includes introductions, a presentation on instructional design and evaluation tools, small group case studies where participants apply the tools, and a large group discussion.
Footholds and Foundations: Setting Freshmen on the Path to Lifelong Learningannielibrarian
This document summarizes the development and results of a software tool created to assess student learning from library instruction sessions at the University of North Texas. The software allows for anonymous pre- and post-testing of students to measure changes in skills like database searching and finding help from a librarian. Analysis found a 33.2% increase in students' ability to search an academic database, and decreases in library anxiety and ability to find librarian help between pre- and post-tests. The assessment tool is being offered for other institutions to use.
This document discusses challenges with qualitative and quantitative data collection in school counseling and provides tips for effective use and presentation of data. It addresses:
1) Common types of qualitative data counselors collect and how to code it to find patterns and themes.
2) Potential pitfalls of quantitative data like non-response bias and issues with reliability/validity.
3) Strategies for presenting qualitative and quantitative data together using tools like Sign-Up Genius, Google Forms, Survey Monkey, and mandatory surveys. The goal is to use mixed methods and data to improve counseling programs and services.
Profound Academy is an educational platform that provides hands-on computer science materials for high schools, universities, and coding bootcamps. It aims to simulate a fully hands-on learning environment through automated checking and evaluation of student code submissions as well as an AI assistant to answer questions and provide feedback. The platform's customizable multi-language teaching materials and analytics capabilities help optimize the teaching and learning experience while saving teachers time.
Peerwise and students’ contribution experiences from the fieldLenandlar Singh
This document summarizes an experiment using the PeerWise online tool to implement Contributing Student Pedagogy in two Introduction to Object Oriented Programming courses. Students were asked to create and answer multiple choice questions, and were given a small percentage of course marks based on their participation. Analysis of the data found that students contributed more questions and answers than expected and enjoyed using the tool. While most metrics of participation were not strongly correlated with exam performance, students who answered more questions correctly did tend to score higher on the final exam. Based on the positive student feedback, the author believes PeerWise is an effective tool to support Contributing Student Pedagogy.
The Mindful Instruction Librarian and the "One-Shot"Meredith Farkas
The document summarizes a presentation by Meredith Farkas on moving beyond one-shot library instruction sessions. It discusses limitations of the one-shot model and alternatives like flipped instruction, workshops, and embedding instruction into courses. Farkas emphasizes building relationships with faculty, participating in curriculum development, and creating learning objects like tutorials. She provides examples from her work at Portland Community College developing information literacy outcomes and collaborating with developmental education faculty. The presentation also covers reflective practice, communities of practice among librarians, and implications of the Framework for Information Literacy.
The document discusses developing a learning analytics company that analyzes student work on a continuous basis to provide personalized feedback and learning content tailored to each student's strengths and weaknesses. It outlines how the company would aggregate performance data across subjects, concepts and time to generate personalized learning records, feedback and recommendations to help students improve. The theoretical basis and desired service specifications are also described.
Seeking Evidence of Impact: Answering "How Do We Know?"EDUCAUSE
This document summarizes a presentation by Veronica Diaz, Associate Director at EDUCAUSE Learning Initiative, on seeking evidence of the impact of teaching and learning innovations. The presentation reviewed strategies for effectively using evaluation tools to determine the impact on teaching practices and ways to report results. Evaluation methods discussed included questionnaires, interviews, observations, and using a mixed methods approach. Challenges included knowing where to begin measuring impact and how to analyze and communicate results. The presenter emphasized using evaluation evidence to improve teaching practices and shared lessons from the Wabash National Study on conducting assessments and facilitating improvements based on evidence.
This document discusses assessment methods in blended learning. It begins with defining blended learning as the deliberate integration of online and face-to-face learning. Some benefits of blended learning mentioned are higher student retention, improved outcomes, meeting diverse learning styles and needs, and strategic use of classroom time.
The document then defines assessment as evaluating who, what, when, how, and why to assess in a course. Different types of assessment are discussed, including diagnostic, formative, and summative assessment. Assessment tools available for blended learning are also outlined.
The rest of the document covers how assessment differs in blended learning due to increased flexibility and personalization. Challenges of assessment in blended learning are mentioned, such as
The document discusses using instructional rounds and flip videos to focus on student engagement. Administrators will begin book studies, introduce instructional rounds, and build common language. Rounds involve identifying problems, observing classrooms, and debating solutions. Videos from different schools will be shared and analyzed for levels of student engagement. The goal is to strengthen teaching and increase student achievement through engaging tasks and activities.
The document summarizes key points from a presentation on designing online course assessments. It discusses foundations of online assessment including validity, reliability, and alignment. It also covers developing assessments, such as specifying objectives, selecting appropriate assessment types, and ensuring alignment between objectives, activities and assessments. Finally, it addresses creating an assessment toolkit, including choosing appropriate tools, criteria, and ensuring privacy compliance.
The document discusses strategies for improving student success in online programs through effective faculty members. It outlines four key strategies: 1) Educating and certifying faculty in online teaching methods; 2) Providing students with support materials to set them up for success; 3) Leveraging assessments to evaluate student and faculty performance; 4) Conducting periodic evaluations of faculty to provide feedback and opportunities for improvement. Implementing these strategies can help ensure faculty members are effective in promoting student success in online learning environments.
The document discusses various frameworks and tools used to evaluate assistive technology needs, including the SETT Framework, WATI assessment tools, QIAT indicators, and the Toolbelt Theory. It provides an overview of how an assistive technology evaluation team should be comprised and consider the student, environment, tasks, and tools. A variety of assessment forms, checklists, and guidelines are presented to guide the evaluation and decision-making process.
The document provides an overview of student assessment for a high school. It discusses what assessment is, the assessment process, importance of assessment, functions of assessment, methods of assessment, criteria for choosing assessment methods, and who should be involved in assessment. It also summarizes different types of assessments including informal assessment, formal assessment, portfolios, rubrics, and concept mapping.
This file accompanies the "Creating Assessments" session at the Academic Impressions conference titled "A Comprehensive Approach to Designing Online Courses", Dec 3-4, 2007, Austin TX
Presentation on large-scale e-Learning for Educators online professional development program and research with online training and courses by EdTech Leaders Online at EDC.
This document provides guidance for online facilitators on best practices for facilitating online courses. It discusses principles for good practice in undergraduate education, the role and time commitment of online facilitators, modeling effective behaviors, being present and engaging with students, asking effective questions, identifying at-risk students, and following school policies and procedures.
This document outlines an agenda for a Dream Team Training. It includes sections on welcome and introductions, background about the program, components of video lessons, available resources and support, and a question and answer period. The training covers how to create effective video lessons to demonstrate math and science concepts. Teachers will learn about lesson plan templates, rubrics, and including elements like guided practice in their videos. Resources provided include tablets, video editing software, templates, books, and standards documents. Support is available from instructional and design experts, as well as other teachers participating in the program. Next steps discussed are creating example videos, prioritizing standards, scheduling coaching, and an upcoming webinar.
Similar to Data Collection and Analysis Tools Report (20)
The document provides information about a class project on data collection and analysis tools. It notes that the class has 25 students, with 14 girls and 11 boys, and 30% from the college of human kinetics. The class learns best through a mix of lectures and activities since they are energetic and kinesthetic learners. The learner objectives are for students to be able to name and describe 5 out of 10 tools, discuss the impact through a diagram of advantages and disadvantages, create a diagram representing the tools' importance as teachers, and utilize one tool in their own fields.
This rubric evaluates documents on content, graphics and layout, and criteria for excellent, very good, satisfactory, and needs improvement work. For content, excellent work has clear objectives and accurate information, complete citations, and ideas are fully summarized. Graphics and layout are excellent if fonts and visuals enhance readability and content, with smooth transitions between sections and an effective layout. Work needs improvement if objectives are unclear, information is missing or inaccurate, citations are incomplete, or ideas are not well summarized.
This rubric evaluates oral presentations based on three traits: nonverbal skills, verbal skills, and content. For nonverbal skills, presenters are scored on eye contact, body language, and poise. Verbal skills examines enthusiasm, elocution. Content focuses on subject knowledge, organization, and mechanics such as spelling and grammar. Strong presentations demonstrate direct eye contact, fluid body language, relaxed poise, enthusiasm about the topic, clear elocution, full subject knowledge to answer all questions, logical organization, and no errors. Weaker presentations lack these traits.
This document lists 5 items: a handout cover, logo, template, keyboard inside, and souvenir label. It provides a brief inventory of various printed materials without descriptions of each item.
This document discusses various items including a handout cover, logo, template, keyboard, and souvenir label. It lists these items without providing any additional context or details about them.
The document outlines plans for a photoshoot project aimed at nation-building through exploring Philippine culture and history. It lists several reminders and requests for the event, including bringing food, drinks, speakers, towels and student IDs. It also requests a P200 contribution from participants to cover costs of the photoshoot and activities. The goals of the photoshoot are described as getting a feel for the process, figuring out logistics, seeing how far they can go with love and sacrifice, exploring Manila, and inspiring learning about the country.
1) The document provides the grades for 10 students in an EDUC190 course, including their scores on tasks, discussions/quizzes, attendance, and final grades.
2) Most students (50%) received a grade of B, while 10% received an A and 20% received a C. One student received a D and one received an E.
3) The course included tasks (30% each), discussions/quizzes (6% each), attendance (10%), and the final grade was calculated as a percentage of the total score.
This document summarizes the computation of grades for 10 students in an education course. It includes each student's name, ID number, scores on two tasks, scores on five discussions and two quizzes, attendance score, total score, final grade, and grade. Grades are determined on a scale of A to E, with percentages for each grade range provided.
This document appears to be a storyboard outline for a website or digital project containing 6 sections: a header, home page, profile, profile 2, archive, and an entry section. The document lists section names but provides no other details about the content or purpose of each section.
1. Special Agents Training Data Collection & Analysis Tools 08.11.10 Facilitators: Jessica Macaraeg, Paulina Miranda, Angelo Rosario, Angelene Sta. Maria
2. Transcript Analysis Tools What are Transcript Analysis Tools? Facilitator: AngeleneSta. Maria Data Collection & Analysis Tools
3. What are Student Response Systems? Student Response Systems They allow instructors to ask questions and gather students' responses during a lecture. Facilitator: Paulina Miranda Data Collection & Analysis Tools
4. What are they for? Student Response Systems Facilitate Class Discussion Guide Lectures Encourage Peer Instruction Collect Data and Perform Formative Assessment Offer Quizzes and Exams Take Attendance Facilitator: Paulina Miranda Data Collection & Analysis Tools
38. Parents become more involvedFacilitator: Angelo Rosario Data Collection & Analysis Tools
39. What are electronic gradebooks? Electronic Gradebooks Facilitator: Jessica Macaraeg They are used to record pupils' grades, attendance and other data which is then made available online to parents, students and administrators. Data Collection & Analysis Tools
43. Access to grades Facilitator: Jessica Macaraeg Data Collection & Analysis Tools
44. Disadvantages Electronic Gradebooks Teachers: need to update it frequently. Parents: Failure of interpretation Students: Invasion of privacy Schools: Potential problem of hackers Schools: costly Facilitator: Jessica Macaraeg Data Collection & Analysis Tools
45. Electronic Gradebooks Create gradebooks using excel Facilitator: Jessica Macaraeg Data Collection & Analysis Tools