Download to read offline


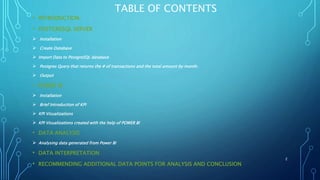
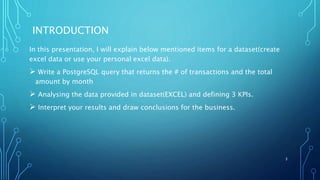

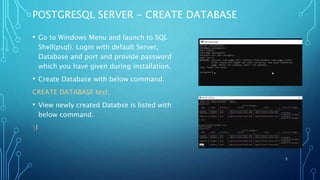
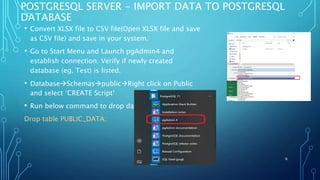
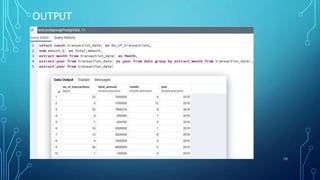


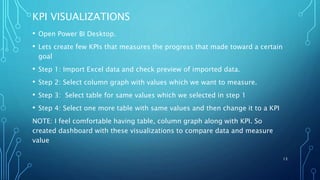
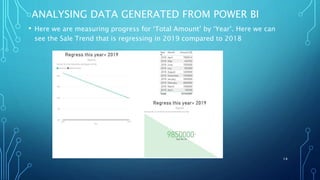
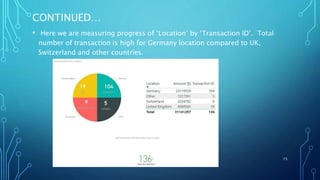
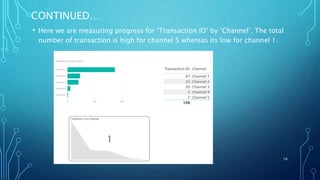


This document discusses analyzing transaction data from a PostgreSQL database using Power BI. It includes instructions on installing PostgreSQL and Power BI, importing transaction data into a PostgreSQL database, writing a query to retrieve the number of transactions and total amount by month, defining 3 KPIs in Power BI using the transaction data, and interpreting the results to draw business conclusions. Key findings include that the total amount in 2019 was less than 2018, transactions were higher in Germany than other countries, and channel 5 had the most transactions.