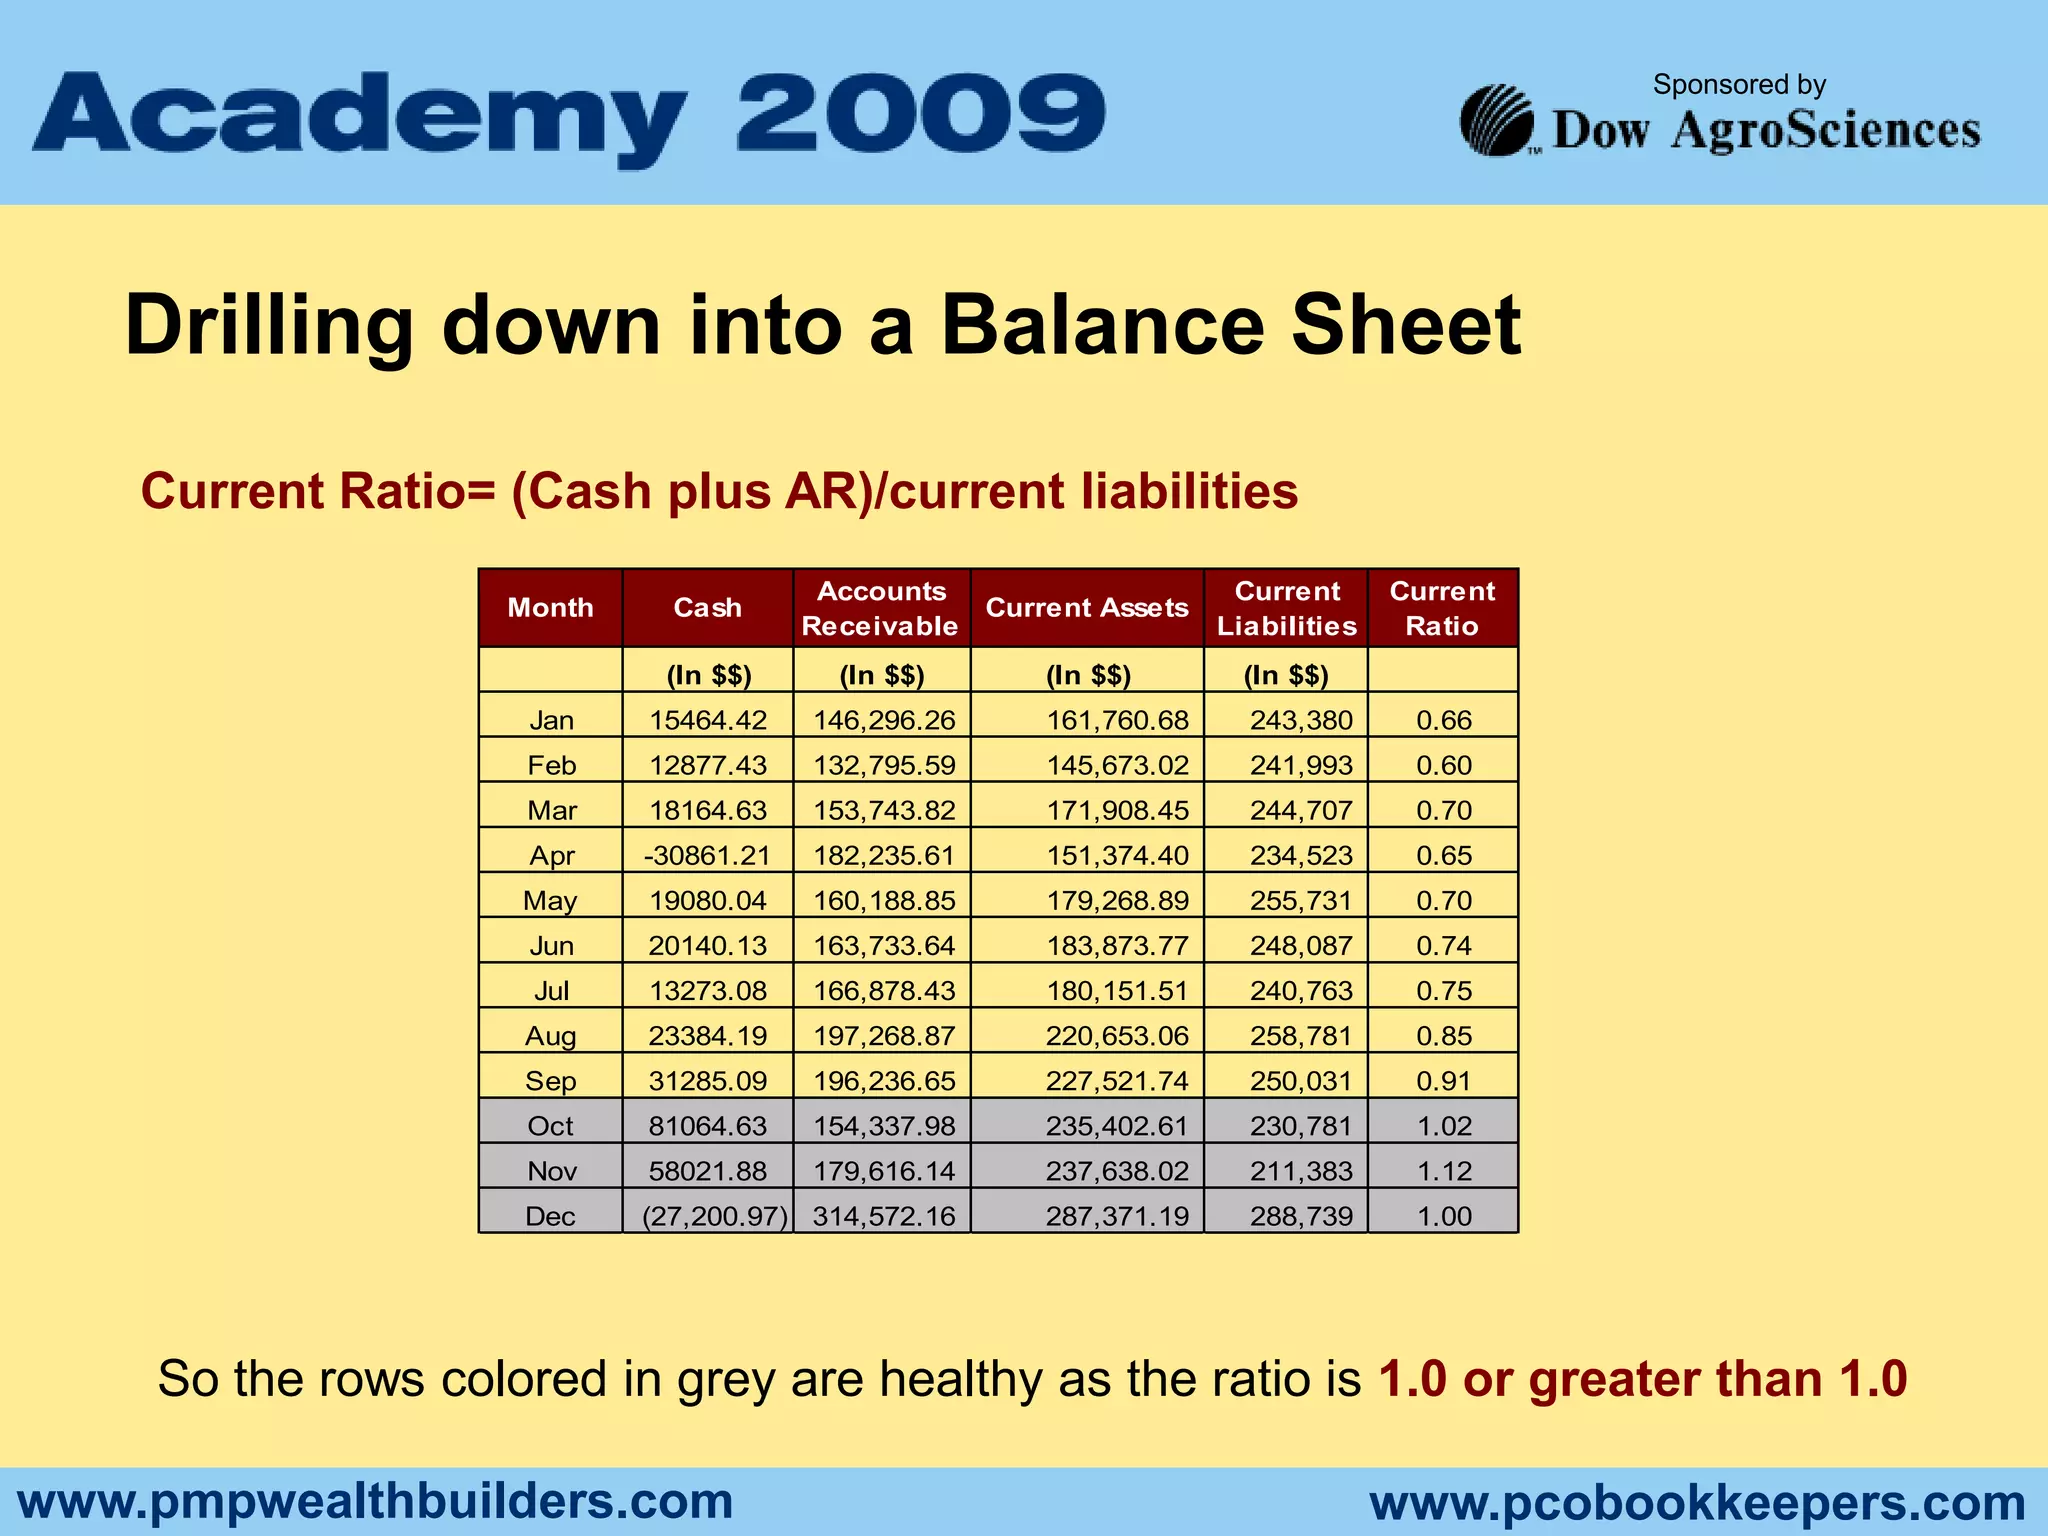
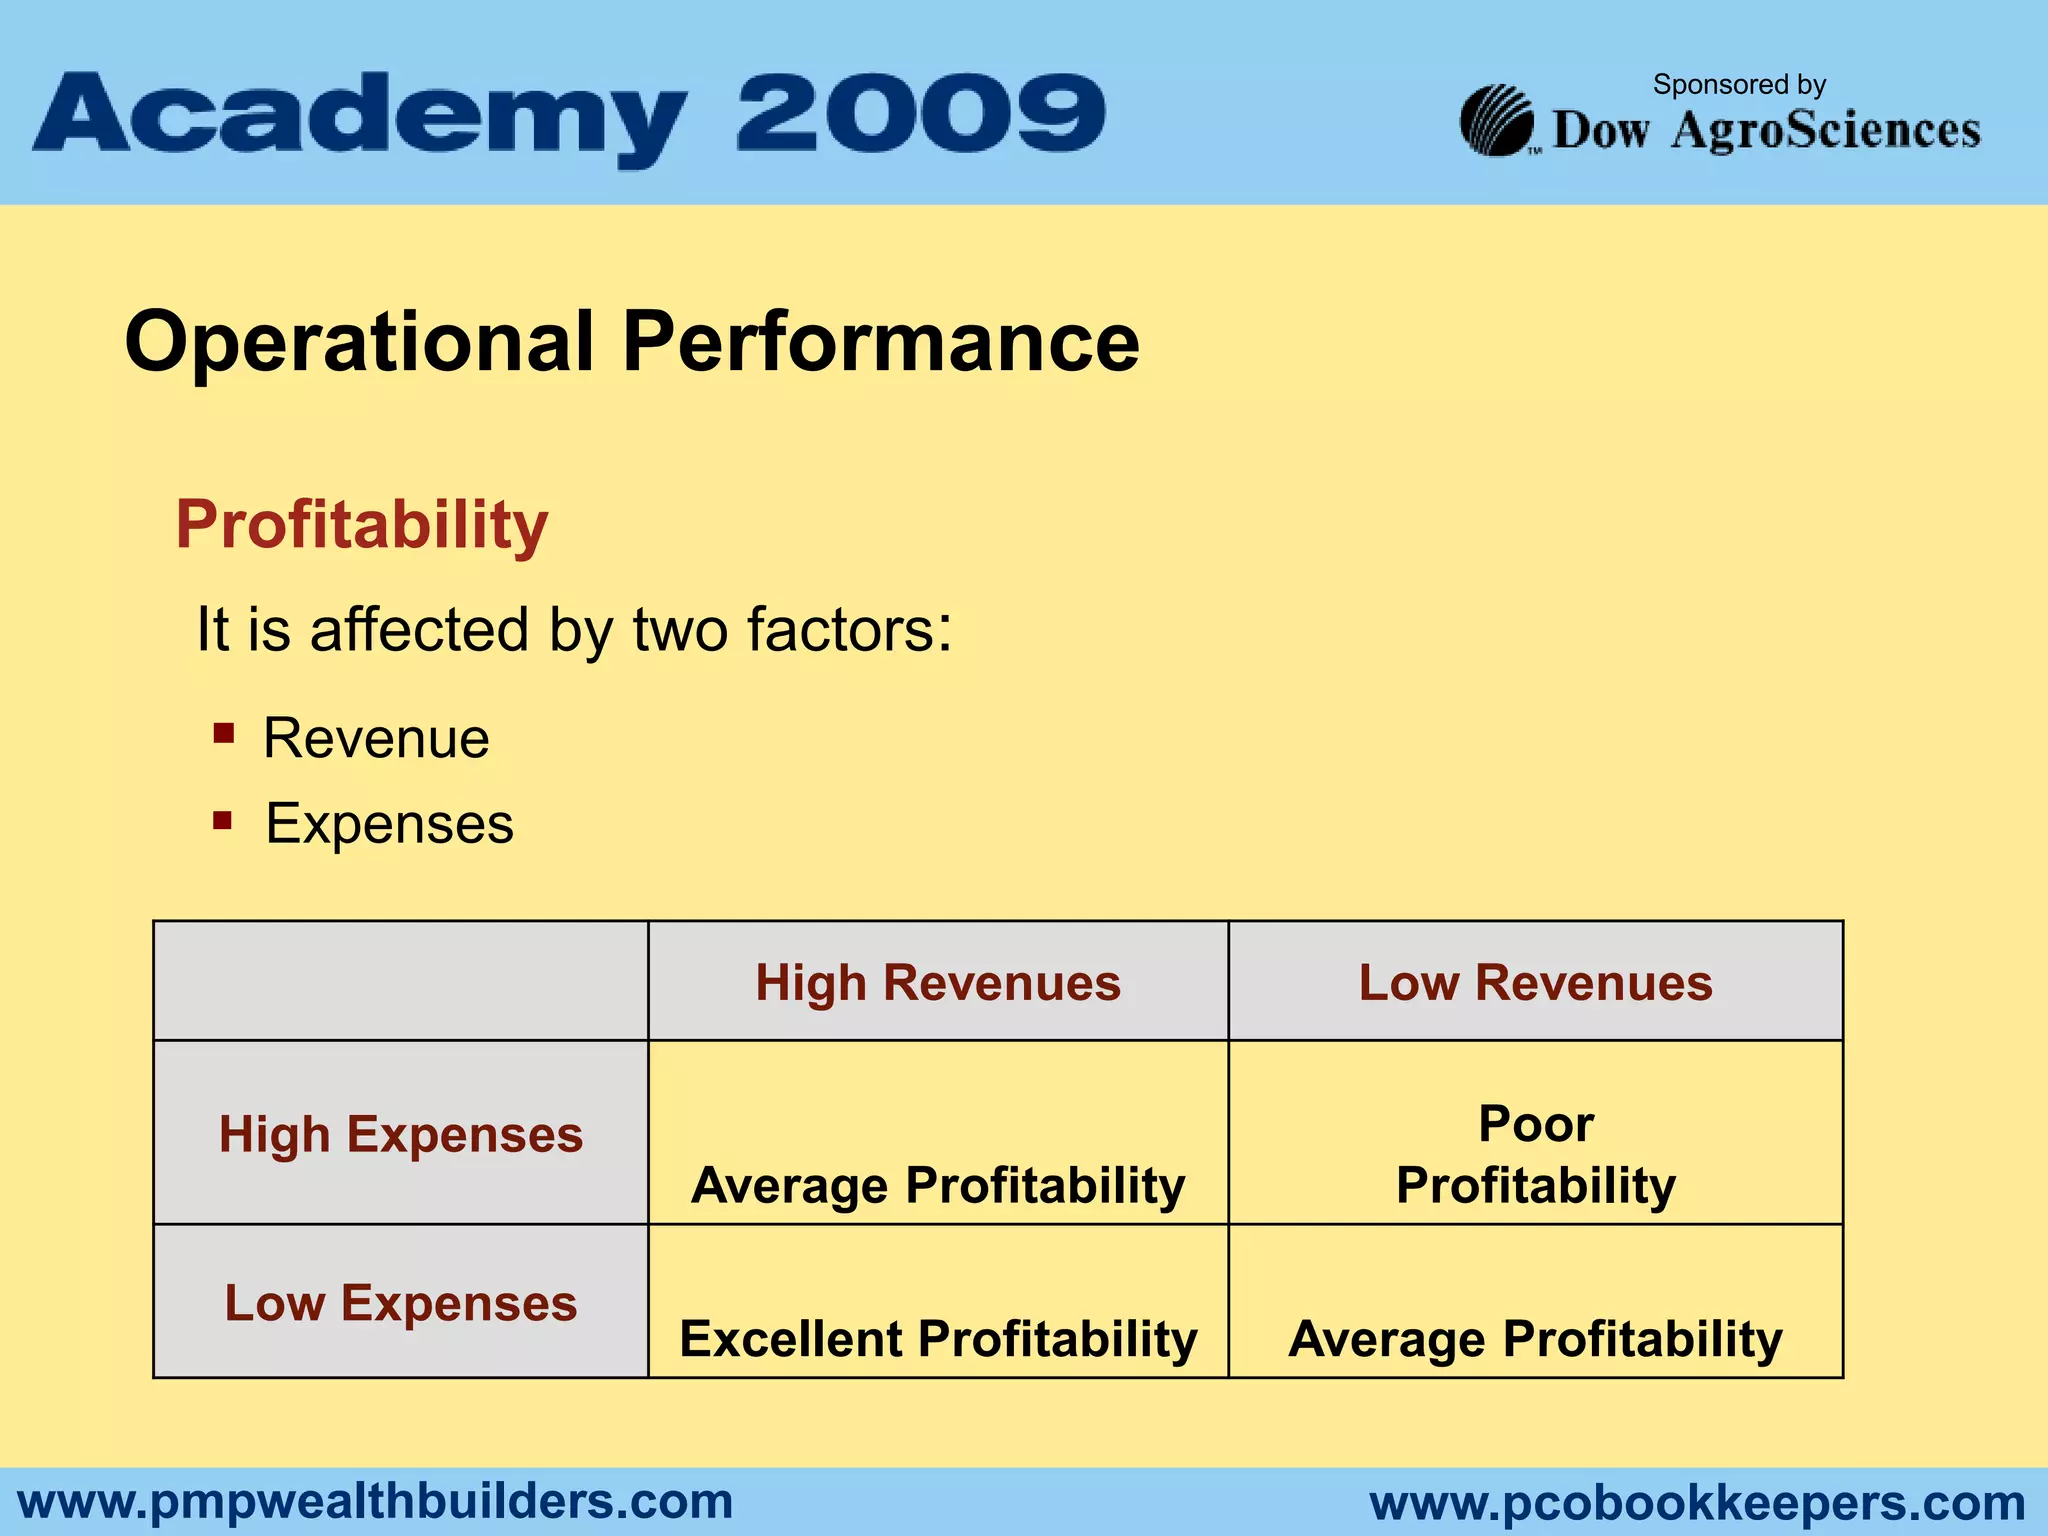
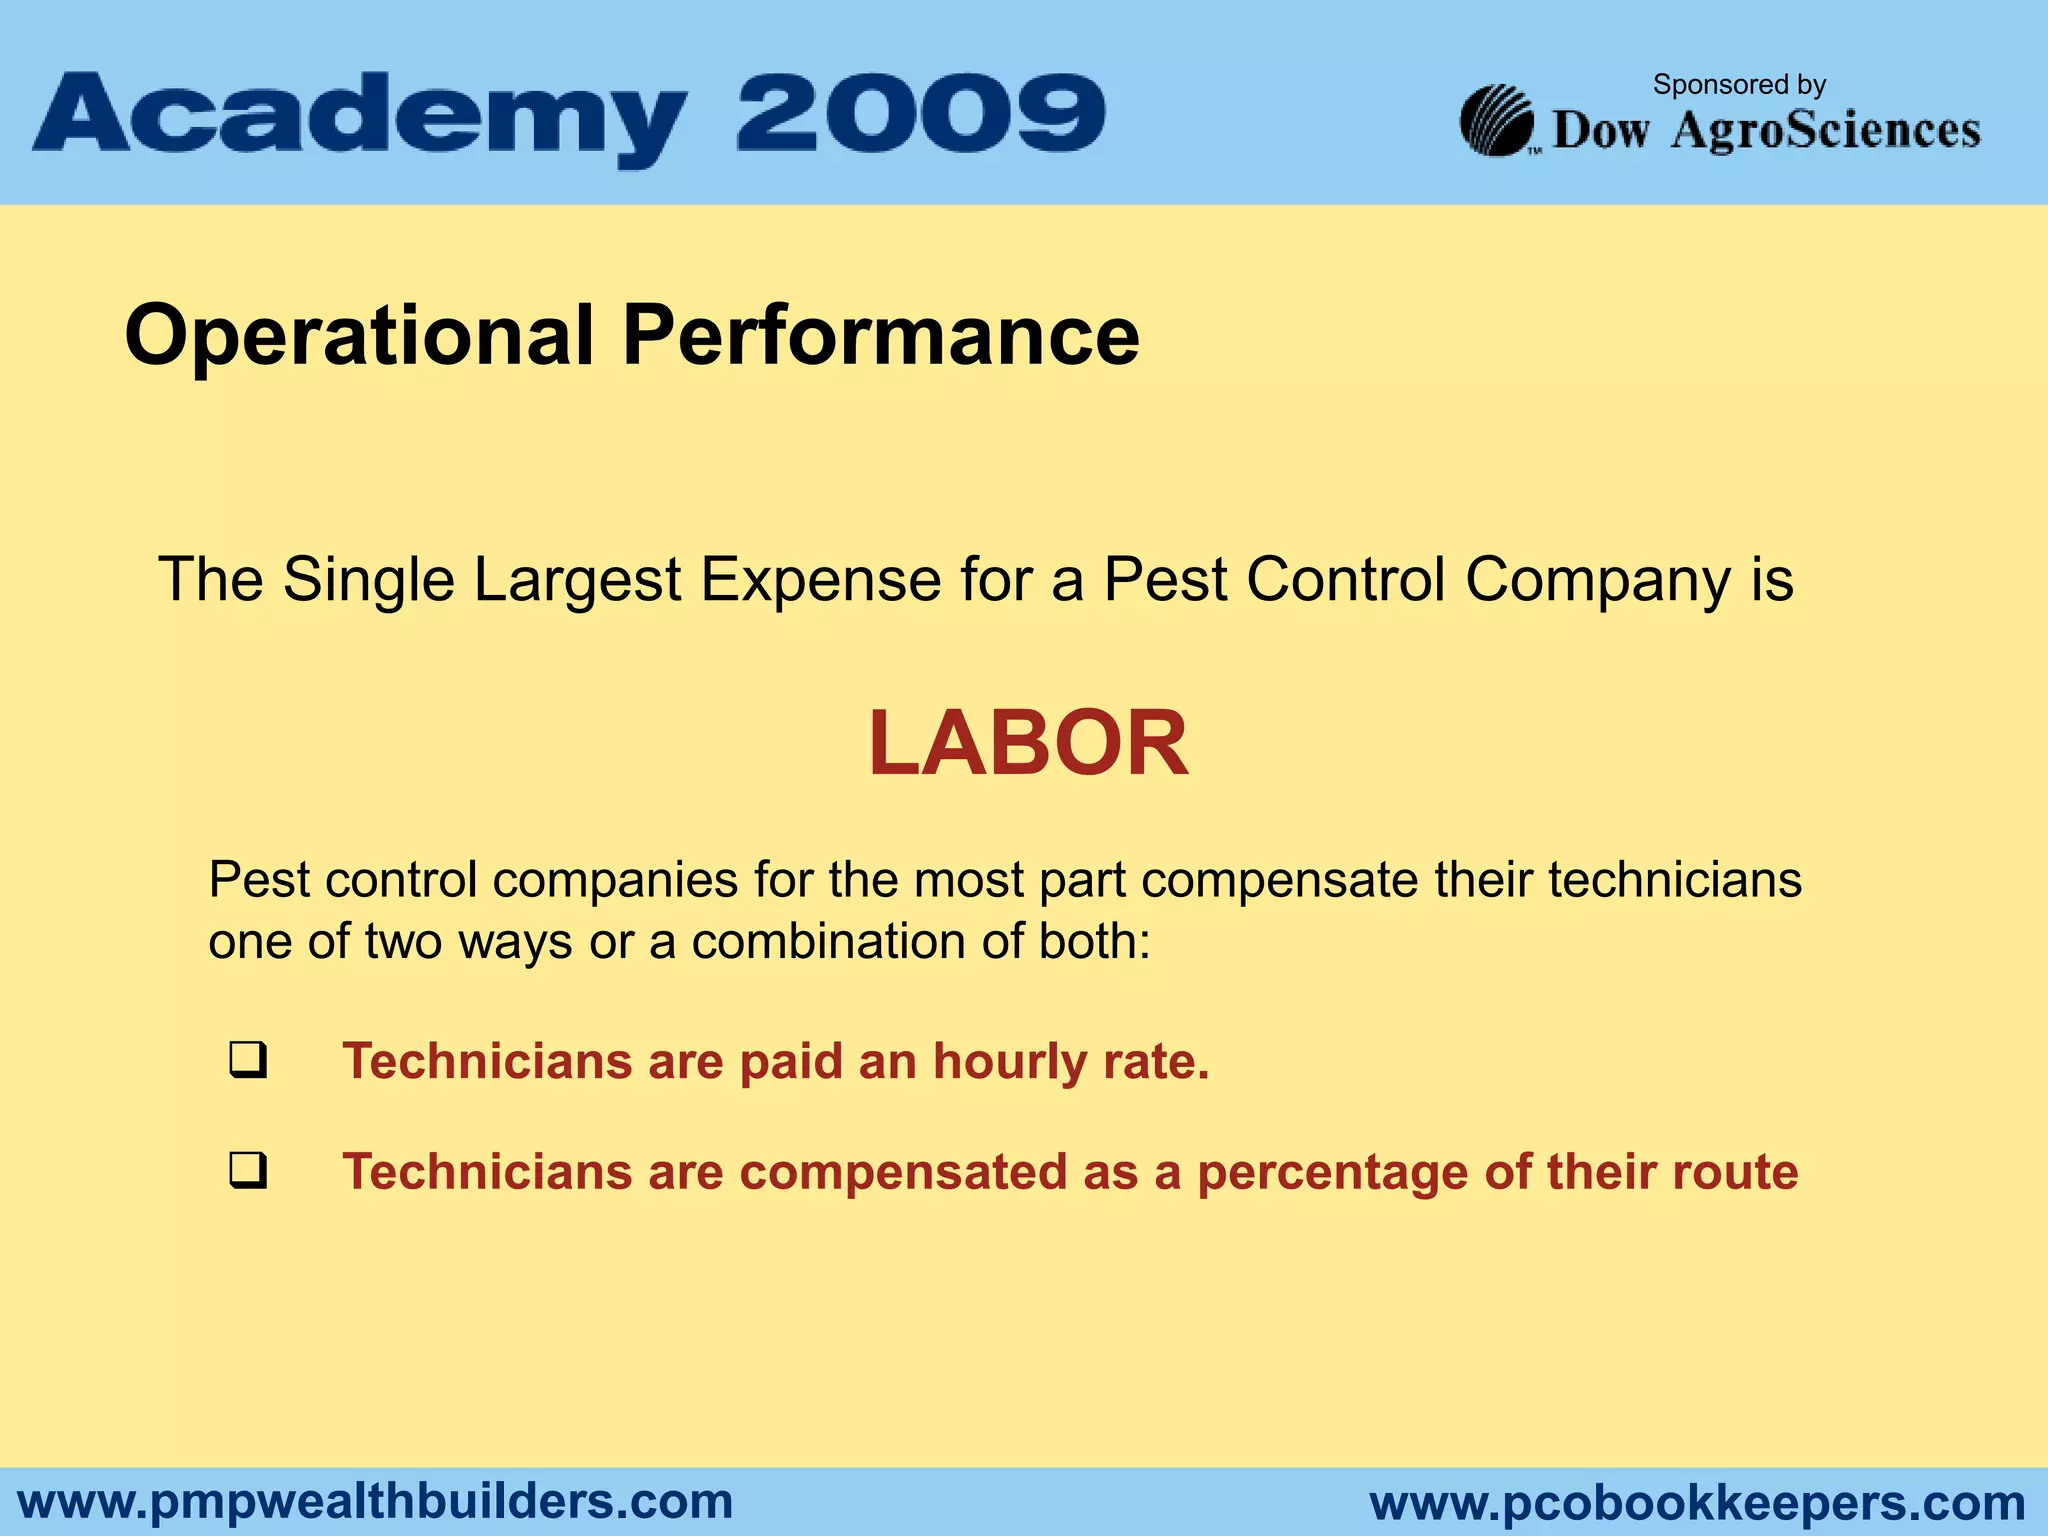
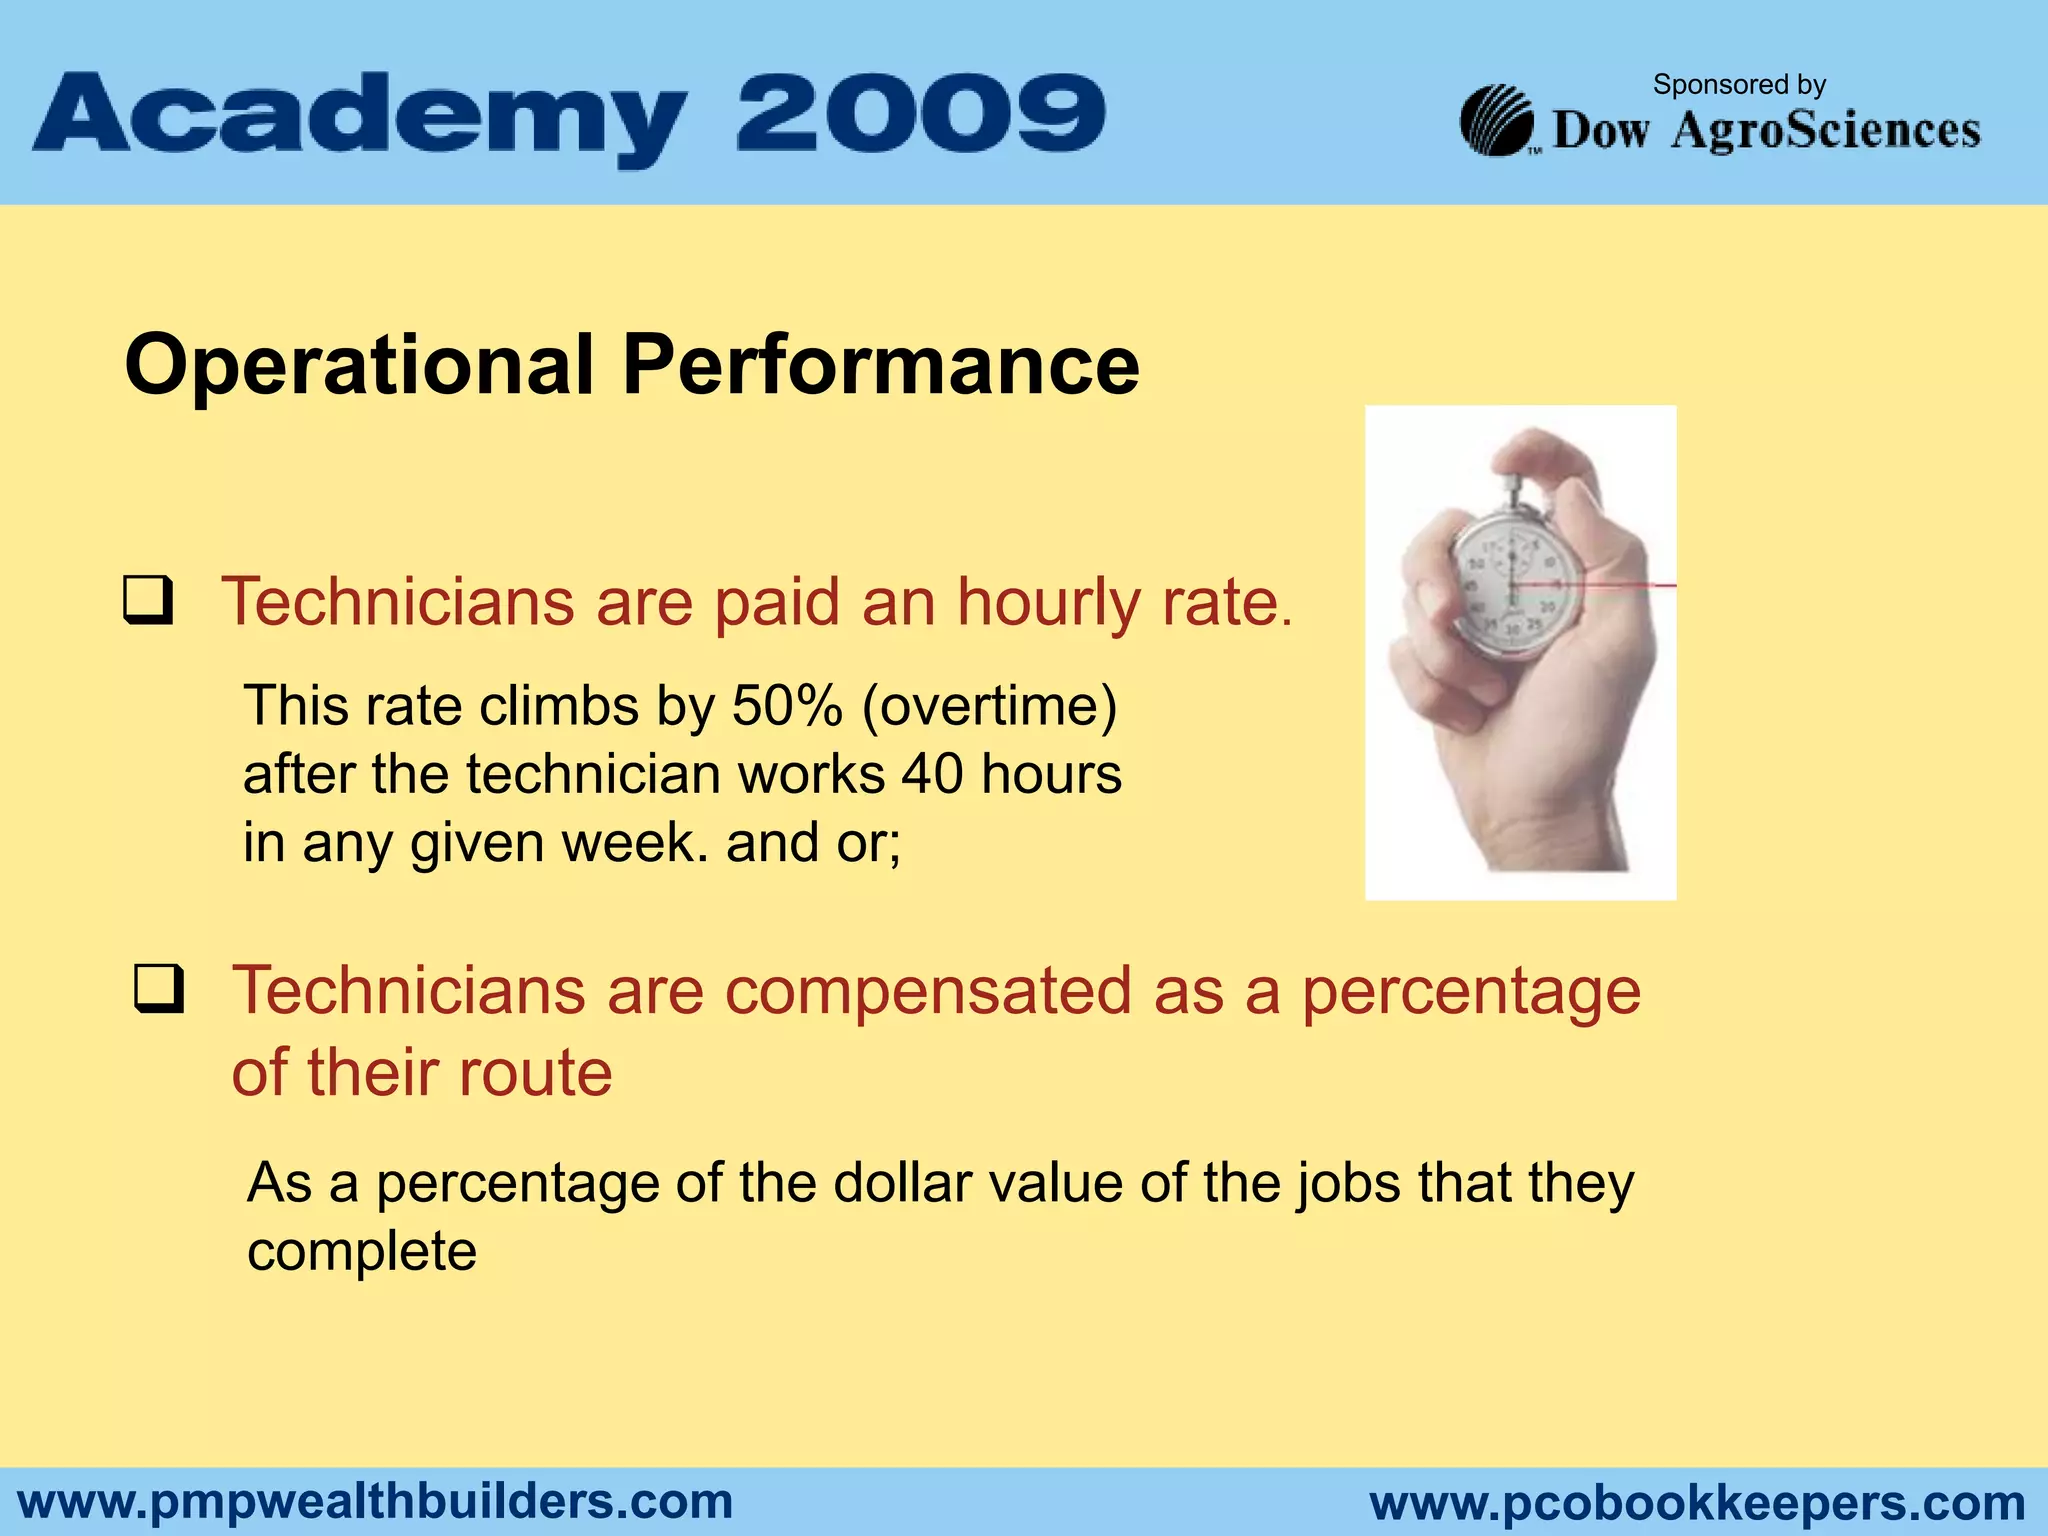
If You Can’t Measure it,You Can’t Manage itDaniel S. Gordon, CPA
OverviewCan We SURVIVE this economy?Let’s Grow Our Business – What Resources are Required?Let’s Measure:Financial PerformanceMarketing PerformanceSales PerformanceOperational PerformanceCase Study: Pricing your Pest Program for ProfitYour Next Steps
Can we survive this economy?Major events of 2008Stock Market CollapseHousing CrisisRecord Prices at the PumpImplosion of the Auto IndustryMeltdown of Financial ServicesExodus of ManufacturingOur Great Nation is involved with 2 wars
Can we survive this economy?But hold on – NOT SO FAST!!!  We can still succeed…America is the strongest economy in the world!Spending doesn’t stop because we don’t have moneyWe go into debt to get what we want.  It’s not good for the long term but it will help to pull us out short termWe are a nation of spenders helping to keep the economy movingMost of the rest of the world are saversContd…
Can we survive this economy?Americans find ways to put “stuff” with consumers.
Never Count out The U.S. Consumer!!
Can’t afford a vacation home?  Carve one up… buy a time share
Can’t afford to buy a car?  Lease one
Don’t have money for merchandise at the department store?  Get a credit card at the cash register and receive a discountCan we survive this economy?What ADVANTAGES do we have as PCOs?Fuel Prices have dropped significantlyOur Services are need based and sometimes mandated by lawIn most areas of the country we are seasonal, we are used to managing downturns.  The winter comes every year – doesn’t it?Long before the recession, experts have predicted the U.S. will become a service economy.  Here we are in service businesses and we have a big head start!No matter what your political views, you can’t argue the fact that the government is implementing the largest stimulus program in history - over 750 billion dollars.  This money will ultimately trickle down.For the most part our costs are variable, we can make drastic changes quickly (not always an easy decision but it can be done)
Can we survive this economy?Can we survive?YES… and the strong companies		will emerge STRONGER!Is it going to be tough?  YesIs it going to take a long time?  PossiblyIs time going to pass no matter what we do? Yes, so we should get to work!
How do we weather the storm?PREPARE for the recession to be long and deep and then build flexibility to adjust when neededMake sure you have TIGHT  ROUTES.  You may not be able to raise prices but tight routing has the same effect as raising pricesNEVER SELL UNPROFITABLE WORK on the basis of “its steady work”… Shrink your business if you have to.Make sure you have an accounting system that gives you accurate and timely INFORMATION
How do we weather the storm?MEASURE the results of all your programs and increase the profitable services and decrease the unprofitable services
Increase your COLLECTION efforts – make sure you’re A/R is healthy and collectable
Tighten your CREDIT TERMS – shut customers off if needed
Increase your SALES & MARKETING effort – be effective!!
Get ready for the upturn!!  Create your 5 year plan; and EXECUTE!Let’s Grow Our BusinessWhyare we in Business?To maximize the value of Our Business…. Period!There is no other reason !!
Let’s Grow Our Business  In Maximizing the value of our business we:Create a great Place to Work
Increase Salaries & Benefits
Create Job Security
Do business in a Socially Responsible MannerLet’s Grow Our BusinessFirst lets go over how we run a successful Pest Control FirmThe Pest Management business model is Simple  (Not Easy But Simple)We are in a Service Business and Sell our Time.This time that we charge for includes:Diagnosing the ProblemProviding a solutionSetting the Customer up on a Service ContractDoing the Same thing Over and over until you have built a route or several routes.
Let’s Grow Our BusinessThe Customer List (Your most Valued Asset)Long Term – Can be compared to machinery in a manufacturing business:Must be “well oiled” by providing great ServiceRoutes must be tight allowing for the greatest output from this machineShort Term -  Can be compared to a life insurance Salesman setting up a book of renewable policies that generate current income.
Let’s Grow Our BusinessYou need a Plan…The plan must focus on growing	your customer list as well as selling 	more to existing customersThis is the Asset that will spit out the profits.Remember- The PCO business is not a high margin business.  Rather it is a moderate margin business where you generate high profits from customers that use your service on a scheduled recurring business
Let’s Grow Our BusinessFuture Customer Acquisition Requirements  Target Annual Revenue Per Customer: $500.00
  Cost To Acquire 1 New Customer (average): $250.00
  Expansion Goals: Double Revenues over 4 Yrs (20% per Yr)
  Assume 100% retentionLet’s Grow Our BusinessMoney RequirementsIf more People or Equipment is Required For Expansion, How does it get Paid For?Several Options Exist:Through Daily Operations & Cash Flow
Through Financing (i.e Bank, Finance Companies, etc.)
By Giving Up Equity (i.e. Silent Partner, Not so Silent Partner, Joint Venture)Financial Performance – Measuring The Health of Our Firm
Financial PerformanceWhat Are Financial Statements?Financial Statements are the Box Scores in the game of Business. They are the culmination of the accounting process.  They are used to convey a concise picture of the profitability and financial position of your company.
A well-designed Pest Control Profit & Loss Statement includes:Revenue 	    - 	Broken up by department with Recurring & Non-			Recurring Revenue accurately displayed  Direct Costs 	    - 	All cost associated with putting a truck on 			the road &  performing service Gross Margin 	    - 	Revenue minus Direct CostSales & Marketing  -   	All cost associated with sales and marketing 				function
A well-designed Pest Control Profit & Lossalso includes !!G & A Expenses - The cost associated with running the office. Usually these costs are fixed with regard to transacting business up to a certain level EBITA - Earnings before Interest taxes & Amortization IADT - Interest, Amortization, Depreciation & TaxesNet Income - Net Performance of the Business
 Profit & Loss Ratios & Benchmarks   Gross Margin
  Technician Labor cost as a percentage of revenue
  Chemical Cost as a percentage of revenue
  Selling Cost as a percentage of revenue
  Office Labor as a percentage of revenue
  Other G & A as a percentage of revenueDrilling down in Profit & Loss Statement Why is it so important to setup a P & L using the approach     described?  It allows us to make accurate conclusions about how our management     staff is executing our business strategy.
  It allows us to isolate revenue types that will add to the value of our     business
  It allows us to isolate expense types so that we can implement cost     controlsDrilling down into a Balance SheetThe Balance Sheet allows us to see the prior results of our operations plus any financing activity that has taken place.The P & L tells that how we are doing in terms of profit & the B/S tells us what we have as the results of those profits.
Drilling down into a Balance SheetWhat is important about B/S?  CASH!
  Accounts Receivable
  Equipment
  Credit Line & Loan Balances
  Accounts Payable
  Owners EquityDrilling down into a Balance SheetRating our Accounts Receivable  We can age our Accounts Receivable
  Current 30 days 60 Days Over 90 days with percentage     of Total  We can try to improve those percentages on monthly basis
  We can see how close we are keeping our customers     within our terms using a ratio called No of days sales in     receivables  Calculation: AR balance/(Cumulative Sales/Cumulative days)Drilling down into a Balance SheetAverage Collection Period  Calculation: (AR balance/ ( Cumulative Sales / Cumulative days)Drilling down into a Balance SheetLiquidity RatiosA Liquidity ratio is one of the benchmarks that banks, vendor creditdepartments, and others used to determine our ability to pay bills. The two that are most commonly usedCurrent Ratio= (Cash plus AR)/current liabilitiesQuick ratio= Cash/APA Ratio over and above 1.0 means we are healthy. A ratio of less than 1.0 means we have cash flow issues.
Drilling down into a Balance SheetCurrent Ratio= (Cash plus AR)/current liabilitiesSo the rows colored in grey are healthy as the ratio is 1.0 or greater than 1.0
Marketing Math for the PCO
Marketing Math for the PCOWe want GrowthHow Much? Over What Period of Time?What Resources Will We Need? Equipment, People, Money?Where Will the Growth Come From?New Customers, or More Business from Existing Customers?Is Our Current House in Order to Achieve this Growth?
Marketing Math for the PCODefine Growth – Set GoalsExample of a GoalI want to take my Business from $500,000 in Annual Revenue  to $1,000,000 in  Annual  Revenue over the next 4 Years, increasing my  profit  margin  from 12% to 20% for the same period.Not an example of a GoalI want to get Bigger.
Marketing Math for the PCOMore Business From Existing CustomersYour Customers Already Know YouThe Cost associated with expanding your relationship is significantly less than new customer acquisition.An excellent way to guarantee yourself a predictable revenue stream while allowing your customers to do predictable expense budgeting.
Marketing Math for the PCOIn defining your overall strategy, the MARKETING MIX concept is extremely useful.  It is broken into four categories known as the Four P’sof Marketing:Product Price Place Promotion
Marketing Math for the PCOPRODUCT - From a marketing prospective our product is our service.  We need to define:  The Quality The Features The Services The Warranties etc.  From a standpoint of practicality, it  makes sense that as we grow our  business we need to be uniform in our Service Plans.As our customer list grows, it will become extremely difficult to manage a  business where every customer’s service is different.  Thus, in defining our  services we should design a core group of services that are standardized.All of our technicians can be trained to work using standardized methods.  In addition our office staff is not faced with differing problems with each customer.  STANDARDIZATION OF SERVICES IS KEY!
Marketing Math for the PCO     PRICEPricing is  extremely important.You need  to price for profit. Remember our discussion on Breakeven Analysis…Understand how high the bar isthat you are trying to reach!
Marketing Math for the PCO     PLACEService Area Defined -  In designing our business we need to define our service area.  Again, if you go outside of your service area, you need to charge a lot more money in order to account for the travel time.The most profitable pest control companies have very well defined service areas.  In fact, each office has sub service areas for each route.  Sound routing methodology needs to be employed.At this point we should note that you should have well-defined  service areas that you will not breach.
Marketing Math for the PCOPROMOTIONThis is getting  the  word out.  It’s is not my intention to speak about all of the promotional concepts of marketing a pest control company.
However, we should be able to track our advertising in our computer system and generate reports that will tell us which advertising works and which does not.
Promoting your company through advertising is the single most important thing that you can do to build your company.
However, too much of the wrong type of advertising can sink  your company quickly.  By tracking which advertising is working through your computer system, you can build successful  advertising campaigns that deliver RESULTS.Sales Performance
Sales PerformanceThere are many schools of thought on how a sale should be made. Some sales techniques work better depending on the personality of the sales person.Some Sales people Sell management on why Sales can’t be made The best thing about what we do as accountants, is that the numbers don’t lie - no matter which Sales technique are used.
Sales PerformanceWhat are the important data points:  Number of leads received
  Number of leads Closed
  Number of proposals written
  Dollars Proposed
  Dollars Sold
  Closing  Percentages
  Follow Up actions Including dates
  Commission’s Earned by Sales Staff
  Base Pay For Sales PeopleSales PerformanceNumber of leads Received/ClosedSometimes we draw Conclusions based solely on the numbers.We need to distinguish between creative leads and inbound leads. as the ladder will yield much higher percentages.
Sales PerformanceBatting Average 	=     # Leads Closed                                      # Leads ReceivedPitch Efficiency 	=     # Proposals written                                           # Leads given
Sales PerformanceSales Dollars Efficiency =  	# of Dollars Sold                                                   # of Dollars Proposed
Sales Performance  Using the proposal Dates and follow-up dates we     can  age our proposals, last contact dates and make        estimates of likeliness of Closure.  What we obviously find is the older the proposal the     less likely we Close  it.  What happens if we introduce telemarketing?Sales PerformanceAND LAST BUT NOT LEAST……Sales Compensation as a percentage of Sales=Base salary + Commissions Total  Sales

Danspresentationnpmaacademy09 12566688864796 Phpapp02

  • 1.
    If You Can’tMeasure it,You Can’t Manage itDaniel S. Gordon, CPA
  • 2.
    OverviewCan We SURVIVEthis economy?Let’s Grow Our Business – What Resources are Required?Let’s Measure:Financial PerformanceMarketing PerformanceSales PerformanceOperational PerformanceCase Study: Pricing your Pest Program for ProfitYour Next Steps
  • 3.
    Can we survivethis economy?Major events of 2008Stock Market CollapseHousing CrisisRecord Prices at the PumpImplosion of the Auto IndustryMeltdown of Financial ServicesExodus of ManufacturingOur Great Nation is involved with 2 wars
  • 4.
    Can we survivethis economy?But hold on – NOT SO FAST!!! We can still succeed…America is the strongest economy in the world!Spending doesn’t stop because we don’t have moneyWe go into debt to get what we want. It’s not good for the long term but it will help to pull us out short termWe are a nation of spenders helping to keep the economy movingMost of the rest of the world are saversContd…
  • 5.
    Can we survivethis economy?Americans find ways to put “stuff” with consumers.
  • 6.
    Never Count outThe U.S. Consumer!!
  • 7.
    Can’t afford avacation home? Carve one up… buy a time share
  • 8.
    Can’t afford tobuy a car? Lease one
  • 9.
    Don’t have moneyfor merchandise at the department store? Get a credit card at the cash register and receive a discountCan we survive this economy?What ADVANTAGES do we have as PCOs?Fuel Prices have dropped significantlyOur Services are need based and sometimes mandated by lawIn most areas of the country we are seasonal, we are used to managing downturns. The winter comes every year – doesn’t it?Long before the recession, experts have predicted the U.S. will become a service economy. Here we are in service businesses and we have a big head start!No matter what your political views, you can’t argue the fact that the government is implementing the largest stimulus program in history - over 750 billion dollars. This money will ultimately trickle down.For the most part our costs are variable, we can make drastic changes quickly (not always an easy decision but it can be done)
  • 10.
    Can we survivethis economy?Can we survive?YES… and the strong companies will emerge STRONGER!Is it going to be tough? YesIs it going to take a long time? PossiblyIs time going to pass no matter what we do? Yes, so we should get to work!
  • 11.
    How do weweather the storm?PREPARE for the recession to be long and deep and then build flexibility to adjust when neededMake sure you have TIGHT ROUTES. You may not be able to raise prices but tight routing has the same effect as raising pricesNEVER SELL UNPROFITABLE WORK on the basis of “its steady work”… Shrink your business if you have to.Make sure you have an accounting system that gives you accurate and timely INFORMATION
  • 12.
    How do weweather the storm?MEASURE the results of all your programs and increase the profitable services and decrease the unprofitable services
  • 13.
    Increase your COLLECTIONefforts – make sure you’re A/R is healthy and collectable
  • 14.
    Tighten your CREDITTERMS – shut customers off if needed
  • 15.
    Increase your SALES& MARKETING effort – be effective!!
  • 16.
    Get ready forthe upturn!! Create your 5 year plan; and EXECUTE!Let’s Grow Our BusinessWhyare we in Business?To maximize the value of Our Business…. Period!There is no other reason !!
  • 17.
    Let’s Grow OurBusiness In Maximizing the value of our business we:Create a great Place to Work
  • 18.
  • 19.
  • 20.
    Do business ina Socially Responsible MannerLet’s Grow Our BusinessFirst lets go over how we run a successful Pest Control FirmThe Pest Management business model is Simple (Not Easy But Simple)We are in a Service Business and Sell our Time.This time that we charge for includes:Diagnosing the ProblemProviding a solutionSetting the Customer up on a Service ContractDoing the Same thing Over and over until you have built a route or several routes.
  • 21.
    Let’s Grow OurBusinessThe Customer List (Your most Valued Asset)Long Term – Can be compared to machinery in a manufacturing business:Must be “well oiled” by providing great ServiceRoutes must be tight allowing for the greatest output from this machineShort Term - Can be compared to a life insurance Salesman setting up a book of renewable policies that generate current income.
  • 22.
    Let’s Grow OurBusinessYou need a Plan…The plan must focus on growing your customer list as well as selling more to existing customersThis is the Asset that will spit out the profits.Remember- The PCO business is not a high margin business. Rather it is a moderate margin business where you generate high profits from customers that use your service on a scheduled recurring business
  • 23.
    Let’s Grow OurBusinessFuture Customer Acquisition Requirements Target Annual Revenue Per Customer: $500.00
  • 24.
    CostTo Acquire 1 New Customer (average): $250.00
  • 25.
    ExpansionGoals: Double Revenues over 4 Yrs (20% per Yr)
  • 26.
    Assume100% retentionLet’s Grow Our BusinessMoney RequirementsIf more People or Equipment is Required For Expansion, How does it get Paid For?Several Options Exist:Through Daily Operations & Cash Flow
  • 27.
    Through Financing (i.eBank, Finance Companies, etc.)
  • 28.
    By Giving UpEquity (i.e. Silent Partner, Not so Silent Partner, Joint Venture)Financial Performance – Measuring The Health of Our Firm
  • 29.
    Financial PerformanceWhat AreFinancial Statements?Financial Statements are the Box Scores in the game of Business. They are the culmination of the accounting process. They are used to convey a concise picture of the profitability and financial position of your company.
  • 30.
    A well-designed PestControl Profit & Loss Statement includes:Revenue - Broken up by department with Recurring & Non- Recurring Revenue accurately displayed Direct Costs - All cost associated with putting a truck on the road & performing service Gross Margin - Revenue minus Direct CostSales & Marketing - All cost associated with sales and marketing function
  • 31.
    A well-designed PestControl Profit & Lossalso includes !!G & A Expenses - The cost associated with running the office. Usually these costs are fixed with regard to transacting business up to a certain level EBITA - Earnings before Interest taxes & Amortization IADT - Interest, Amortization, Depreciation & TaxesNet Income - Net Performance of the Business
  • 32.
    Profit &Loss Ratios & Benchmarks Gross Margin
  • 33.
    TechnicianLabor cost as a percentage of revenue
  • 34.
    ChemicalCost as a percentage of revenue
  • 35.
    SellingCost as a percentage of revenue
  • 36.
    OfficeLabor as a percentage of revenue
  • 37.
    OtherG & A as a percentage of revenueDrilling down in Profit & Loss Statement Why is it so important to setup a P & L using the approach described? It allows us to make accurate conclusions about how our management staff is executing our business strategy.
  • 38.
    Itallows us to isolate revenue types that will add to the value of our business
  • 39.
    Itallows us to isolate expense types so that we can implement cost controlsDrilling down into a Balance SheetThe Balance Sheet allows us to see the prior results of our operations plus any financing activity that has taken place.The P & L tells that how we are doing in terms of profit & the B/S tells us what we have as the results of those profits.
  • 40.
    Drilling down intoa Balance SheetWhat is important about B/S? CASH!
  • 41.
    AccountsReceivable
  • 42.
  • 43.
    CreditLine & Loan Balances
  • 44.
    AccountsPayable
  • 45.
    OwnersEquityDrilling down into a Balance SheetRating our Accounts Receivable We can age our Accounts Receivable
  • 46.
    Current30 days 60 Days Over 90 days with percentage of Total We can try to improve those percentages on monthly basis
  • 47.
    Wecan see how close we are keeping our customers within our terms using a ratio called No of days sales in receivables Calculation: AR balance/(Cumulative Sales/Cumulative days)Drilling down into a Balance SheetAverage Collection Period Calculation: (AR balance/ ( Cumulative Sales / Cumulative days)Drilling down into a Balance SheetLiquidity RatiosA Liquidity ratio is one of the benchmarks that banks, vendor creditdepartments, and others used to determine our ability to pay bills. The two that are most commonly usedCurrent Ratio= (Cash plus AR)/current liabilitiesQuick ratio= Cash/APA Ratio over and above 1.0 means we are healthy. A ratio of less than 1.0 means we have cash flow issues.
  • 48.
    Drilling down intoa Balance SheetCurrent Ratio= (Cash plus AR)/current liabilitiesSo the rows colored in grey are healthy as the ratio is 1.0 or greater than 1.0
  • 49.
  • 50.
    Marketing Math forthe PCOWe want GrowthHow Much? Over What Period of Time?What Resources Will We Need? Equipment, People, Money?Where Will the Growth Come From?New Customers, or More Business from Existing Customers?Is Our Current House in Order to Achieve this Growth?
  • 51.
    Marketing Math forthe PCODefine Growth – Set GoalsExample of a GoalI want to take my Business from $500,000 in Annual Revenue to $1,000,000 in Annual Revenue over the next 4 Years, increasing my profit margin from 12% to 20% for the same period.Not an example of a GoalI want to get Bigger.
  • 52.
    Marketing Math forthe PCOMore Business From Existing CustomersYour Customers Already Know YouThe Cost associated with expanding your relationship is significantly less than new customer acquisition.An excellent way to guarantee yourself a predictable revenue stream while allowing your customers to do predictable expense budgeting.
  • 53.
    Marketing Math forthe PCOIn defining your overall strategy, the MARKETING MIX concept is extremely useful. It is broken into four categories known as the Four P’sof Marketing:Product Price Place Promotion
  • 54.
    Marketing Math forthe PCOPRODUCT - From a marketing prospective our product is our service. We need to define: The Quality The Features The Services The Warranties etc. From a standpoint of practicality, it makes sense that as we grow our business we need to be uniform in our Service Plans.As our customer list grows, it will become extremely difficult to manage a business where every customer’s service is different. Thus, in defining our services we should design a core group of services that are standardized.All of our technicians can be trained to work using standardized methods. In addition our office staff is not faced with differing problems with each customer. STANDARDIZATION OF SERVICES IS KEY!
  • 55.
    Marketing Math forthe PCO PRICEPricing is extremely important.You need to price for profit. Remember our discussion on Breakeven Analysis…Understand how high the bar isthat you are trying to reach!
  • 56.
    Marketing Math forthe PCO PLACEService Area Defined - In designing our business we need to define our service area. Again, if you go outside of your service area, you need to charge a lot more money in order to account for the travel time.The most profitable pest control companies have very well defined service areas. In fact, each office has sub service areas for each route. Sound routing methodology needs to be employed.At this point we should note that you should have well-defined service areas that you will not breach.
  • 57.
    Marketing Math forthe PCOPROMOTIONThis is getting the word out. It’s is not my intention to speak about all of the promotional concepts of marketing a pest control company.
  • 58.
    However, we shouldbe able to track our advertising in our computer system and generate reports that will tell us which advertising works and which does not.
  • 59.
    Promoting your companythrough advertising is the single most important thing that you can do to build your company.
  • 60.
    However, too muchof the wrong type of advertising can sink your company quickly. By tracking which advertising is working through your computer system, you can build successful advertising campaigns that deliver RESULTS.Sales Performance
  • 61.
    Sales PerformanceThere aremany schools of thought on how a sale should be made. Some sales techniques work better depending on the personality of the sales person.Some Sales people Sell management on why Sales can’t be made The best thing about what we do as accountants, is that the numbers don’t lie - no matter which Sales technique are used.
  • 62.
    Sales PerformanceWhat arethe important data points: Number of leads received
  • 63.
    Numberof leads Closed
  • 64.
    Numberof proposals written
  • 65.
    DollarsProposed
  • 66.
  • 67.
    Closing Percentages
  • 68.
    FollowUp actions Including dates
  • 69.
    Commission’sEarned by Sales Staff
  • 70.
    BasePay For Sales PeopleSales PerformanceNumber of leads Received/ClosedSometimes we draw Conclusions based solely on the numbers.We need to distinguish between creative leads and inbound leads. as the ladder will yield much higher percentages.
  • 71.
    Sales PerformanceBatting Average = # Leads Closed # Leads ReceivedPitch Efficiency = # Proposals written # Leads given
  • 72.
    Sales PerformanceSales DollarsEfficiency = # of Dollars Sold # of Dollars Proposed
  • 73.
    Sales Performance Using the proposal Dates and follow-up dates we can age our proposals, last contact dates and make estimates of likeliness of Closure. What we obviously find is the older the proposal the less likely we Close it. What happens if we introduce telemarketing?Sales PerformanceAND LAST BUT NOT LEAST……Sales Compensation as a percentage of Sales=Base salary + Commissions Total Sales
  • 74.
  • 75.
  • 76.
    Lower ExpensesOperationalPerformanceProfitabilityIt is affected by two factors: Revenue
  • 77.
    ExpensesOperational PerformanceRouting willaffect bothRevenue and Expenses.
  • 78.
    Operational PerformanceThe SingleLargest Expense for a Pest Control Company isLABOR Pest control companies for the most part compensate their technicians one of two ways or a combination of both:Technicians are paid an hourly rate.
  • 79.
    Technicians arecompensated as a percentage of their routeOperational PerformanceTechnicians are paid an hourly rate.This rate climbs by 50% (overtime) after the technician works 40 hours in any given week. and or;Technicians are compensated as a percentage of their routeAs a percentage of the dollar value of the jobs that they complete
  • 80.
    Operational PerformanceTo IncreaseProfitability We Need to Increase Efficiency (Fit More Work into Less Time)This Increases Profitability by Increasing Total Dollars of Profit.
  • 81.
    Operational PerformanceUsing OurTechnician Who is Paid Hourly Example 1Let’s say we have a technician that earns $15.00 per hour.Further, let’s say that he can complete one job in an hour that produces $50.00.In this case our labor percentage is 30%(15/50 = .3). This means for every $100.00 of revenue we have a profit of $70.00 (ignoring all other costs)
  • 82.
    Operational PerformanceUsing OurTechnician Who is Paid HourlyExample 2Let’s say we have a technician that earns $15.00 per hour. Further, let’s say that he can complete two jobs in an hour that produces $50.00 each or $100 total. In this case our labor percentage is 15% (15/100 = .15).
  • 83.
    Operational PerformanceUsing OurTechnician Who is Paid HourlyThis means for every $100.00 of revenue we have a profit of $85.00 (ignoring all other costs).By fitting more work into one hour we have been able to increase our profit by $50.00 per hour.Here we have increased our revenue in dollars and decreased our labor expense as a percentage of revenue.
  • 84.
    Operational PerformanceUsing OurTechnician Who is Paid A Percentage Of His RouteExample 1Let’s say we have a technician that earns 25% of dollars produced. Further, let’s say that he can complete one job in an hour that produces $50.00. In this case our profit is $37.50($50.00 – (25% x $50.00) =$37.50) (ignoring all other costs).
  • 85.
    Operational PerformanceUsing OurTechnician Who is Paid A Percentage Of His RouteExample 2Let’s say we have a technician that earns 25% of dollars produced. Further, let’s say that he can complete two jobs in an hour that produces $50.00. In this case our profit is $75.00(($50.00x2) – (25% x $100.00)) =$25.00) (ignoring all other costs).
  • 86.
    Operational PerformanceUsing OurTechnician Who is Paid A Percentage Of His RouteBy fitting more work into one hour we have been able to increase our profit by $37.50 per hour from $37.50 to $75.00 dollars. In this case we increased the revenue by $50.00 per hour while holding our labor expense constant as a percentage of revenue at 25%.
  • 87.
    Operational PerformanceUtilizationOne ofthe most important benchmarks in judging how efficient your routing is called Utilization. Utilization is a calculation that CPA firms and law firms use to see how productive their accountants and lawyers are at billing their time. However this calculation fits our industry perfectly. Quite simply, utilization is the following fraction:
  • 88.
    Operational PerformanceUtilizationTotal TechnicianHours Spent at All Stops During the Time Period_________________________________________________Total Technician Hours Clocked in (Paid Hours) During the Time Period
  • 89.
    Operational PerformanceUtilization ExampleLet’s say that your technician spent 30 hours at various jobs doing actual work for a one week period. Let’s also assume that according to his time card he was punched in and paid for 50 hours.His utilization would be 60% (30hrs worked / 50 Hours Clocked in).This means that he was producing revenue 60% of the time he was clocked in.
  • 90.
    Operational PerformanceUtilizationExample Continued…….Let’ssay your average dollar per hour on your accounts for the day is $75.00. With a 60% utilization you’re actually taking in $45.00 per hour. If your technician clocks in 8 hours for the day, he will produce $360.00 for the day ($75.00 x 60% x 8hrs).If his utilization is 75% he will bring in $450 ($75.00 x 75% x 8hrs). If he is 40% utilized he will bring in $240 ($75 x 40% x 8hrs). These numbers are using the same $75.00 per hour but varying the utilization percentage.
  • 91.
    Operational PerformanceUtilizationThis pointillustrates the fact that there are two ways of increasing daily revenue:Raising your prices (dollars per hour). This is not always feasible.
  • 92.
    Increasing your utilizationby making your routing more efficient.The PMP Pricing Model
  • 93.
    The Pest ManagementPricing Model It is based on two variables:
  • 94.
    Money This isan hourly charge for our service that covers our costs and allows us to make a reasonable profit. How do we know what that hourly rate should be? Accountants calculate this number using a techniquecalledBREAKEVEN ANALYSIS. Time The service time that it takes to fulfill the obligation of eliminating the customer’s Pests under the service program.This includes treatment time and call back time
  • 95.
    Break-Even AnalysisFixed CostsGross Profit per Hour.Break-Even point =in units (service hours)
  • 96.
    DefinitionFixed CostsAny costthat remains constant at any volume of business(i.e. Rent, Advertising, Utilities, etc.)
  • 97.
    DefinitionVariable Costs Costs associated with producing one unit of our service. For our purposes, one unit of a service will be one hour of service. Thus, variable costs are those costs that rise and fall based upon the number of hours that we provide service. Examples Hourly pay for your employees, Workers Compensation Insurance, Material Costs, etc.DefinitionGross ProfitThe difference between the price charged per Unit (Hour of Service) and the Variable Costs.Example If we bill our service at $100 per hour and a technicians gets $20 per hour and all other variable costs associated with providing that hour of service are $35, our gross profit would be $45. (figured: $100 billed less ($20+$35) variable costs).
  • 98.
    Breakeven Point inUnits (Service Hours)What Is My Breakeven Point?Fixed Costs Gross Profit per hour.=
  • 99.
    ExampleIf rent, utilitiesand all other fixed costs are $10,000 and we useour $45.00 gross profit per hr example than our breakeven point is 222.2 hours of serviceat a $100 per hour selling price.After 222.2 hours of service we will start making a profit of $45 per hour.You see the gross profit contributes to paying the fixed costs. Once the fixed costs are paid, the gross profitcontributesto bottom line profit. This is the reason some accountants call gross profit thecontribution margin.
  • 100.
    Gross MarginBreak-Even Point$10,000Fixed Costs$45.00 Per Hr Variable Costs222.22 Hrs to Break Even=
  • 101.
    Is it ReallyThat Simple? YES!!!!However, at various sales levels certain fixed costs rise (i.e. after a certain sales level, a new piece of equipment might have to be added, thus the cost of using that piece of equipment must be added to fixed costs). Therefore, figuring your breakeven point can sometimes be confusing.